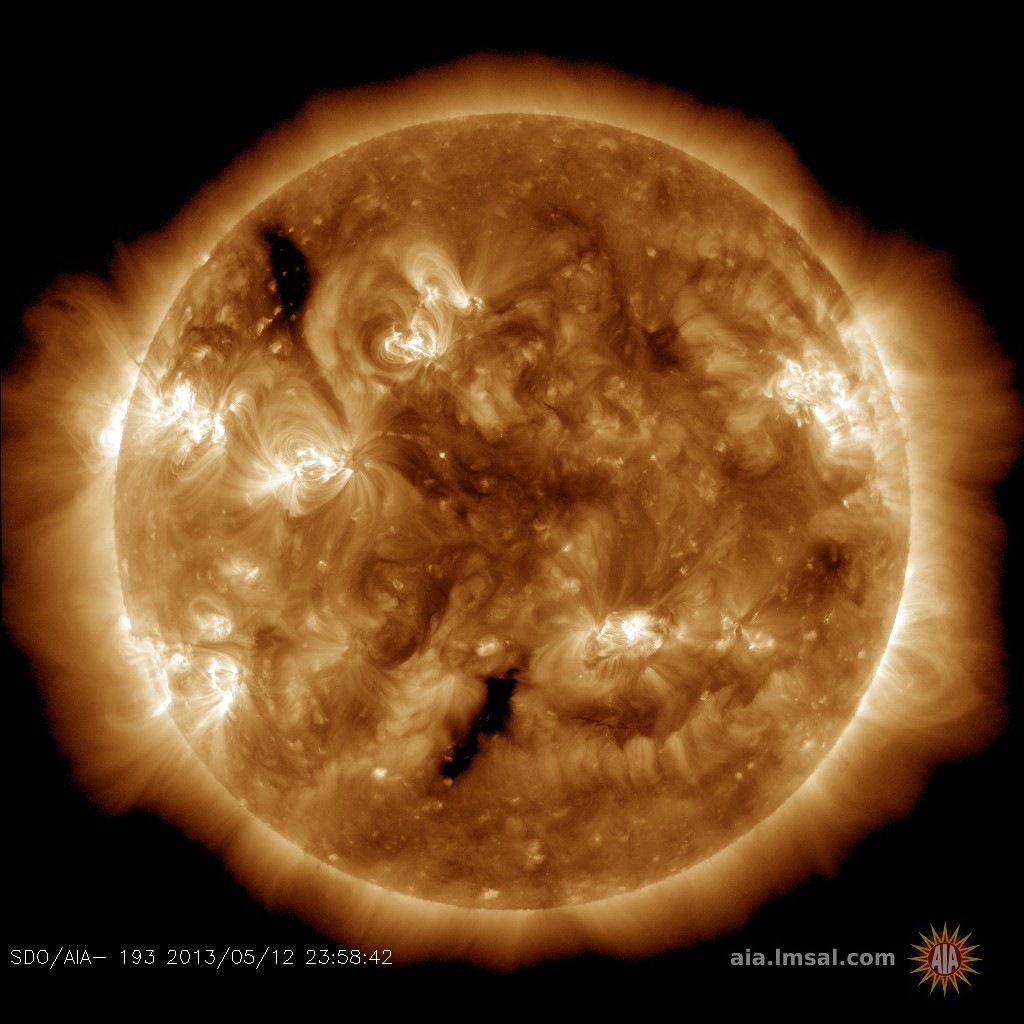
Marianne's Arctic Xpress wishes you a Happy New Year. Learn to photograph auroras with the experts. Full photography tuition, all clothing, and semi-pro camera equipment included. Groups of 2 to 8 welcome. Book Now | | | MAGNETIC STORMS LIKELY THIS WEEK: NOAA forecasters have boosted the odds of polar geomagnetic storms on Jan. 4th and 5th to 65% as a stream of solar wind approaches Earth. The hot wind is flowing from a large hole in the sun's atmosphere. This image, from NASA's Solar Dynamics Observatory, shows the yawning structure almost directly facing Earth on Jan. 3rd: 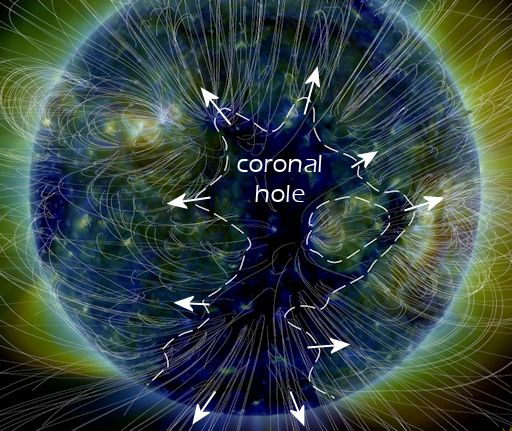
Coronal holes are regions where the sun's magnetic field peels back and allows solar wind to escape. The stream of wind emerging from this coronal hole recently blew past NASA's STEREO-A spacecraft with peak speeds exceeding 700 km/s. Similar high speeds are likely when the stream reaches Earth on Jan. 4th and 5th.
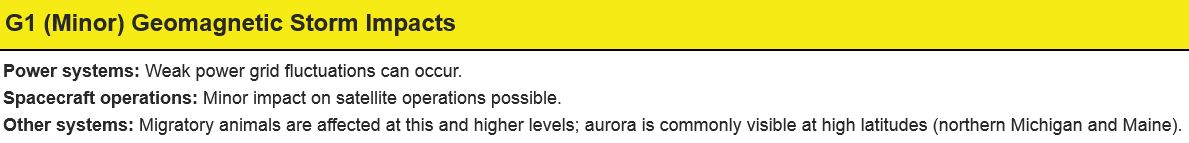
Residents of the Arctic should expect G1-class geomagnetic storms and bright auroras in the nights ahead. Free: Aurora Alerts. Realtime Aurora Photo Gallery ANALEMMA TIMES 9: If you took a picture of the sun at the same time each day, would it remain in the same position? The answer is no, and the figure-8 shape traced out by the sun over the course of a year is called an "analemma." Over the years, many photographers have created analemmas. In 2016, however, Steven Riegel of Colorado Springs CO took it up a notch. He photographed the sun 9 times a day, creating the rare nonalemma: 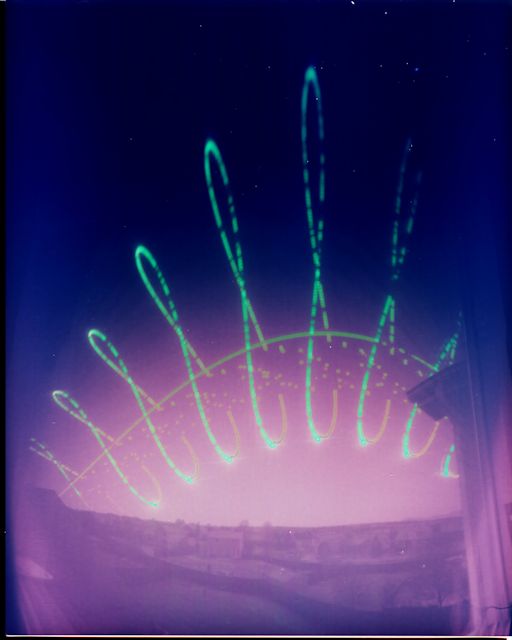
"I opened up a year-long (1 Jan - 31 Dec 2016) analemma exposure on New Year's Day," explains Riegel. " The result is a record of the position of the sun on the hour between 7:00 am and 3:00 pm every day for a full year."
"The camera is just a light-tight box with a pinhole in the side. I put an 8x10 piece of B/W photo paper inside. The pinhole was uncovered for two minutes each hour by a rotating paper mask attached to a cheap electric clock. The image is burned into the photo paper by the bright sunlight."
" I can't claim originality for the technique, but I've only seen a couple of other similar examples done previously," says Riegel. "It's a nerve-wracking time waiting for the year to see if you set things up correctly!" Realtime Space Weather Photo Gallery QUADRANTID METEOR SHOWER: On Tuesday of this week, Earth will pass through a stream of dusty debris from shattered comet 2003 EH1, source of the annual Quadrantid meteor shower. Forecasters expect the shower to peak around 14:00 UT (6 am PST) on Jan. 3rd--timing that favors western parts of North America and islands across the Pacific. As many as 100 meteors per hour could flow from a radiant near the North Star on Tuesday morning. Realtime PSC Photo Gallery
Realtime Airglow Photo Gallery
Realtime Sprite Photo Gallery Every night, a network of NASA all-sky cameras scans the skies above the United States for meteoritic fireballs. Automated software maintained by NASA's Meteoroid Environment Office calculates their orbits, velocity, penetration depth in Earth's atmosphere and many other characteristics. Daily results are presented here on Spaceweather.com. On Jan. 3, 2017, the network reported 50 fireballs.
(29 sporadics, 21 Quadrantids)  In this diagram of the inner solar system, all of the fireball orbits intersect at a single point--Earth. The orbits are color-coded by velocity, from slow (red) to fast (blue). [Larger image] [movies] Potentially Hazardous Asteroids ( PHAs) are space rocks larger than approximately 100m that can come closer to Earth than 0.05 AU. None of the known PHAs is on a collision course with our planet, although astronomers are finding new ones all the time. On January 3, 2017 there were potentially hazardous asteroids. Notes: LD means "Lunar Distance." 1 LD = 384,401 km, the distance between Earth and the Moon. 1 LD also equals 0.00256 AU. MAG is the visual magnitude of the asteroid on the date of closest approach. | | Cosmic Rays in the Atmosphere |
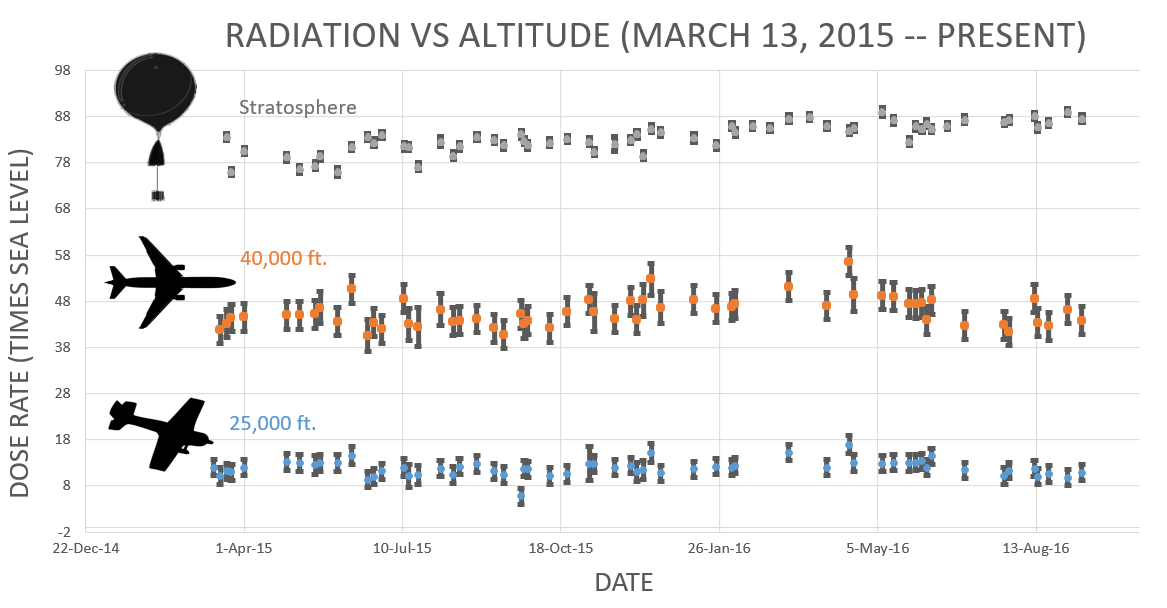
Readers, thank you for your patience while we continue to develop this new section of Spaceweather.com. We've been working to streamline our data reduction, allowing us to post results from balloon flights much more rapidly, and we have developed a new data product, shown here: 
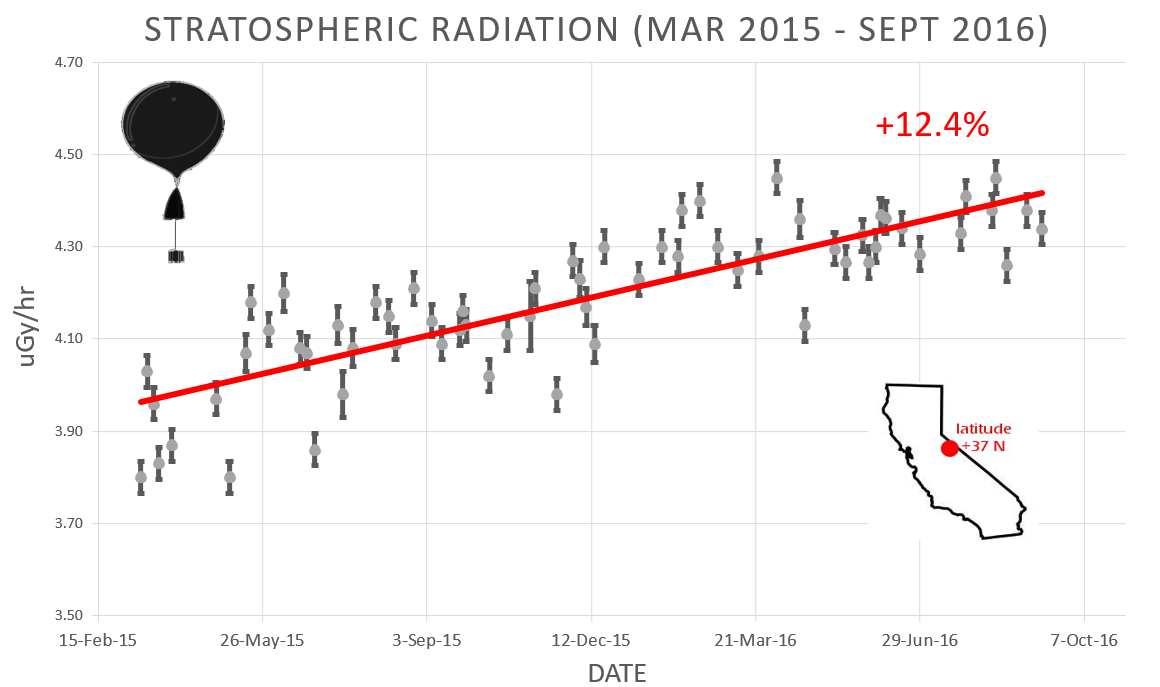
This plot displays radiation measurements not only in the stratosphere, but also at aviation altitudes. Dose rates are expessed as multiples of sea level. For instance, we see that boarding a plane that flies at 25,000 feet exposes passengers to dose rates ~10x higher than sea level. At 40,000 feet, the multiplier is closer to 50x. These measurements are made by our usual cosmic ray payload as it passes through aviation altitudes en route to the stratosphere over California. What is this all about? Approximately once a week, Spaceweather.com and the students of Earth to Sky Calculus fly space weather balloons to the stratosphere over California. These balloons are equipped with radiation sensors that detect cosmic rays, a surprisingly "down to Earth" form of space weather. Cosmic rays can seed clouds, trigger lightning, and penetrate commercial airplanes. Furthermore, there are studies ( #1, #2, #3, #4) linking cosmic rays with cardiac arrhythmias and sudden cardiac death in the general population. Our latest measurements show that cosmic rays are intensifying, with an increase of more than 12% since 2015: 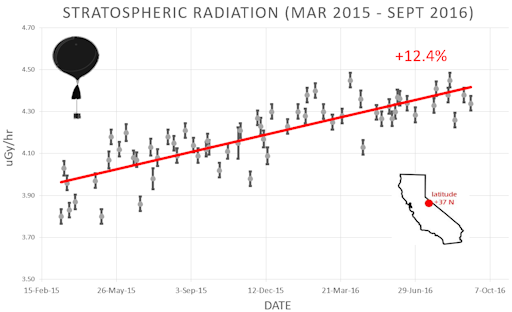
Why are cosmic rays intensifying? The main reason is the sun. Solar storm clouds such as coronal mass ejections (CMEs) sweep aside cosmic rays when they pass by Earth. During Solar Maximum, CMEs are abundant and cosmic rays are held at bay. Now, however, the solar cycle is swinging toward Solar Minimum, allowing cosmic rays to return. Another reason could be the weakening of Earth's magnetic field, which helps protect us from deep-space radiation. The radiation sensors onboard our helium balloons detect X-rays and gamma-rays in the energy range 10 keV to 20 MeV. These energies span the range of medical X-ray machines and airport security scanners. The data points in the graph above correspond to the peak of the Reneger-Pfotzer maximum, which lies about 67,000 feet above central California. When cosmic rays crash into Earth's atmosphere, they produce a spray of secondary particles that is most intense at the entrance to the stratosphere. Physicists Eric Reneger and Georg Pfotzer discovered the maximum using balloons in the 1930s and it is what we are measuring today. | | The official U.S. government space weather bureau | | | The first place to look for information about sundogs, pillars, rainbows and related phenomena. | | | Researchers call it a "Hubble for the sun." SDO is the most advanced solar observatory ever. | | | 3D views of the sun from NASA's Solar and Terrestrial Relations Observatory | | | Realtime and archival images of the Sun from SOHO. | | | from the NOAA Space Environment Center | | | a proud supporter of science education and Spaceweather.com | | | the underlying science of space weather |  | Beautyz for top beauty products reviews and their buying guides | | | These links help Spaceweather.com stay online. Thank you to our supporters! | | 


