Lights Over Lapland is excited to announce that our Customizable Aurora Adventures are available for immediate booking! Reserve your adventure of a lifetime in Abisko National Park, Sweden today! | | |
SOLAR SECTOR BOUNDARY CROSSING: On Nov. 6th, Earth will cross a fold in the heliospheric current sheet--a vast wavy structure in interplanetary space separating regions of opposite magnetic polarity. This is called a "solar sector boundary crossing," and it could trigger geomagnetic activity around Earth's poles. Arctic sky watchers should be alert for auroras when the crossing occurs. Free: Aurora Alerts.
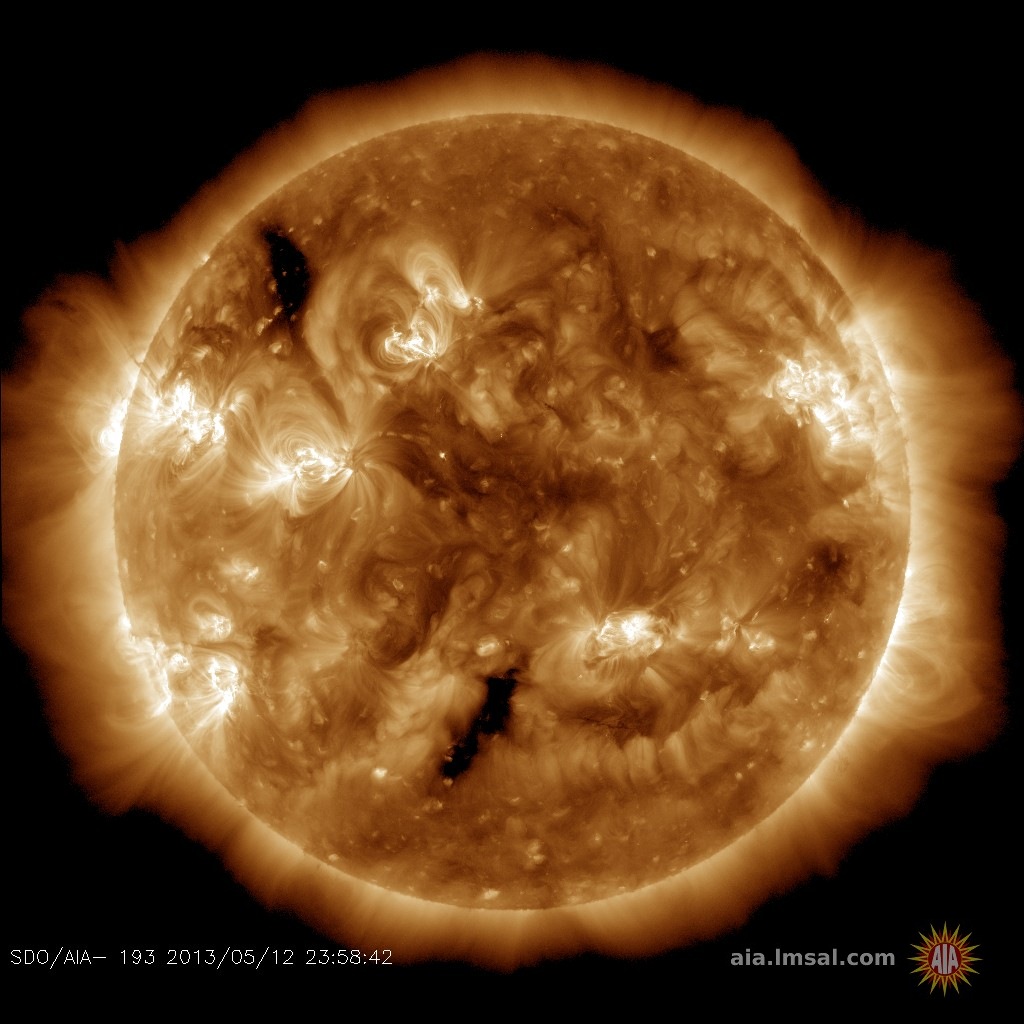
GEOMAGNETIC STORM PREDICTED (G1-CLASS): Earth's crossing of the heliospheric current sheet on Nov. 6th sets the stage for even more action on Nov. 7th. That's when a high-speed solar wind stream is expected to reach our planet. Its source is a large northern hole in the sun's atmosphere:
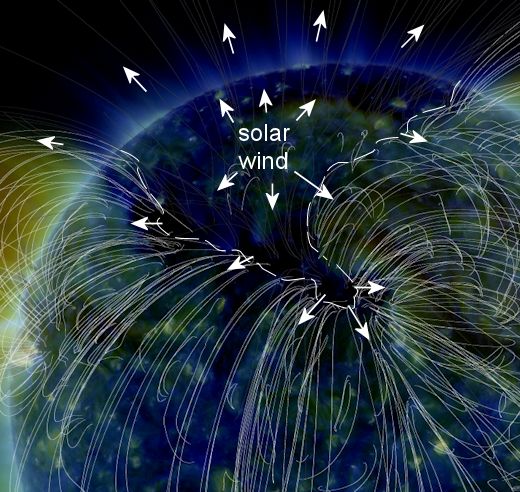
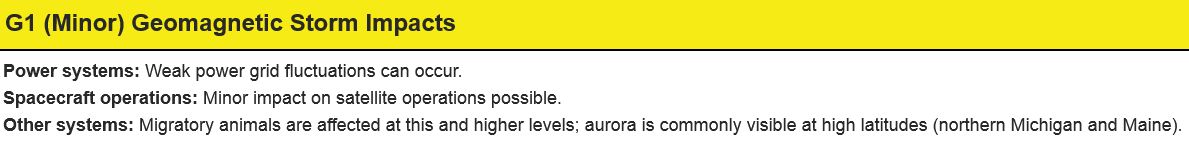
This is a "coronal hole"--a region where the sun's magnetic field peels back and allows solar wind to escape. NOAA forecasters say there is a 45% chance of G1-class geomagnetic storms on Nov. 7th when the emerging wind reaches Earth. There is a similar chance of storms on Nov. 8th.
This is going to be a high-latitude event. Arctic sky watchers will almost certainly see auroras mixed with moonlight on Nov. 7th and 8th. Faint auroras may be seen as well from the northernmost tier of US states--e.g., Maine, the northern tip of Michigan, and Washington. Free: Aurora Alerts.
Realtime Aurora Photo Gallery
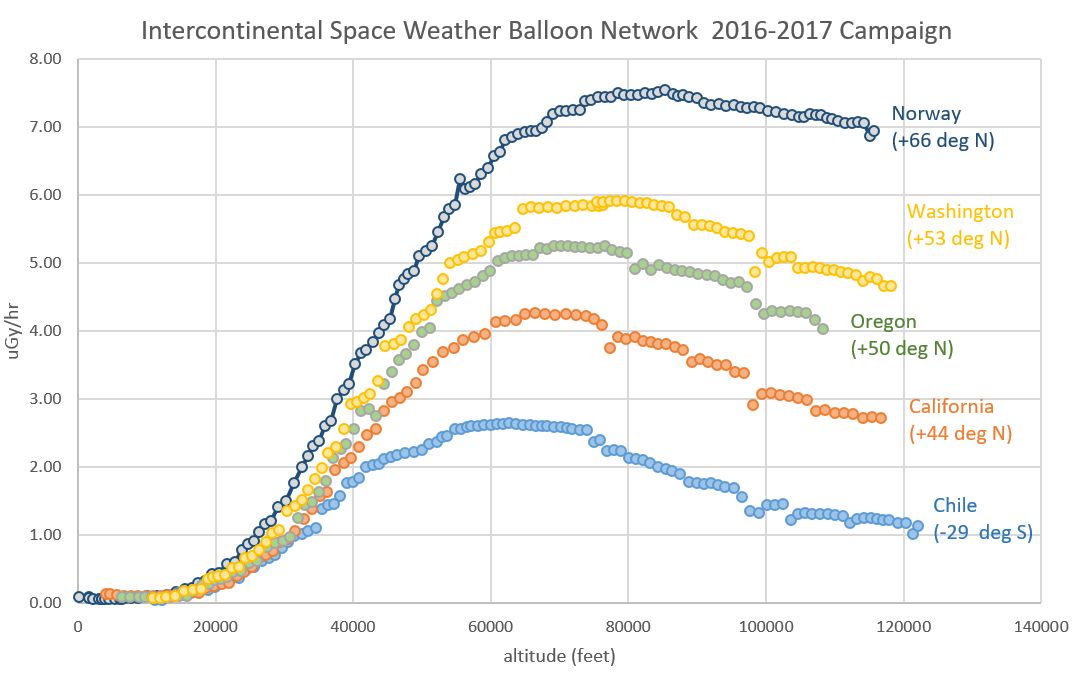
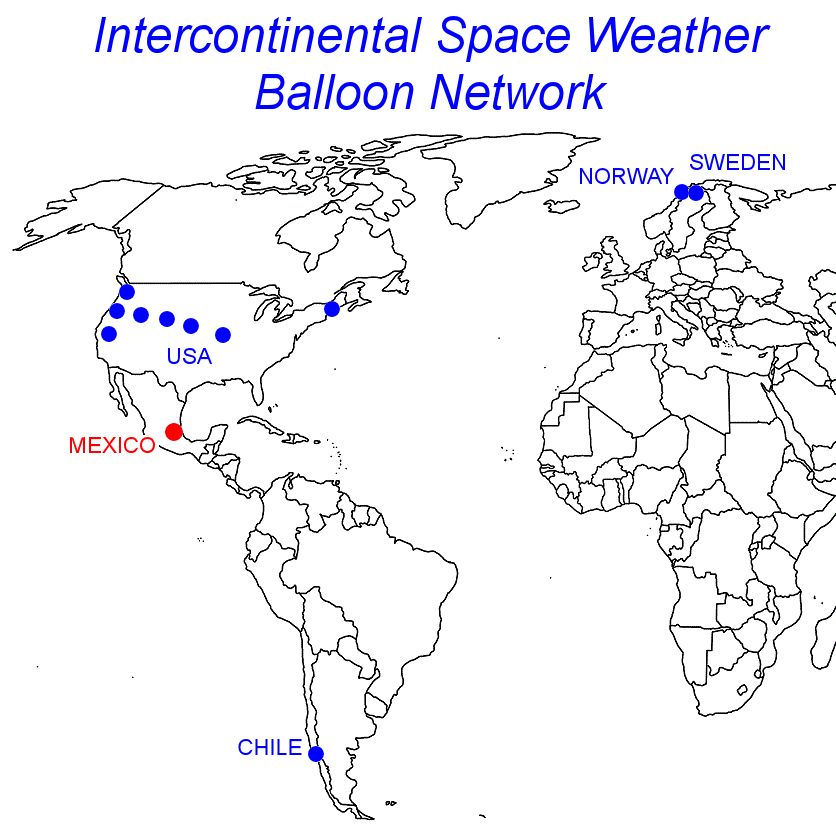
GLOBAL RADIATION MONITORING: Since 2015, Spaceweather.com and the students of Earth to Sky Calculus have conducted an ambitious, ongoing campaign to measure atmospheric radiation around our planet. So far we have flown more than 200 space weather balloons in four countries and a dozen US states. This plot shows sample atmospheric radiation profiles from Norway, Chile, California, Oregon and Washington:
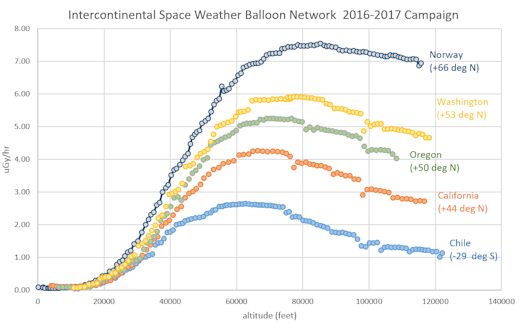
The horizontal axis is altitude. Typical profiles range from ~sea level to more than 100,000 feet, deep inside the stratosphere. The vertical axis is X-ray/gamma-ray dose rate between 10 keV and 20 MeV. These energies span the range of medical X-ray machines and airport security scanners.
Most of the radiation we detect comes from deep space in the form of cosmic rays--but we are always on the alert for other sources, too, such as atmospheric nuclear tests or leaks from power plants. Frequent flights allow us to not only map the geographical distribution of radiation, but also to monitor how it changes with time.
We're about to add a new country to our network: Mexico. On Nov. 8th we will travel to Mexico City to launch space weather balloons in collaboration with Prof. Juan Sumaya and students from the Universidad Autonoma del Estado de México. Stay tuned for reports from Mexico later this week.
Realtime Space Weather Photo Gallery
THIS WATCH FLEW TO SPACE ... AND KEPT ON TICKING: On Aug. 21, 2017, during the Great American Solar Eclipse, the students of Earth to Sky Calculus launched 11 space weather balloons from the path of totality. They soared into the stratosphere, photographing the shadow of the Moon more than 100,000 feet above Earth's surface. As a fundraiser, one of the balloons carried this wristwatch:
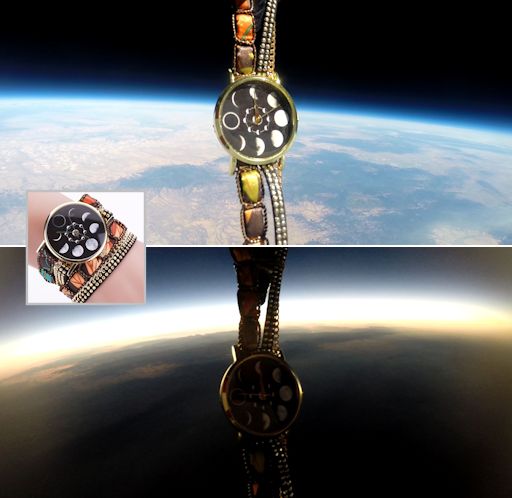
With the sun, Earth, and Moon perfectly aligned, the watch entered the space-cold shadow of the Moon … and kept on ticking! Watch the video. It survived temperatures lower than -49 C and cosmic ray dose rates more than 100 times sea level.
You can have one for $99.95. Each timepiece comes with a unique gift card showing the watch floating at the top of Earth's atmosphere and touching the shadow of the Moon. The interior of the card tells the story of the flight and confirms that this gift has been to the edge of space and back again.
Far Out Gifts: Earth to Sky Store
All proceeds support hands-on STEM education
Every night, a network of
NASA all-sky cameras scans the skies above the United States for meteoritic fireballs. Automated software maintained by NASA's Meteoroid Environment Office calculates their orbits, velocity, penetration depth in Earth's atmosphere and many other characteristics. Daily results are presented here on Spaceweather.com.
On Nov. 5, 2017, the network reported 9 fireballs.
(9 sporadics)
In this diagram of the inner solar system, all of the fireball orbits intersect at a single point--Earth. The orbits are color-coded by velocity, from slow (red) to fast (blue). [Larger image] [movies]
Potentially Hazardous Asteroids (
PHAs) are space rocks larger than approximately 100m that can come closer to Earth than 0.05 AU. None of the known PHAs is on a collision course with our planet, although astronomers are finding
new ones all the time.
On November 5, 2017 there were 1853 potentially hazardous asteroids.
 |
Recent & Upcoming Earth-asteroid encounters: | Asteroid | Date(UT) | Miss Distance | Velocity (km/s) | Diameter (m) |
| 2017 UL8 | 2017-Oct-30 | 1.2 LD | 10.5 | 8 |
| 2017 UK8 | 2017-Oct-30 | 0.6 LD | 14.1 | 8 |
| 2017 UL43 | 2017-Oct-30 | 14.2 LD | 10.4 | 18 |
| 2017 UJ6 | 2017-Oct-30 | 5.5 LD | 11.3 | 18 |
| 2017 UO43 | 2017-Oct-31 | 6.6 LD | 5.7 | 9 |
| 2017 TZ4 | 2017-Oct-31 | 19.3 LD | 13.1 | 96 |
| 2003 UV11 | 2017-Oct-31 | 15 LD | 24.5 | 447 |
| 2017 UP6 | 2017-Oct-31 | 15.1 LD | 11.6 | 22 |
| 2017 UO2 | 2017-Oct-31 | 11 LD | 8.7 | 22 |
| 2017 UD43 | 2017-Nov-01 | 4.7 LD | 8.8 | 7 |
| 2017 UL44 | 2017-Nov-03 | 13.3 LD | 15.4 | 64 |
| 2017 UX42 | 2017-Nov-05 | 10.5 LD | 2.6 | 7 |
| 2017 US7 | 2017-Nov-05 | 7.1 LD | 8.8 | 13 |
| 2017 UJ7 | 2017-Nov-05 | 16.8 LD | 13 | 28 |
| 2017 UJ43 | 2017-Nov-05 | 4.6 LD | 7.3 | 10 |
| 2013 BD74 | 2017-Nov-06 | 10.6 LD | 9 | 51 |
| 2017 TZ3 | 2017-Nov-09 | 10.3 LD | 8.7 | 39 |
| 444584 | 2017-Nov-17 | 8.7 LD | 14.8 | 324 |
| 2008 WM61 | 2017-Dec-03 | 3.8 LD | 4.7 | 16 |
| 2015 XX169 | 2017-Dec-14 | 9.7 LD | 6.3 | 11 |
| 2011 YD29 | 2017-Dec-19 | 17.6 LD | 7.7 | 20 |
| 2006 XY | 2017-Dec-20 | 6.5 LD | 5 | 56 |
| 2017 TS3 | 2017-Dec-22 | 18.2 LD | 10.2 | 133 |
| 418849 | 2017-Dec-22 | 15.3 LD | 17.4 | 257 |
| 2015 YQ1 | 2017-Dec-22 | 17.3 LD | 11.1 | 9 |
| 2017 QL33 | 2017-Dec-30 | 13.3 LD | 8.2 | 191 |
| 2015 RT1 | 2018-Jan-02 | 19.7 LD | 9 | 30 |
Notes: LD means "Lunar Distance." 1 LD = 384,401 km, the distance between Earth and the Moon. 1 LD also equals 0.00256 AU. MAG is the visual magnitude of the asteroid on the date of closest approach. | | Cosmic Rays in the Atmosphere |
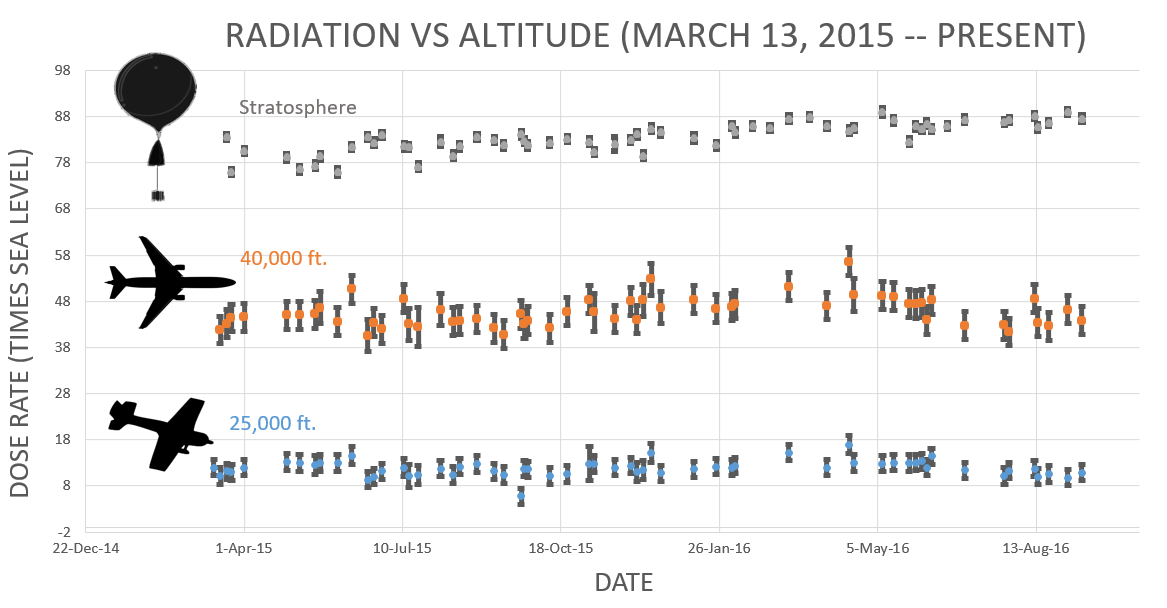
Readers, thank you for your patience while we continue to develop this new section of Spaceweather.com. We've been working to streamline our data reduction, allowing us to post results from balloon flights much more rapidly, and we have developed a new data product, shown here:

This plot displays radiation measurements not only in the stratosphere, but also at aviation altitudes. Dose rates are expessed as multiples of sea level. For instance, we see that boarding a plane that flies at 25,000 feet exposes passengers to dose rates ~10x higher than sea level. At 40,000 feet, the multiplier is closer to 50x. These measurements are made by our usual cosmic ray payload as it passes through aviation altitudes en route to the stratosphere over California.
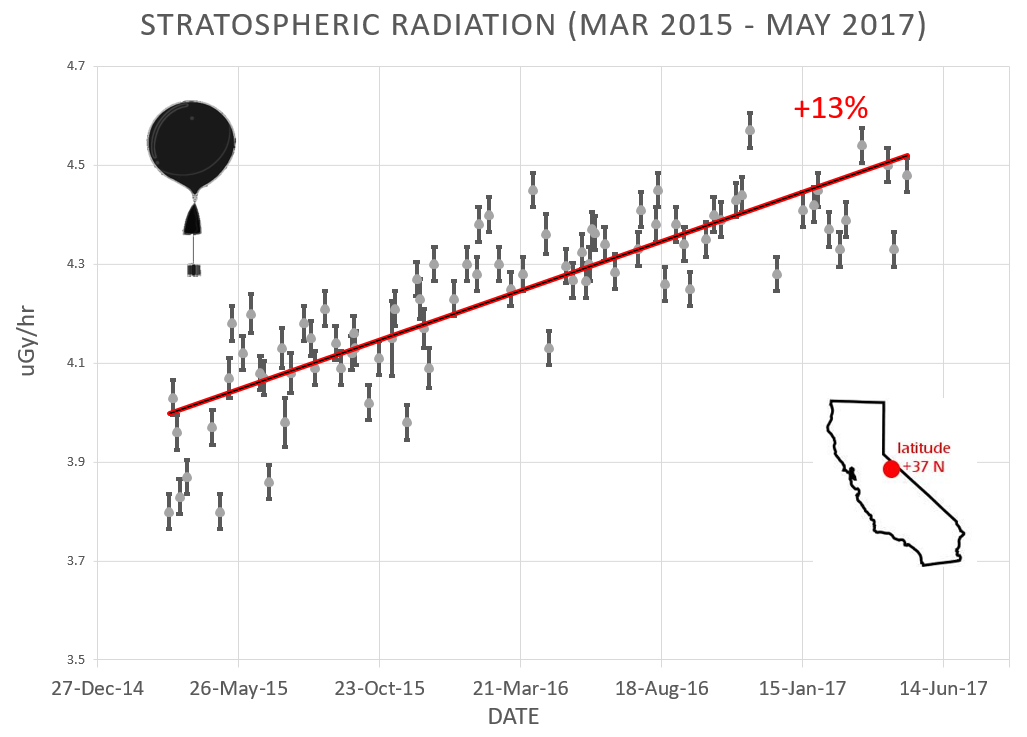
What is this all about? Approximately once a week, Spaceweather.com and the students of Earth to Sky Calculus fly space weather balloons to the stratosphere over California. These balloons are equipped with radiation sensors that detect cosmic rays, a surprisingly "down to Earth" form of space weather. Cosmic rays can seed clouds, trigger lightning, and penetrate commercial airplanes. Furthermore, there are studies ( #1, #2, #3, #4) linking cosmic rays with cardiac arrhythmias and sudden cardiac death in the general population. Our latest measurements show that cosmic rays are intensifying, with an increase of more than 13% since 2015:
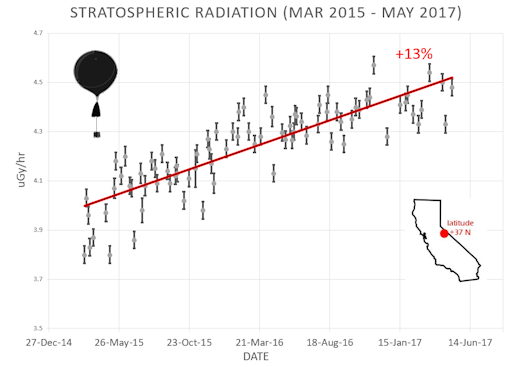
Why are cosmic rays intensifying? The main reason is the sun. Solar storm clouds such as coronal mass ejections (CMEs) sweep aside cosmic rays when they pass by Earth. During Solar Maximum, CMEs are abundant and cosmic rays are held at bay. Now, however, the solar cycle is swinging toward Solar Minimum, allowing cosmic rays to return. Another reason could be the weakening of Earth's magnetic field, which helps protect us from deep-space radiation.
The radiation sensors onboard our helium balloons detect X-rays and gamma-rays in the energy range 10 keV to 20 MeV. These energies span the range of medical X-ray machines and airport security scanners.
The data points in the graph above correspond to the peak of the Reneger-Pfotzer maximum, which lies about 67,000 feet above central California. When cosmic rays crash into Earth's atmosphere, they produce a spray of secondary particles that is most intense at the entrance to the stratosphere. Physicists Eric Reneger and Georg Pfotzer discovered the maximum using balloons in the 1930s and it is what we are measuring today.
| | The official U.S. government space weather bureau |
| | The first place to look for information about sundogs, pillars, rainbows and related phenomena. |
| | Researchers call it a "Hubble for the sun." SDO is the most advanced solar observatory ever. |
| | 3D views of the sun from NASA's Solar and Terrestrial Relations Observatory |
| | Realtime and archival images of the Sun from SOHO. |
| | from the NOAA Space Environment Center |
| | fun to read, but should be taken with a grain of salt! Forecasts looking ahead more than a few days are often wrong. |
| | from the NOAA Space Environment Center |
| | the underlying science of space weather |
 | Reviews here can help you to pick up best memory foam mattresses. |
| | These links help Spaceweather.com stay online. Thank you to our supporters! |
| | | | | | |


