Spotless Days Current Stretch: 3 days 2017 total: 66 days (23%) 2016 total: 32 days (9%) 2015 total: 0 days (0%) 2014 total: 1 day (<1%) 2013 total: 0 days (0%) 2012 total: 0 days (0%) 2011 total: 2 days (<1%) 2010 total: 51 days (14%) 2009 total: 260 days (71%) Updated 19 Oct 2017
Geomagnetic Storms: Probabilities for significant disturbances in Earth's magnetic field are given for three activity levels: active, minor storm, severe storm
Updated at: 2017 Oct 19 2200 UTC
Mid-latitudes
0-24 hr
24-48 hr
ACTIVE
25 %
15 %
MINOR
05 %
05 %
SEVERE
01 %
01 %
High latitudes
0-24 hr
24-48 hr
ACTIVE
15 %
15 %
MINOR
30 %
25 %
SEVERE
35 %
20 %
Thursday, Oct. 19, 2017
What's up in space
Lights Over Lapland is excited to announce that our Customizable Aurora Adventures are available for immediate booking! Reserve your adventure of a lifetime in Abisko National Park, Sweden today!
CO-ROTATING INTERACTION REGION: NOAA forecasters estimate a 55% chance of polar geomagnetic storms on Oct. 21st when a co-rotating interaction region (CIR) is expected to hit Earth's magnetic field. CIRs are transition zones between fast- and slow-moving solar wind streams. Solar wind plasma piles up in these regions, producing density gradients and shock waves that do a good job of sparking auroras. Free:Aurora Alerts.
TWO PLANETS AND A SOLAR STORM: Yesterday, Oct. 18th, something behind the eastern edge of the sun exploded. A massive cloud of plasma (CME) raced away from the blast site -- right into a bright conjunction. Jupiter and Mercury were less than 1o apart when the CME passed by:
Credit: The Solar and Heliospheric Observatory (SOHO)
If this meeting of planets happened in the night sky, it would have been widely observed. Because it was so close to the glaring sun, no human could see it. Only the orbiting Solar and Heliospheric Observatory, with its sun-blocking coronagraph, could record such a scene.
The CME missed everything. It sailed wide of Mercury, Jupiter, and Earth as well. Forecasters expect no geomagnetic storms as a result of the blast.
WHAT IS THAT OBJECT CIRCLING EARTH? In 2016, astronomers discovered an object loosely circling Earth. Named "2016 HO3," the faint speck of light travels around the sun alongside our planet, always at least 38 times as far away as the Moon. What is it? Astronomers at the University of Arizona recently used the Large Binocular Telescope on Mount Graham to learn more about 2016 HO3, and they have an answer. Scroll past the video to learn more.
It's an asteroid, no more than 100 meters across, as opposed to, say, a burned out rocket booster or other piece of Apollo space junk.
"Our observations show that HO3 rotates once every 28 minutes and is made of materials similar to asteroids," says University of Arizona professor Vishnu Reddy who led the research team.
One way to visualize HO3's orbit is by picturing a hula hoop dancer — the sun in this analogy — twirling two hoops around the hips at the same time, ever so slightly out of sync. While it orbits the sun, the object makes yearly loops around the Earth. As a result, the object appears to orbit the Earth, but it is not gravitationally bound to our planet.
"We refer to it as a quasi-satellite of Earth," says Paul Chodas of JPL. "One other asteroid -- 2003 YN107 -- followed a similar orbital pattern for a while over 10 years ago, but it has since departed our vicinity. This asteroid is much more locked onto us. Our calculations indicate 2016 HO3 has been a stable quasi-satellite of Earth for almost a century, and it will continue to follow this pattern as Earth's companion for centuries to come."
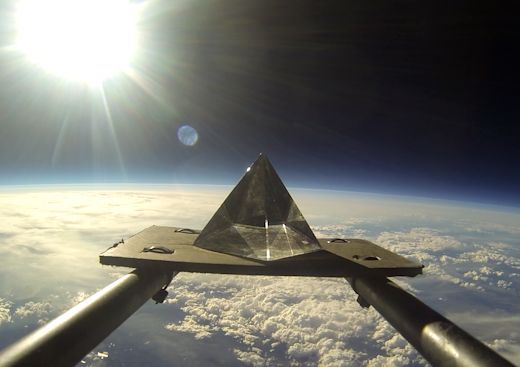
PYRAMID FLIES THROUGH SOLAR STORM: On Sept. 10, 2017, giant sunspot AR2673 exploded, producing an X8-class solar flare. The powerful blast accelerated a stream of electrons and protons toward Earth. By the time the particles arrived, this crystal pyramid was waiting for them at the top of Earth's atmosphere:
What was it doing up there? It hitched a ride onboard a space weather balloon, launched by the students of Earth to Sky Calculus to measure radiation from the flare. In addition to the pyramid (flown for fundraising), the balloon's payload carried an array of X-ray/gamma-ray detectors, cameras, temperature/pressure sensors, GPS altimeters and, of course, extra pyramids.
You can have one for $119.95. Each pyramid comes with a unique gift card showing the crystal floating at the top of Earth's atmosphere. The interior of the card tells the story of the flight and confirms that this gift has been to the edge of space and back again.
Every night, a network of NASA all-sky cameras scans the skies above the United States for meteoritic fireballs. Automated software maintained by NASA's Meteoroid Environment Office calculates their orbits, velocity, penetration depth in Earth's atmosphere and many other characteristics. Daily results are presented here on Spaceweather.com.
On Oct. 19, 2017, the network reported 0 fireballs. (0 sporadics)
In this diagram of the inner solar system, all of the fireball orbits intersect at a single point--Earth. The orbits are color-coded by velocity, from slow (red) to fast (blue). [Larger image] [movies]
Near Earth Asteroids
Potentially Hazardous Asteroids (PHAs) are space rocks larger than approximately 100m that can come closer to Earth than 0.05 AU. None of the known PHAs is on a collision course with our planet, although astronomers are finding new ones all the time.
On October 19, 2017 there were 1847 potentially hazardous asteroids.
Notes: LD means "Lunar Distance." 1 LD = 384,401 km, the distance between Earth and the Moon. 1 LD also equals 0.00256 AU. MAG is the visual magnitude of the asteroid on the date of closest approach.
Cosmic Rays in the Atmosphere
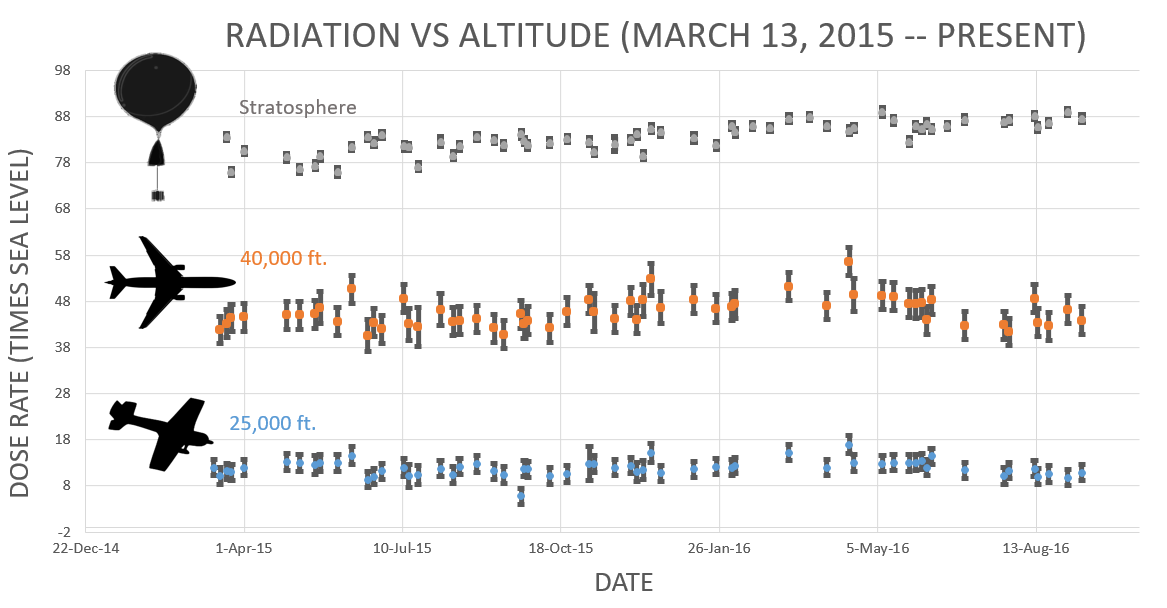
Readers, thank you for your patience while we continue to develop this new section of Spaceweather.com. We've been working to streamline our data reduction, allowing us to post results from balloon flights much more rapidly, and we have developed a new data product, shown here:
This plot displays radiation measurements not only in the stratosphere, but also at aviation altitudes. Dose rates are expessed as multiples of sea level. For instance, we see that boarding a plane that flies at 25,000 feet exposes passengers to dose rates ~10x higher than sea level. At 40,000 feet, the multiplier is closer to 50x. These measurements are made by our usual cosmic ray payload as it passes through aviation altitudes en route to the stratosphere over California.
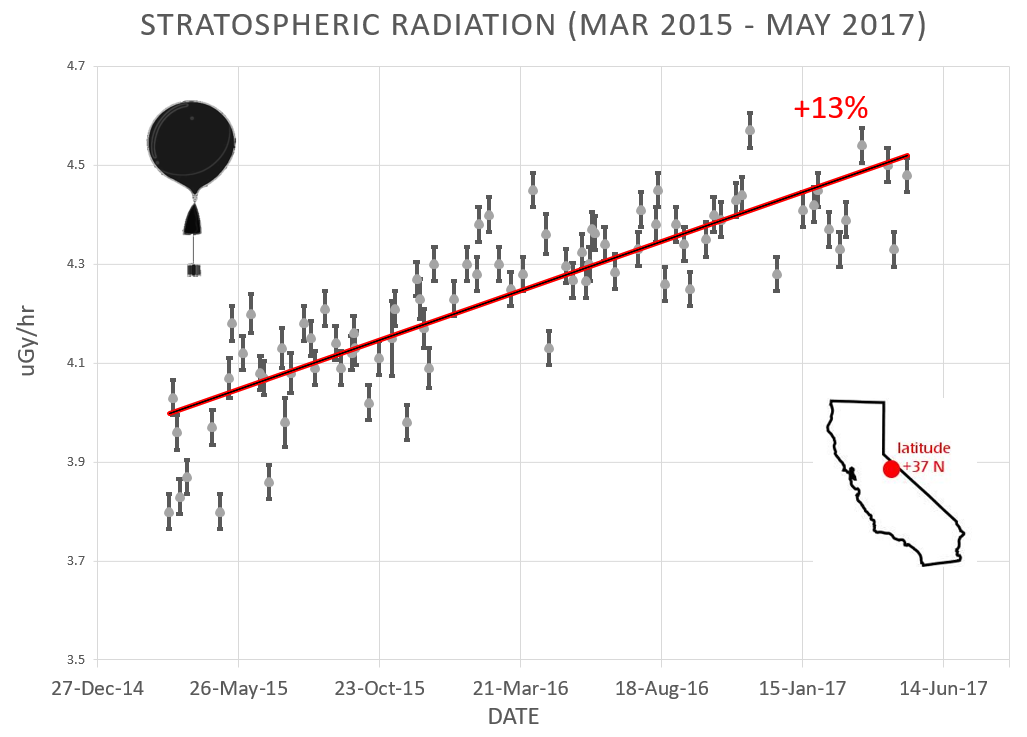
What is this all about? Approximately once a week, Spaceweather.com and the students of Earth to Sky Calculus fly space weather balloons to the stratosphere over California. These balloons are equipped with radiation sensors that detect cosmic rays, a surprisingly "down to Earth" form of space weather. Cosmic rays can seed clouds, trigger lightning, and penetrate commercial airplanes. Furthermore, there are studies ( #1, #2, #3, #4) linking cosmic rays with cardiac arrhythmias and sudden cardiac death in the general population. Our latest measurements show that cosmic rays are intensifying, with an increase of more than 13% since 2015:
Why are cosmic rays intensifying? The main reason is the sun. Solar storm clouds such as coronal mass ejections (CMEs) sweep aside cosmic rays when they pass by Earth. During Solar Maximum, CMEs are abundant and cosmic rays are held at bay. Now, however, the solar cycle is swinging toward Solar Minimum, allowing cosmic rays to return. Another reason could be the weakening of Earth's magnetic field, which helps protect us from deep-space radiation.
The radiation sensors onboard our helium balloons detect X-rays and gamma-rays in the energy range 10 keV to 20 MeV. These energies span the range of medical X-ray machines and airport security scanners.
The data points in the graph above correspond to the peak of the Reneger-Pfotzer maximum, which lies about 67,000 feet above central California. When cosmic rays crash into Earth's atmosphere, they produce a spray of secondary particles that is most intense at the entrance to the stratosphere. Physicists Eric Reneger and Georg Pfotzer discovered the maximum using balloons in the 1930s and it is what we are measuring today.


