 | | | Switch to: Europe, USA, New Zealand, Antarctica Credit: NOAA/Ovation  Planetary K-index Planetary K-index
Now: Kp= 2 quiet
24-hr max: Kp= 3 quiet
explanation | more data
Interplanetary Mag. Field
Btotal: 4.7 nT
Bz: 1.3 nT north
more data: ACE, DSCOVR
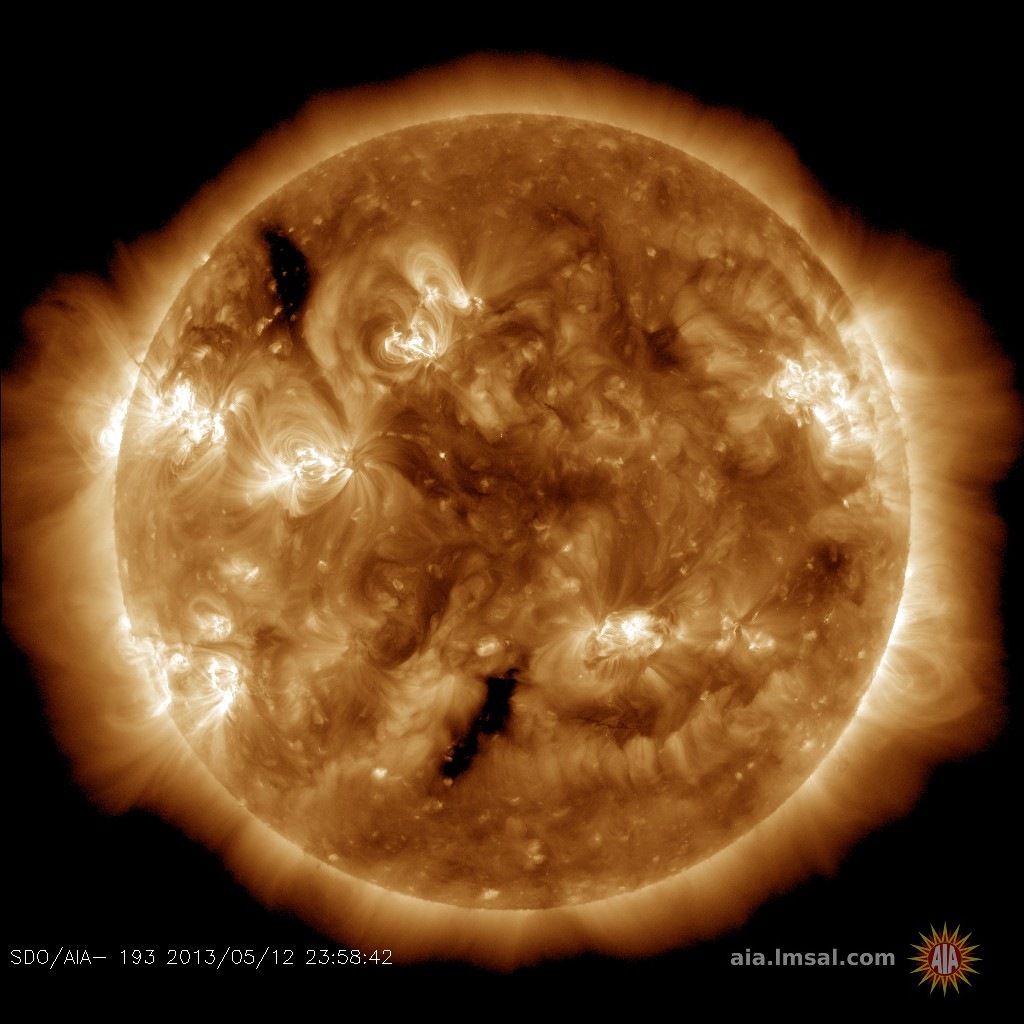
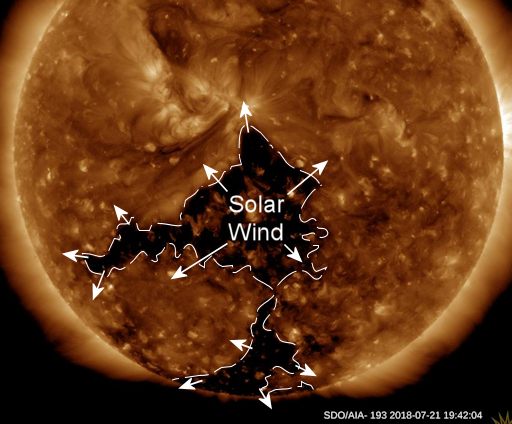
Updated: Today at 2352 UT Coronal Holes: 21 Jul 18 
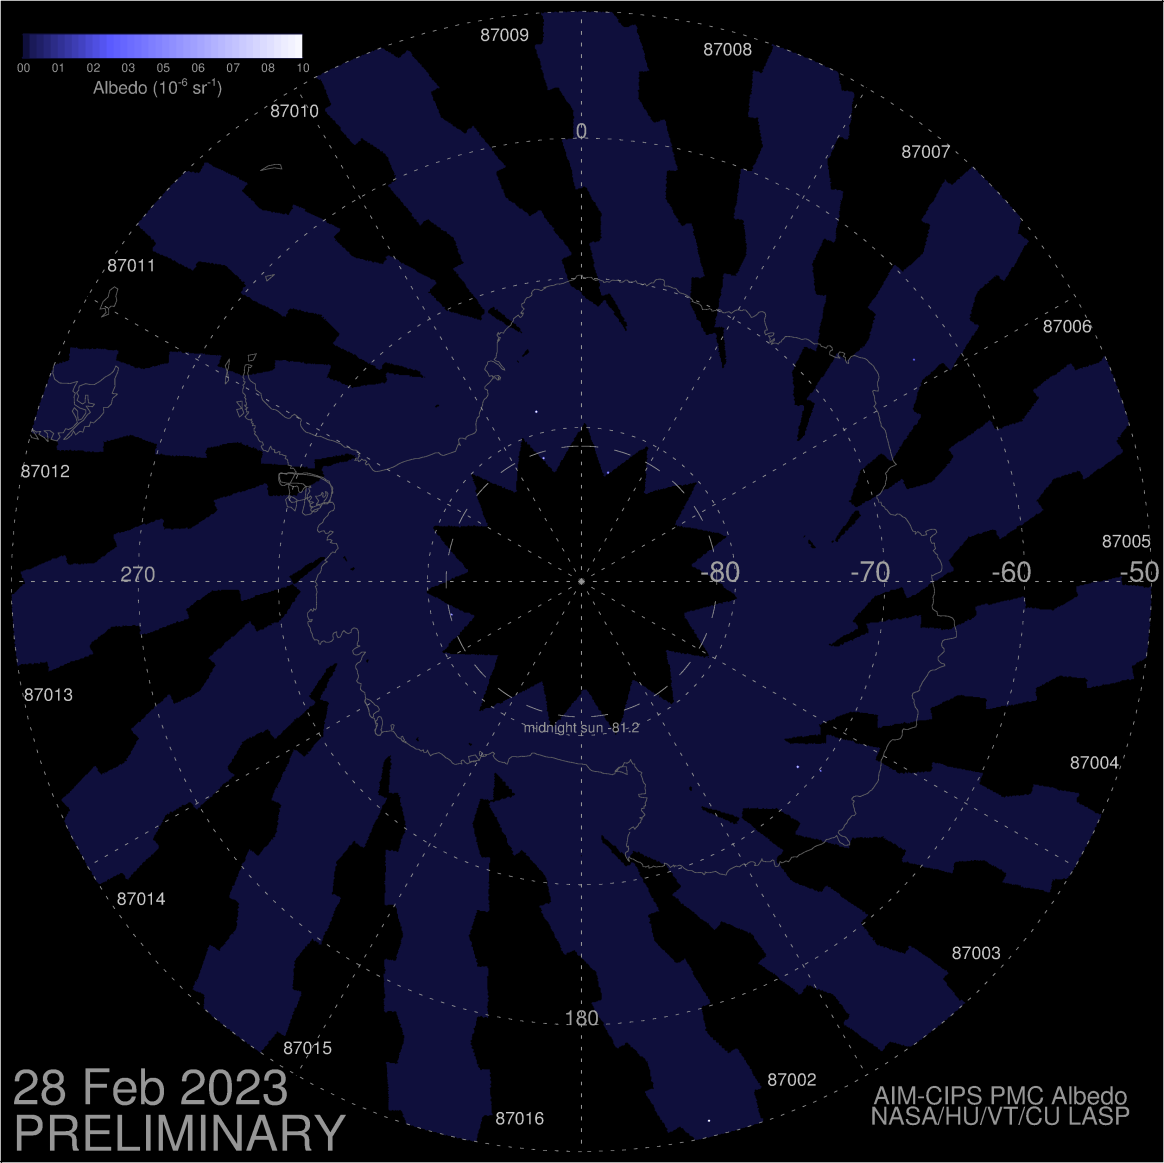
Solar wind flowing from this large coronal hole should reach Earth on July 24th. Credit: SDO/AIA  Noctilucent Clouds The season for noctilucent clouds in he northern hemisphere is underway. Check here daily for the latest images from NASA's AIM spacecraft. Switch view: Europe, USA, Asia, Polar Updated at: 07-21-2018 14:55:02 Noctilucent Clouds The season for noctilucent clouds in he northern hemisphere is underway. Check here daily for the latest images from NASA's AIM spacecraft. Switch view: Europe, USA, Asia, Polar Updated at: 07-21-2018 14:55:02 SPACE WEATHER
NOAA Forecasts | | Updated at: 2018 Jul 21 2200 UTC FLARE | 0-24 hr | 24-48 hr | CLASS M | 01 % | 01 % | CLASS X | 01 % | 01 % | Geomagnetic Storms:
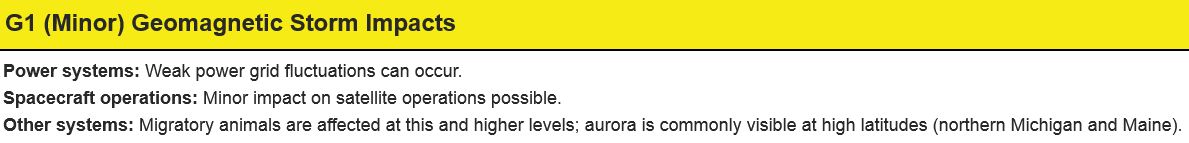
Probabilities for significant disturbances in Earth's magnetic field are given for three activity levels: active, minor storm, severe storm Updated at: 2018 Jul 21 2200 UTC Mid-latitudes | 0-24 hr | 24-48 hr | ACTIVE | 15 % | 25 % | MINOR | 05 % | 10 % | SEVERE | 01 % | 01 % | High latitudes | 0-24 hr | 24-48 hr | ACTIVE | 15 % | 15 % | MINOR | 25 % | 25 % | SEVERE | 20 % | 35 % | | | |  | | | | | | | | | | | All-inclusive Northern Lights trips in Tromsø, Norway. Small groups, big experiences! Highly qualified guides ensure unique and unforgettable adventures with a personal touch. Visit Explore the Arctic | | | GEOMAGNETIC STORM PREDICTED: NOAA analysts predict a G1-class geomagnetic storm on July 24th when a stream of solar wind is expected to hit Earth's magnetic field. The gaseous material is flowing from a large hole in the sun's atmosphere. High-latitude sky watchers should be alert for auroras. Free: Aurora Alerts. UNPREDICTABLE GREEN COMET: On July 1st, Comet PANSTARRS (C/2017 S3) exploded. Its green atmosphere ballooned in size, large enough to swallow Jupiter twice, and its brightness increased 16-fold. Barely a week later, the comet fizzled, dimming almost as much as it had brightened. Then it exploded again! On July 15th Comet PanSTARRS regained all it had lost and more. Michael Jaeger of Jauerling, Austria, captured the comet's newly-formed tail on July 20th: 
"The comet is already fading again, and it seems to have lost much of its tail on July 21st," Jaeger says. Why is Comet PanSTARRS so unpredictable? Probably because it has never felt the heat of the sun before. The comet is arriving from the Oort cloud, a vast reservoir of fresh comets in the outermost solar system. This is its first time among the inner planets. Unfamiliar warmth is making veins of fresh ice pop and fizz as the comet approaches--an entirely unpredictable process. 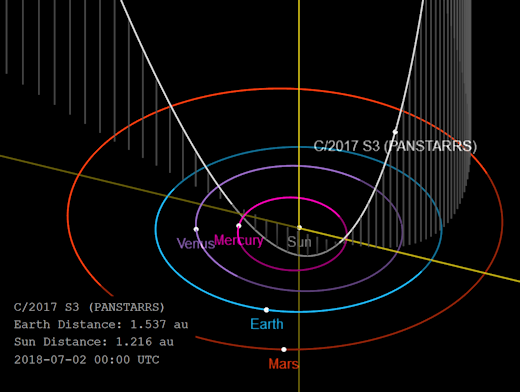
Click to launch an interactive 3D visualization of the comet's orbit from JPL
At the moment, Comet PanSTARRS shines like a 7th or 8th magnitude star--just below the limit of naked-eye visibility. It is expected to brighten many-fold as it approaches the sun inside the orbit of Mercury in August. Experts suggest it will max out at magnitude +3, which will make it dimly visible to the unaided eye and a very nice target for backyard telescopes. However, stay tuned for the unexpected. Realtime Comet Photo Gallery A MAGIC RING IN THE STRATOSPHERE: There are only a few left. Last month, the students of Earth to Sky Calculus launched a space weather balloon to the stratosphere over New Zealand. In the payload, alongside cosmic ray sensors, were rings of power. Here's one flying 108,345 feet above Hobbiton, the movie set for the Lord of the Rings: 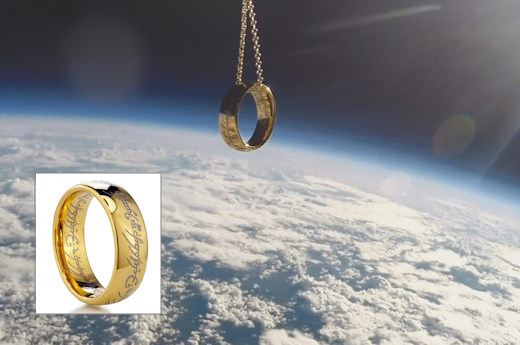
You can have one for $149.95. The ring is made of golden-colored tungsten and inscribed with the authentic Mordor script of the One Ring. This far out gift comes with a greeting card showing the ring in flight and telling the story of its journey to the edge of space. Sales support the Earth to Sky Calculus cosmic ray ballooning program and hands-on STEM research. Far Out Gifts: Earth to Sky Store
All sales support hands-on STEM education
Realtime Space Weather Photo Gallery
Realtime Aurora Photo Gallery
Realtime Noctilucent Cloud Photo Gallery
Every night, a network of NASA all-sky cameras scans the skies above the United States for meteoritic fireballs. Automated software maintained by NASA's Meteoroid Environment Office calculates their orbits, velocity, penetration depth in Earth's atmosphere and many other characteristics. Daily results are presented here on Spaceweather.com. On Jul. 21, 2018, the network reported 57 fireballs.
(57 sporadics)  In this diagram of the inner solar system, all of the fireball orbits intersect at a single point--Earth. The orbits are color-coded by velocity, from slow (red) to fast (blue). [Larger image] [movies] Potentially Hazardous Asteroids ( PHAs) are space rocks larger than approximately 100m that can come closer to Earth than 0.05 AU. None of the known PHAs is on a collision course with our planet, although astronomers are finding new ones all the time. On July 21, 2018 there were 1912 potentially hazardous asteroids.
 | Recent & Upcoming Earth-asteroid encounters: | Asteroid | Date(UT) | Miss Distance | Velocity (km/s) | Diameter (m) | | 2018 NM | 2018-Jul-17 | 1.4 LD | 6.7 | 19 | | 2018 NL4 | 2018-Jul-18 | 10.4 LD | 12.7 | 53 | | 2018 OQ | 2018-Jul-18 | 3.7 LD | 6.1 | 18 | | 2018 NQ1 | 2018-Jul-19 | 16.4 LD | 6 | 32 | | 2018 OF | 2018-Jul-19 | 14.7 LD | 14 | 49 | | 2018 NE1 | 2018-Jul-21 | 10.1 LD | 14.2 | 73 | | 2018 NF4 | 2018-Jul-21 | 18.8 LD | 12.8 | 114 | | 2018 OL | 2018-Jul-22 | 11.5 LD | 16.1 | 57 | | 2018 NR1 | 2018-Jul-27 | 17.1 LD | 5.1 | 35 | | 2018 LQ2 | 2018-Aug-27 | 9.4 LD | 1.5 | 39 | | 2016 GK135 | 2018-Aug-28 | 16.8 LD | 2.8 | 9 | | 2016 NF23 | 2018-Aug-29 | 13.3 LD | 9 | 93 | | 1998 SD9 | 2018-Aug-29 | 4.2 LD | 10.7 | 51 | | 2018 DE1 | 2018-Aug-30 | 15.2 LD | 6.5 | 28 | | 2001 RQ17 | 2018-Sep-02 | 19.3 LD | 8.3 | 107 | | 2015 FP118 | 2018-Sep-03 | 12.3 LD | 9.8 | 490 | Notes: LD means "Lunar Distance." 1 LD = 384,401 km, the distance between Earth and the Moon. 1 LD also equals 0.00256 AU. MAG is the visual magnitude of the asteroid on the date of closest approach. | | Cosmic Rays in the Atmosphere |
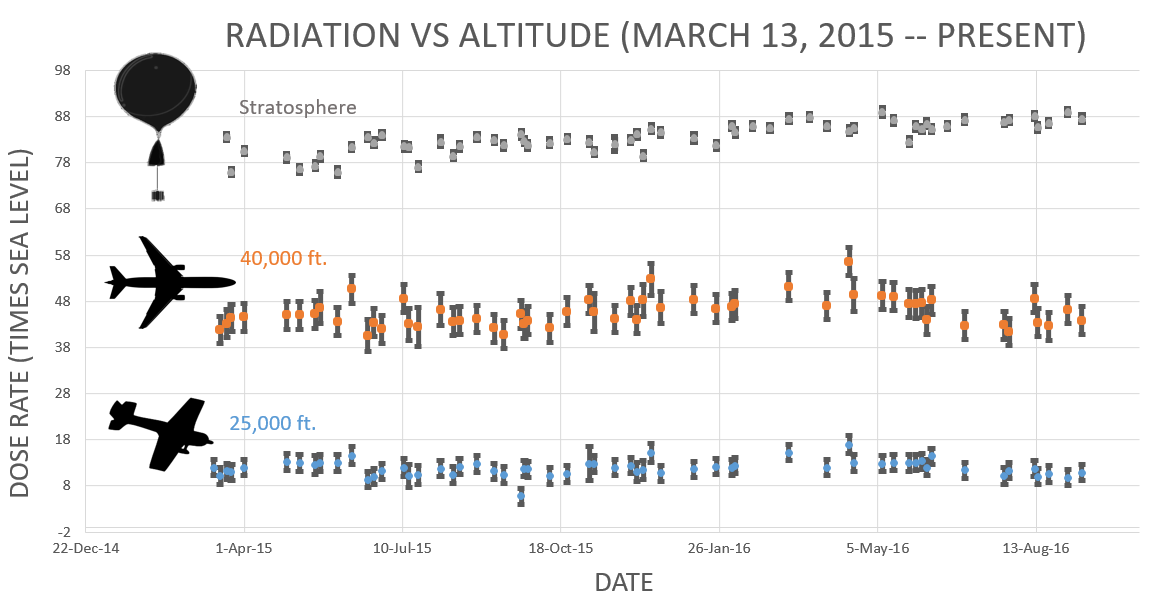
Readers, thank you for your patience while we continue to develop this new section of Spaceweather.com. We've been working to streamline our data reduction, allowing us to post results from balloon flights much more rapidly, and we have developed a new data product, shown here: 
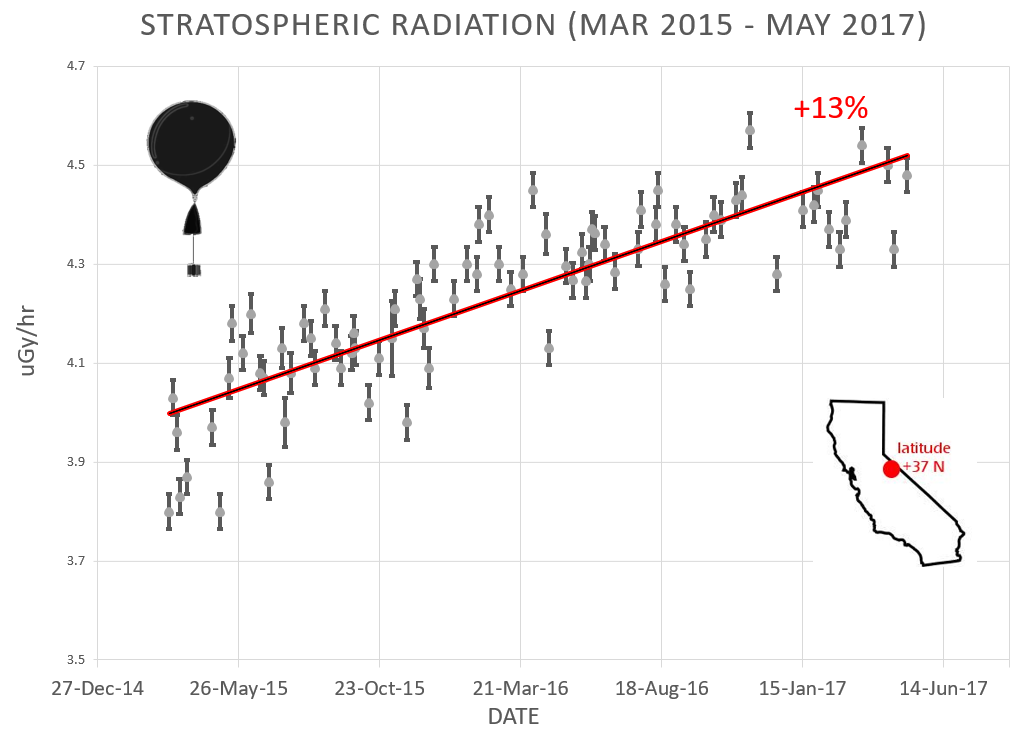
This plot displays radiation measurements not only in the stratosphere, but also at aviation altitudes. Dose rates are expessed as multiples of sea level. For instance, we see that boarding a plane that flies at 25,000 feet exposes passengers to dose rates ~10x higher than sea level. At 40,000 feet, the multiplier is closer to 50x. These measurements are made by our usual cosmic ray payload as it passes through aviation altitudes en route to the stratosphere over California. What is this all about? Approximately once a week, Spaceweather.com and the students of Earth to Sky Calculus fly space weather balloons to the stratosphere over California. These balloons are equipped with radiation sensors that detect cosmic rays, a surprisingly "down to Earth" form of space weather. Cosmic rays can seed clouds, trigger lightning, and penetrate commercial airplanes. Furthermore, there are studies ( #1, #2, #3, #4) linking cosmic rays with cardiac arrhythmias and sudden cardiac death in the general population. Our latest measurements show that cosmic rays are intensifying, with an increase of more than 13% since 2015: 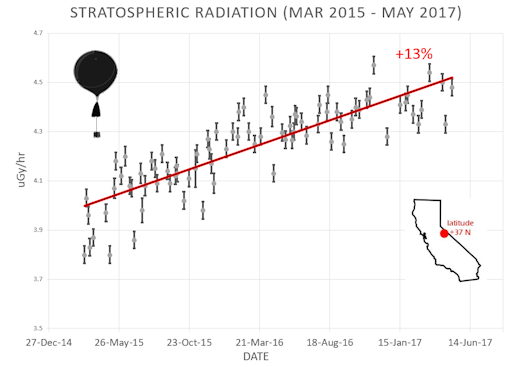
Why are cosmic rays intensifying? The main reason is the sun. Solar storm clouds such as coronal mass ejections (CMEs) sweep aside cosmic rays when they pass by Earth. During Solar Maximum, CMEs are abundant and cosmic rays are held at bay. Now, however, the solar cycle is swinging toward Solar Minimum, allowing cosmic rays to return. Another reason could be the weakening of Earth's magnetic field, which helps protect us from deep-space radiation. The radiation sensors onboard our helium balloons detect X-rays and gamma-rays in the energy range 10 keV to 20 MeV. These energies span the range of medical X-ray machines and airport security scanners. The data points in the graph above correspond to the peak of the Reneger-Pfotzer maximum, which lies about 67,000 feet above central California. When cosmic rays crash into Earth's atmosphere, they produce a spray of secondary particles that is most intense at the entrance to the stratosphere. Physicists Eric Reneger and Georg Pfotzer discovered the maximum using balloons in the 1930s and it is what we are measuring today. | | The official U.S. government space weather bureau | | | The first place to look for information about sundogs, pillars, rainbows and related phenomena. | | | Researchers call it a "Hubble for the sun." SDO is the most advanced solar observatory ever. | | | 3D views of the sun from NASA's Solar and Terrestrial Relations Observatory | | | Realtime and archival images of the Sun from SOHO. | | | from the NOAA Space Environment Center | | | fun to read, but should be taken with a grain of salt! Forecasts looking ahead more than a few days are often wrong. | | | from the NOAA Space Environment Center | | | the underlying science of space weather |  | To find reviews of new online casino sites in the UK try The Casino DB where there are hundreds of online casino reviews complete with bonuses and ratings. | | | These links help Spaceweather.com stay online. Thank you to our supporters! | | | | | | | | |  | | |  | ©2017 Spaceweather.com. All rights reserved. This site is penned daily by Dr. Tony Phillips. | |


