Solar minimum is here - but even now strangely beautiful auroras are dancing around the poles. Deep inside the Arctic Circle, the expert guides of Aurora Holidays in Utsjoki, Finland, can help you chase them. Book now! | | |
CHINA FARMS THE MOON: There a new form of life on the Moon. It's a potato. Photos released today by the China National Space Administration show that rapeseed, potato and cotton seeds are sprouting inside the Chang'e-4 lunar lander, which touched down on the Moon's farside earlier this month. This experiment in far-out farming could pave the way for future Chinese astronauts to live and work on the Moon. NASA, meanwhile, is on furlough. Free: SWx Newsletter
A COLLISION IN THE ASTEROID BELT: Last week, astronomers working with the ATLAS project in Hawaii announced an astonishing change to asteroid 6478 Gault. The space rock had sprouted a tail. It is now gliding through the asteroid belt giving every appearance of being a comet. On Jan. 9th, Damian Peach of Selsey UK photographed the 6478 Gault and its 400,000 kilometer-long tail:
"This is a 60 minute sequence of images, which I captured using a 20-inch telescope," says Peach.
What happened to 6478 Gault? A clue may be found in its lineage. Asteroid Gault is a member of the Phocaea family, a swarm of rocks in the inner asteroid belt that formed as a result of inter-asteroid collisions some 2.2 billion years ago. The family gets its name from its most massive survivor, 25 Phocaea, which is about 75 km in diameter.
Gault's tail may be a result of a recent collision. Researchers with the ATLAS project have looked at images of Gault in Dec. 2018 and Jan. 2019. Extrapolating its appearance backwards in time, they suggest that Gault hit another object in the asteroid belt in Nov. 2018. If that idea is correct, the tail would be debris from the crash.
Asteroid Gault was discovered in 1988 by the famous astronomer couple Carolyn and Eugene Shoemaker at the Palomar Observatory in California. For the next 30 years, the 4-km wide space rock did little to attract attention. Now, astronomers around the world are eagerly monitoring 6478 Gault to see what happens next. Stay tuned.
Readers, would you like to take pictures like Damian Peach? He's willing to teach you how. Subscribe to his Patreon page for expert tutorials.
Realtime Space Weather Photo Gallery
FULL MOON VALENTINE'S PENDANT: Poets, lovers, and artists have long known this simple truth: Nothing is more romantic than a full Moon. Now you can give the full Moon as a Valentine's Gift--the full Moon space pendant, that is. This one flew to the stratosphere on Dec. 26, 2018, onboard an Earth to Sky Calculus cosmic ray balloon:
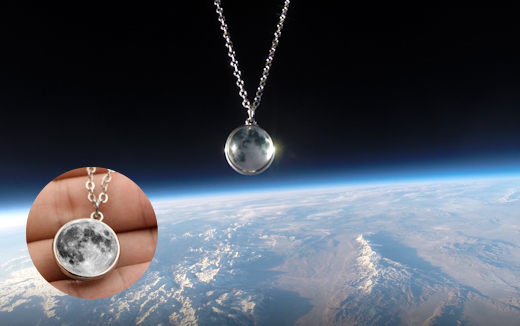
You can have it for $99.95. The students are selling these spherical glass pendants to support their cosmic ray ballooning program. Each one comes with a Valentine's card showing the pendant in flight and telling the story of its journey to the edge of space and back again.
Far Out Gifts: Earth to Sky Store
All sales support hands-on STEM education
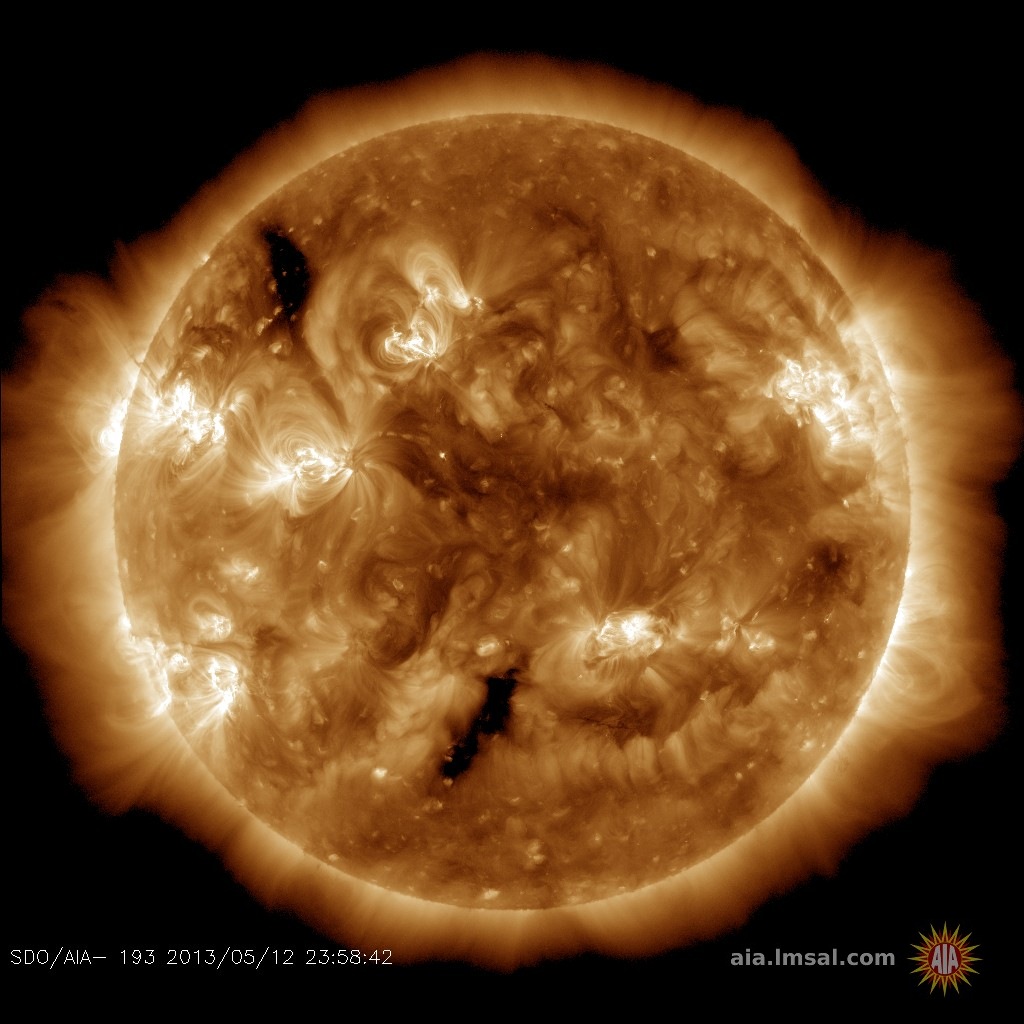
THE COLOR OF SOLAR MINIMUM: The sun has been blank for 8 straight days--a sign that Solar Minimum is in progress. Another sign of Solar Minimum: strangely pink auroras. "The Spaceweather.com team has warned us to be alert for pink auroras during Solar Minimum, and here they are," reports Markus Varik, who took this picture last night in Tromsø, Norway:
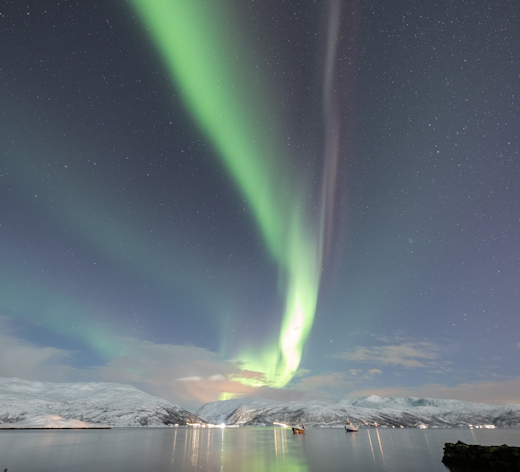
"During our nights out shooting auroras, we have been getting more pinks than usual," says Varik, an experienced tour guide. "The pink colors often appear in linear bands similar to STEVE."
Does the palette of auroras really change during Solar Minimum? The evidence is anecdotal, but the idea is not far-fetched. During Solar Minimum, unusually long-lasting holes open in the sun's atmosphere, spewing streams of solar wind that lash Earth repeatedly month after month. Perhaps the chemical mix, magnetic structure, and repetition of these streams produces colors less often seen in other phases of the solar cycle. Aurora alerts: SMS Text
Realtime Aurora Photo Gallery
Every night, a network of
NASA all-sky cameras scans the skies above the United States for meteoritic fireballs. Automated software maintained by NASA's Meteoroid Environment Office calculates their orbits, velocity, penetration depth in Earth's atmosphere and many other characteristics. Daily results are presented here on Spaceweather.com.
On Jan. 15, 2019, the network reported 18 fireballs.
(18 sporadics)
In this diagram of the inner solar system, all of the fireball orbits intersect at a single point--Earth. The orbits are color-coded by velocity, from slow (red) to fast (blue). [Larger image] [movies]
Potentially Hazardous Asteroids (
PHAs) are space rocks larger than approximately 100m that can come closer to Earth than 0.05 AU. None of the known PHAs is on a collision course with our planet, although astronomers are finding
new ones all the time.
On January 15, 2019 there were 1947 potentially hazardous asteroids.
 |
Recent & Upcoming Earth-asteroid encounters: | Asteroid | Date(UT) | Miss Distance | Velocity (km/s) | Diameter (m) |
| 2019 AX5 | 2019-Jan-09 | 9.5 LD | 10.3 | 23 |
| 2018 YQ2 | 2019-Jan-10 | 7.5 LD | 5.7 | 21 |
| 2013 YM2 | 2019-Jan-10 | 7.8 LD | 4.3 | 23 |
| 2019 AD | 2019-Jan-10 | 3 LD | 5.6 | 11 |
| 2019 AW7 | 2019-Jan-10 | 11.6 LD | 21.4 | 131 |
| 2018 YU2 | 2019-Jan-12 | 5.6 LD | 4.6 | 19 |
| 2019 AE9 | 2019-Jan-12 | 0.3 LD | 19.2 | 13 |
| 2019 AX2 | 2019-Jan-12 | 17.6 LD | 22.1 | 43 |
| 2019 AK3 | 2019-Jan-12 | 4.9 LD | 10.7 | 14 |
| 2019 AC9 | 2019-Jan-12 | 4.1 LD | 10.1 | 26 |
| 2019 AR2 | 2019-Jan-13 | 7.6 LD | 4.8 | 49 |
| 2019 AG3 | 2019-Jan-14 | 12.9 LD | 14.6 | 85 |
| 2019 AS6 | 2019-Jan-14 | 12.1 LD | 7.2 | 20 |
| 2019 AU6 | 2019-Jan-14 | 2.6 LD | 8.9 | 17 |
| 2018 XN | 2019-Jan-14 | 11.9 LD | 5.6 | 59 |
| 2019 AT6 | 2019-Jan-15 | 8.1 LD | 5.1 | 10 |
| 2019 AM8 | 2019-Jan-15 | 8.6 LD | 10.9 | 15 |
| 2019 AG7 | 2019-Jan-15 | 3.9 LD | 6.8 | 30 |
| 2019 AU9 | 2019-Jan-16 | 7.7 LD | 5.1 | 15 |
| 2019 AM10 | 2019-Jan-16 | 17.5 LD | 3.6 | 36 |
| 2019 AR8 | 2019-Jan-16 | 9.7 LD | 8.9 | 27 |
| 2019 AC3 | 2019-Jan-17 | 10.7 LD | 4.4 | 12 |
| 2019 AB5 | 2019-Jan-19 | 7.5 LD | 6.6 | 28 |
| 2019 AZ8 | 2019-Jan-20 | 13.7 LD | 10 | 24 |
| 2019 AO8 | 2019-Jan-20 | 10.4 LD | 11.3 | 26 |
| 2019 AX8 | 2019-Jan-22 | 18.1 LD | 16.2 | 38 |
| 2019 AA10 | 2019-Jan-26 | 5.6 LD | 9.8 | 28 |
| 2013 CW32 | 2019-Jan-29 | 13.9 LD | 16.4 | 148 |
| 2019 AV2 | 2019-Feb-01 | 17.6 LD | 13 | 204 |
| 2013 RV9 | 2019-Feb-06 | 17.9 LD | 5.9 | 68 |
| 2017 PV25 | 2019-Feb-12 | 7.3 LD | 6.1 | 43 |
| 455176 | 2019-Feb-20 | 19.2 LD | 26.5 | 269 |
| 2016 CO246 | 2019-Feb-22 | 15.8 LD | 5.5 | 23 |
| 2018 DE1 | 2019-Feb-27 | 19.8 LD | 6.5 | 28 |
| 2016 FU12 | 2019-Feb-27 | 15.4 LD | 5.2 | 15 |
| 2015 EG | 2019-Mar-04 | 1.2 LD | 9.6 | 26 |
| 2013 EG68 | 2019-Mar-13 | 19.3 LD | 17 | 37 |
| 2012 VZ19 | 2019-Mar-13 | 7.7 LD | 8 | 27 |
Notes: LD means "Lunar Distance." 1 LD = 384,401 km, the distance between Earth and the Moon. 1 LD also equals 0.00256 AU. MAG is the visual magnitude of the asteroid on the date of closest approach. | | Cosmic Rays in the Atmosphere |
SOMETHING NEW! We have developed a new predictive model of aviation radiation. It's called E-RAD--short for Empirical RADiation model. We are constantly flying radiation sensors onboard airplanes over the US and and around the world, so far collecting more than 22,000 gps-tagged radiation measurements. Using this unique dataset, we can predict the dosage on any flight over the USA with an error no worse than 15%.
E-RAD lets us do something new: Every day we monitor approximately 1400 flights criss-crossing the 10 busiest routes in the continental USA. Typically, this includes more than 80,000 passengers per day. E-RAD calculates the radiation exposure for every single flight.
The Hot Flights Table is a daily summary of these calculations. It shows the 5 charter flights with the highest dose rates; the 5 commercial flights with the highest dose rates; 5 commercial flights with near-average dose rates; and the 5 commercial flights with the lowest dose rates. Passengers typically experience dose rates that are 20 to 70 times higher than natural radiation at sea level.
To measure radiation on airplanes, we use the same sensors we fly to the stratosphere onboard Earth to Sky Calculus cosmic ray balloons: neutron bubble chambers and X-ray/gamma-ray Geiger tubes sensitive to energies between 10 keV and 20 MeV. These energies span the range of medical X-ray machines and airport security scanners.
Column definitions: (1) The flight number; (2) The maximum dose rate during the flight, expressed in units of natural radiation at sea level; (3) The maximum altitude of the plane in feet above sea level; (4) Departure city; (5) Arrival city; (6) Duration of the flight.
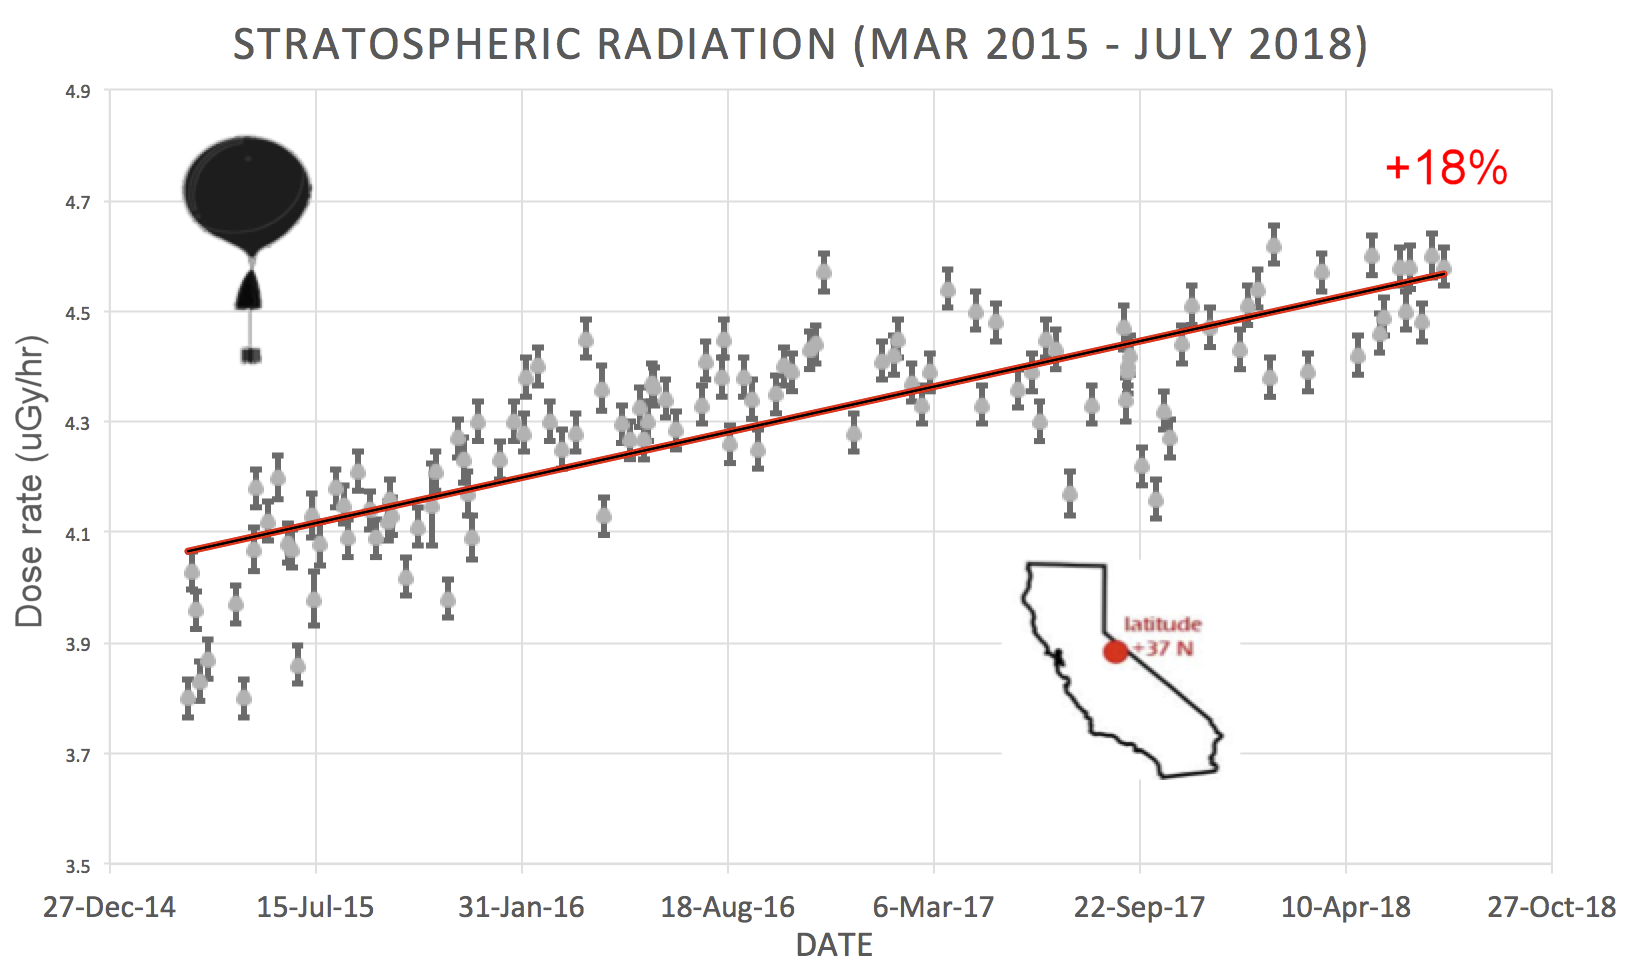
SPACE WEATHER BALLOON DATA: Approximately once a week, Spaceweather.com and the students of Earth to Sky Calculus fly space weather balloons to the stratosphere over California. These balloons are equipped with radiation sensors that detect cosmic rays, a surprisingly "down to Earth" form of space weather. Cosmic rays can seed clouds, trigger lightning, and penetrate commercial airplanes. Furthermore, there are studies ( #1, #2, #3, #4) linking cosmic rays with cardiac arrhythmias and sudden cardiac death in the general population. Our latest measurements show that cosmic rays are intensifying, with an increase of more than 18% since 2015:

The data points in the graph above correspond to the peak of the Reneger-Pfotzer maximum, which lies about 67,000 feet above central California. When cosmic rays crash into Earth's atmosphere, they produce a spray of secondary particles that is most intense at the entrance to the stratosphere. Physicists Eric Reneger and Georg Pfotzer discovered the maximum using balloons in the 1930s and it is what we are measuring today.
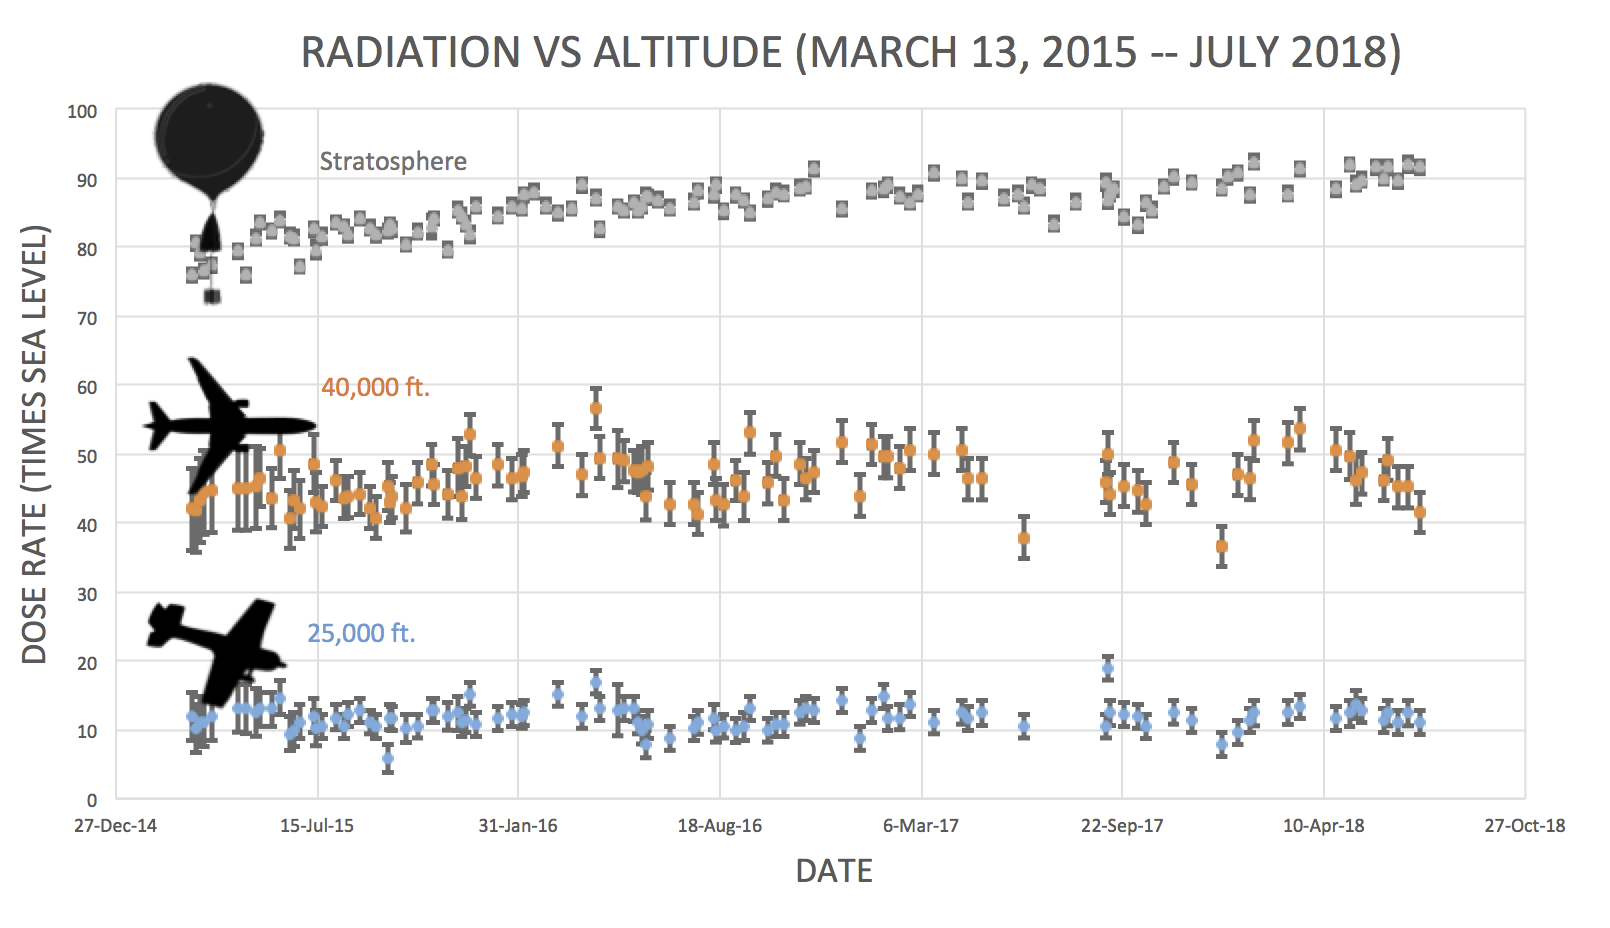
En route to the stratosphere, our sensors also pass through aviation altitudes:

In this plot, dose rates are expessed as multiples of sea level. For instance, we see that boarding a plane that flies at 25,000 feet exposes passengers to dose rates ~10x higher than sea level. At 40,000 feet, the multiplier is closer to 50x.
The radiation sensors onboard our helium balloons detect X-rays and gamma-rays in the energy range 10 keV to 20 MeV. These energies span the range of medical X-ray machines and airport security scanners.
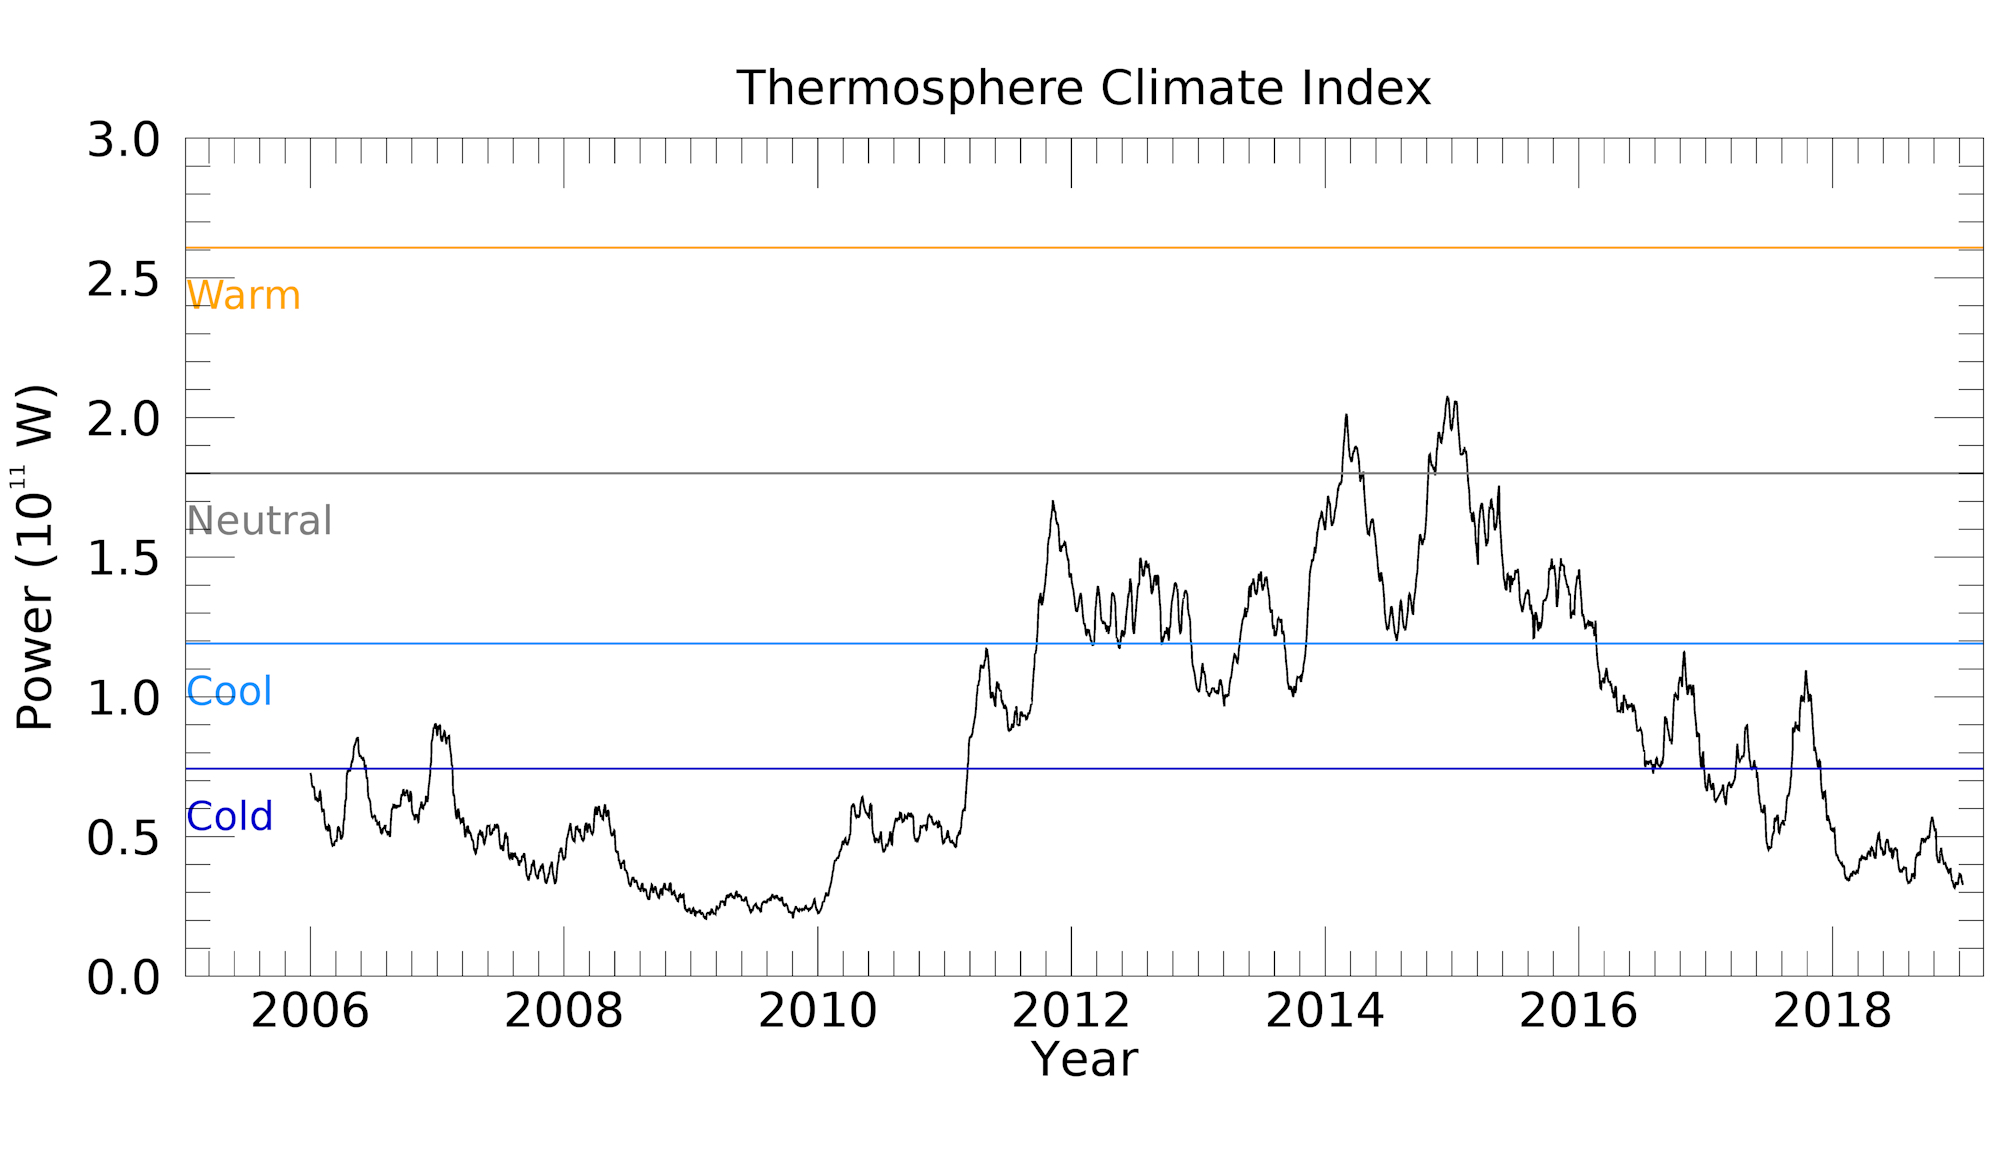
Why are cosmic rays intensifying? The main reason is the sun. Solar storm clouds such as coronal mass ejections (CMEs) sweep aside cosmic rays when they pass by Earth. During Solar Maximum, CMEs are abundant and cosmic rays are held at bay. Now, however, the solar cycle is swinging toward Solar Minimum, allowing cosmic rays to return. Another reason could be the weakening of Earth's magnetic field, which helps protect us from deep-space radiation.
| | The official U.S. government space weather bureau |
| | The first place to look for information about sundogs, pillars, rainbows and related phenomena. |
| | Researchers call it a "Hubble for the sun." SDO is the most advanced solar observatory ever. |
| | 3D views of the sun from NASA's Solar and Terrestrial Relations Observatory |
| | Realtime and archival images of the Sun from SOHO. |
| | from the NOAA Space Environment Center |
| | fun to read, but should be taken with a grain of salt! Forecasts looking ahead more than a few days are often wrong. |
| | from the NOAA Space Environment Center |
| | the underlying science of space weather |
 | If you are a Youtuber and want to buy real Youtube views than try out Buyrealsocial.com for the best results possible! |
| To find reviews of new online casino sites in the UK try The Casino DB where there are hundreds of online casino reviews complete with bonuses and ratings. Looking for a new online casino? Try Casimpo the new site dedicated to making online casino simple and easy for all. |
| | These links help Spaceweather.com stay online. Thank you to our supporters! |
| | | | | | |


