Spotless Days Current Stretch: 5 days 2018 total: 46 days (55%) 2017 total: 104 days (28%) 2016 total: 32 days (9%) 2015 total: 0 days (0%) 2014 total: 1 day (<1%) 2013 total: 0 days (0%) 2012 total: 0 days (0%) 2011 total: 2 days (<1%) 2010 total: 51 days (14%) 2009 total: 260 days (71%) Updated 24 Mar 2018
Planetary K-index Now: Kp= 2 quiet 24-hr max: Kp= 2 quiet explanation | more data
Interplanetary Mag. Field Btotal: 4.5 nT Bz: -0.1 nT south more data: ACE, DSCOVR Updated: Today at 2355 UT
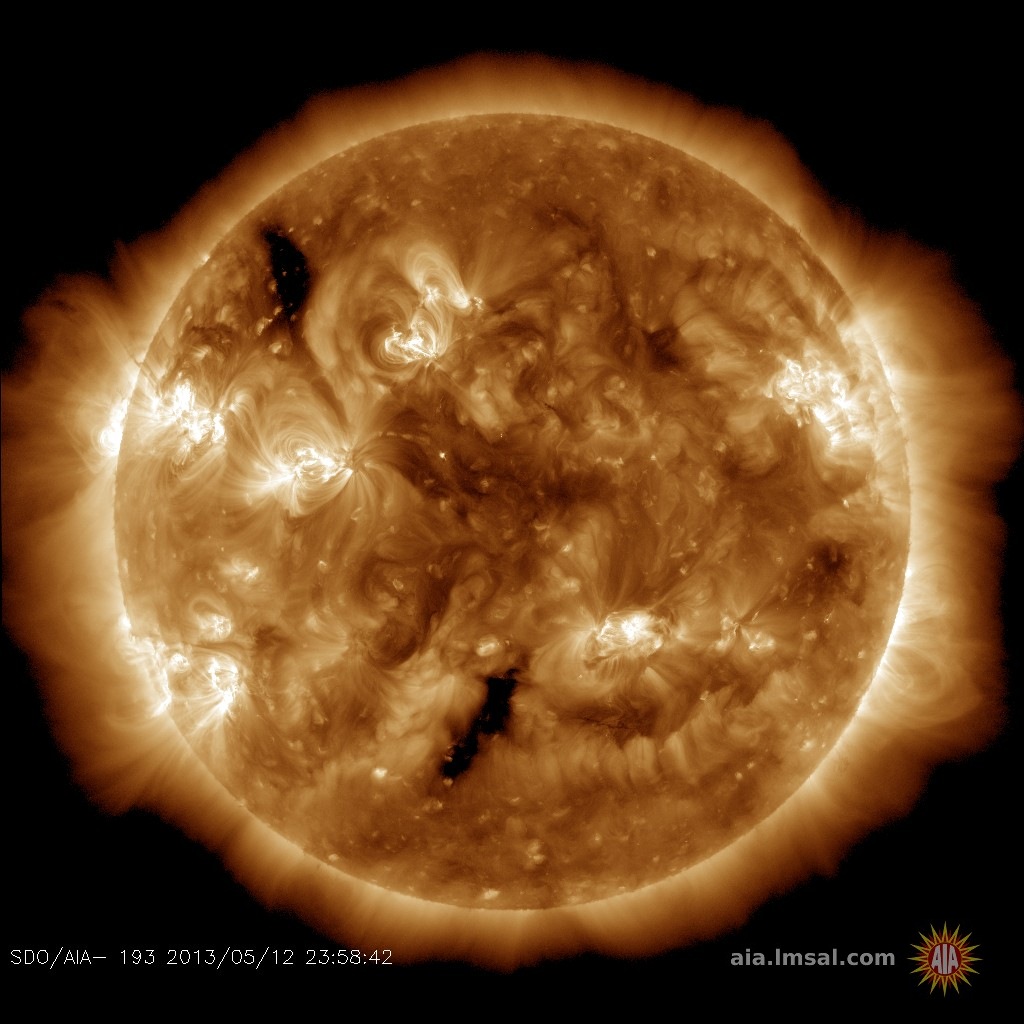
Coronal Holes: 24 Mar 18
Earth is entering a stream of solar wind flowing from the indicated coronal hole. Credit: SDO/AIA
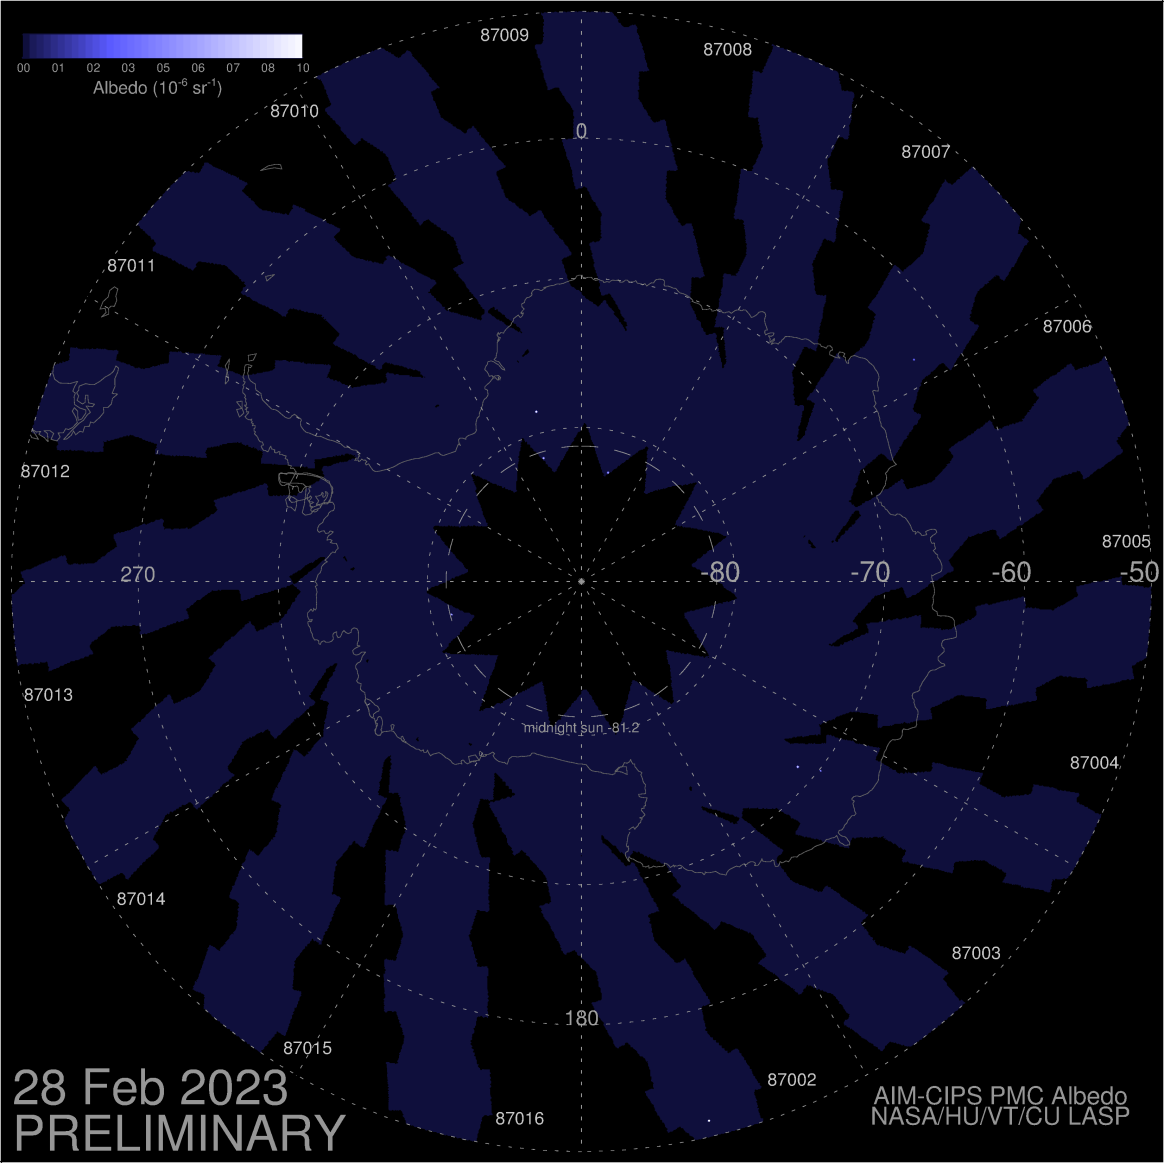
Noctilucent CloudsOur connection with NASA's AIM spacecraft has been restored! New images from AIM show that the southern season for noctilucent clouds (NLCs) is underway. Come back to this spot every day to see AIM's "daily daisy," which reveals the dance of electric-blue NLCs around the Antarctic Circle..
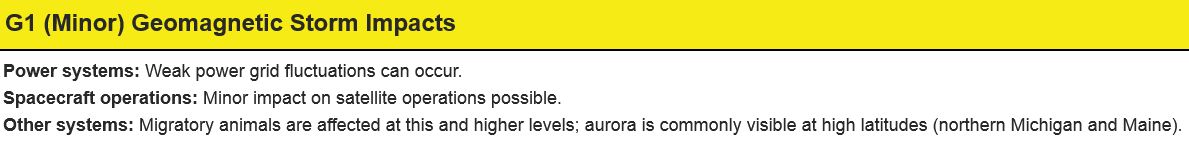
Geomagnetic Storms: Probabilities for significant disturbances in Earth's magnetic field are given for three activity levels: active, minor storm, severe storm
Updated at: 2018 Mar 24 2200 UTC
Mid-latitudes
0-24 hr
24-48 hr
ACTIVE
35 %
35 %
MINOR
25 %
15 %
SEVERE
05 %
05 %
High latitudes
0-24 hr
24-48 hr
ACTIVE
10 %
15 %
MINOR
25 %
30 %
SEVERE
55 %
45 %
Saturday, Mar. 24, 2018
What's up in space
All-inclusive Northern Lights trips in Tromsø, Norway. Small groups, big experiences! Highly qualified guides ensure unique and unforgettable adventures with a personal touch. Visit Explore the Arctic
CO-ROTATING INTERACTION REGION: NOAA forecasters estimate a 55% chance of G1-class geomagnetic storms today, March 24th, when a co-rotating interaction region (CIR) is expected to hit Earth's magnetic field. CIRs are transition zones between slow- and fast-moving solar wind. Solar wind plasma piles up in these regions, producing density gradients and shock waves that do a good job of sparking auroras. Free:Aurora Alerts
AURORAS CAUSE BURNT PIZZA: Did you know that auroras can burn your pizza? It happened last night in Abisko, Sweden. Photographer Oliver Wright was cooking his dinner when the skies above his cabin erupted in colorful lights. He rushed outside with a video camera to record the display:
"The auroras were insane," he says. "Massive coronas (auroras 'raining' down from directly overhead) were dancing across the sky. I couldn't tear my eyes away and, as a result, I managed to burn the pizza in my oven."
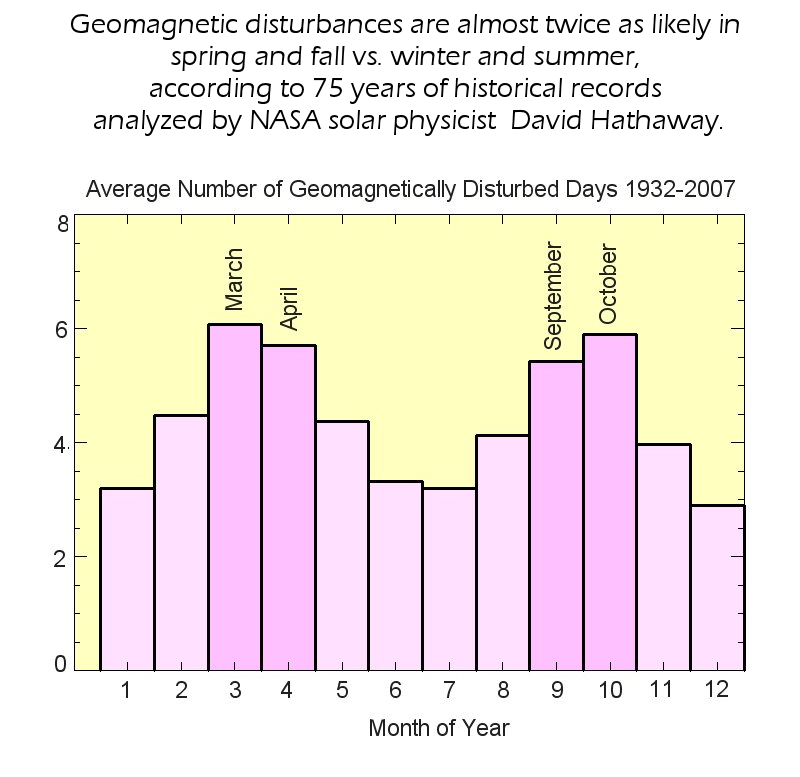
As a longtime guide for Lights over Lapland, Wright is a veteran observer of auroras. "After you have been guiding for a few years, you begin to notice a few patterns," he says. "One of those patterns is the intensification of auroras in March. Every year within days of the March equinox, the auroras seem to go crazy. All it takes is a little bit of solar wind."
This pattern of March auroras is caused by cracks that open in Earth's magnetic field around the time of the vernal equinox--a phenomenon known as the "Russell-McPherron effect." Solar wind pours in through the openings to spark bright Northern Lights. The same thing happens in Sept.-Oct. during the autumnal equinox. Strange but true: Arctic pizzas suffer at both times of year. Free:Aurora Alerts
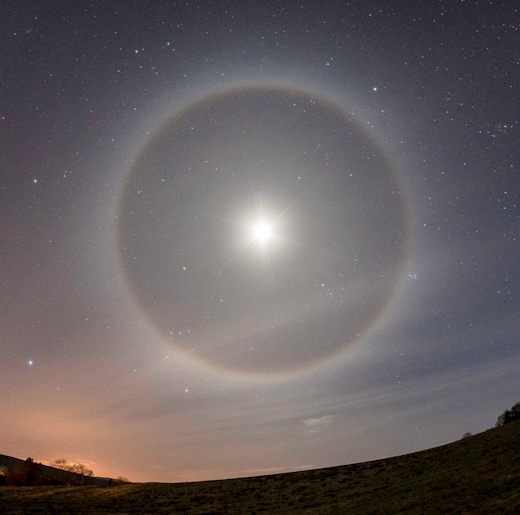
HALF MOON HALO: This weekend, the Moon is only half full. Nevertheless, it's a good time to watch for lunar halos. "I saw one last night," reports Noel Keating, who sends this picture from Ballintra, Co Donegal , Ireland:
"What a vivid halo!" says Keating. "With only a half Moon, I was able to see stars shining brightly inside the ring. They were not washed out by lunar glare. I was really surprised that the halo itself was so intense, as this is the type of halo you normally get only with a full Moon."
Moon halos are created by ice crystals in high clouds, which catch rays of moonlight and bend them into a 22o ring. Bright full Moons are great at making these halos, but as Keating has shown, a full Moon is not required. Half is plenty.
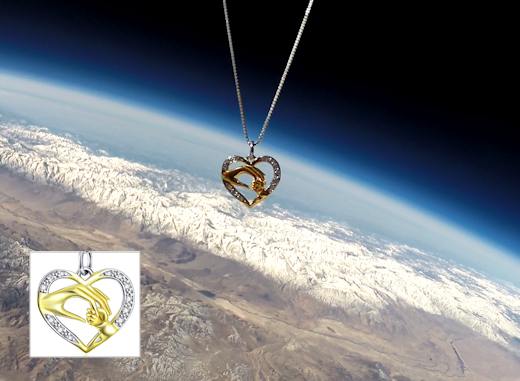
OUT OF THIS WORLD GIFT: It's sterling silver and it comes from space. On March 5, 2018, the students of Earth to Sky Calculus flew a cosmic ray balloon to the stratosphere, more than 94,000 feet above Earth's surface. This "Loving Hands" pendant went along for the ride:
You can have one for $119.95. The students are selling these pendants as a fund-raiser for their cosmic ray monitoring program. All proceeds support atmospheric radiation measurements and hands-on STEM education.
Each pendant comes with a greeting card showing the jewelry in flight and telling the story of its journey to the stratosphere and back again. They make great Mother's Day gifts.
Every night, a network of NASA all-sky cameras scans the skies above the United States for meteoritic fireballs. Automated software maintained by NASA's Meteoroid Environment Office calculates their orbits, velocity, penetration depth in Earth's atmosphere and many other characteristics. Daily results are presented here on Spaceweather.com.
On Mar. 24, 2018, the network reported 6 fireballs. (6 sporadics)
In this diagram of the inner solar system, all of the fireball orbits intersect at a single point--Earth. The orbits are color-coded by velocity, from slow (red) to fast (blue). [Larger image] [movies]
Near Earth Asteroids
Potentially Hazardous Asteroids (PHAs) are space rocks larger than approximately 100m that can come closer to Earth than 0.05 AU. None of the known PHAs is on a collision course with our planet, although astronomers are finding new ones all the time.
On March 24, 2018 there were 1882 potentially hazardous asteroids.
Notes: LD means "Lunar Distance." 1 LD = 384,401 km, the distance between Earth and the Moon. 1 LD also equals 0.00256 AU. MAG is the visual magnitude of the asteroid on the date of closest approach.
Cosmic Rays in the Atmosphere
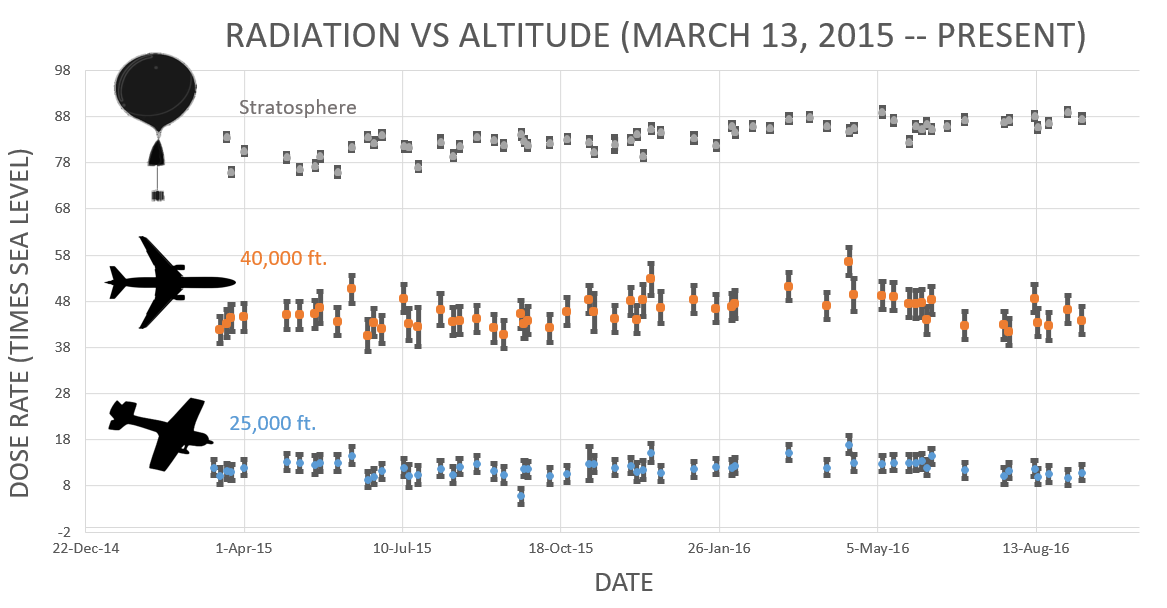
Readers, thank you for your patience while we continue to develop this new section of Spaceweather.com. We've been working to streamline our data reduction, allowing us to post results from balloon flights much more rapidly, and we have developed a new data product, shown here:
This plot displays radiation measurements not only in the stratosphere, but also at aviation altitudes. Dose rates are expessed as multiples of sea level. For instance, we see that boarding a plane that flies at 25,000 feet exposes passengers to dose rates ~10x higher than sea level. At 40,000 feet, the multiplier is closer to 50x. These measurements are made by our usual cosmic ray payload as it passes through aviation altitudes en route to the stratosphere over California.
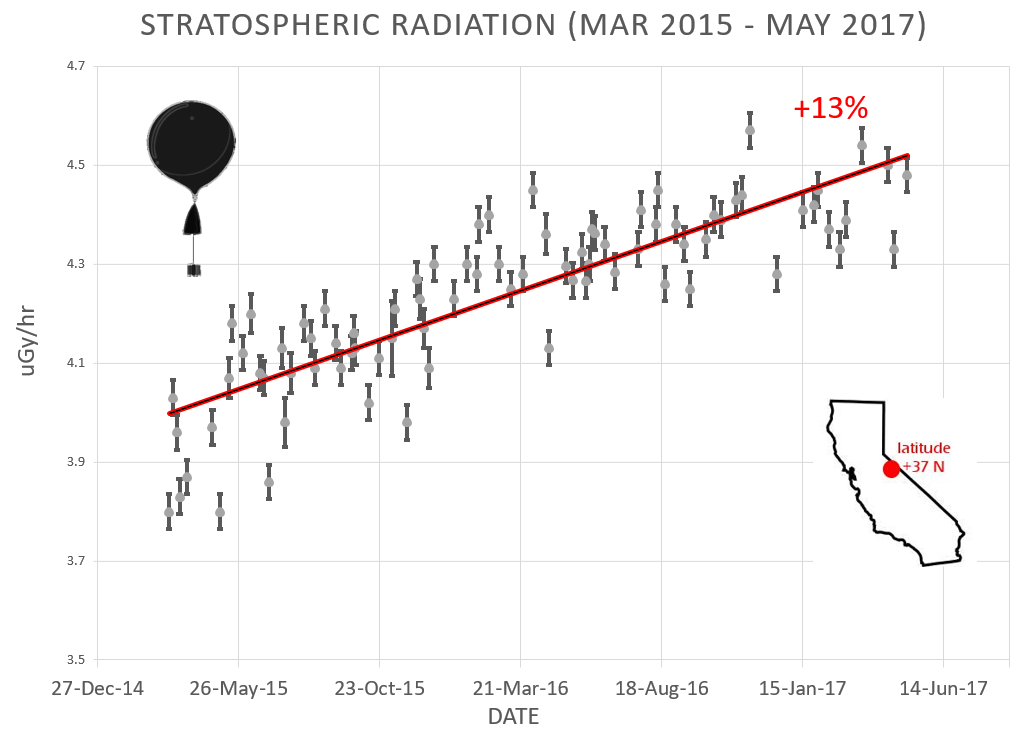
What is this all about? Approximately once a week, Spaceweather.com and the students of Earth to Sky Calculus fly space weather balloons to the stratosphere over California. These balloons are equipped with radiation sensors that detect cosmic rays, a surprisingly "down to Earth" form of space weather. Cosmic rays can seed clouds, trigger lightning, and penetrate commercial airplanes. Furthermore, there are studies ( #1, #2, #3, #4) linking cosmic rays with cardiac arrhythmias and sudden cardiac death in the general population. Our latest measurements show that cosmic rays are intensifying, with an increase of more than 13% since 2015:
Why are cosmic rays intensifying? The main reason is the sun. Solar storm clouds such as coronal mass ejections (CMEs) sweep aside cosmic rays when they pass by Earth. During Solar Maximum, CMEs are abundant and cosmic rays are held at bay. Now, however, the solar cycle is swinging toward Solar Minimum, allowing cosmic rays to return. Another reason could be the weakening of Earth's magnetic field, which helps protect us from deep-space radiation.
The radiation sensors onboard our helium balloons detect X-rays and gamma-rays in the energy range 10 keV to 20 MeV. These energies span the range of medical X-ray machines and airport security scanners.
The data points in the graph above correspond to the peak of the Reneger-Pfotzer maximum, which lies about 67,000 feet above central California. When cosmic rays crash into Earth's atmosphere, they produce a spray of secondary particles that is most intense at the entrance to the stratosphere. Physicists Eric Reneger and Georg Pfotzer discovered the maximum using balloons in the 1930s and it is what we are measuring today.


