This is an AI Free Zone: Text created by Large Language Models is spreading across the Internet. It's well-written, but frequently inaccurate. If you find a mistake on Spaceweather.com, rest assured it was made by a real human being.
|
|
|
AURORAS SURROUND COMET LEMMON--AGAIN: Comet Lemmon's close approach to Earth on Oct. 21st coincided with the onset of autumnal aurora season. The resulting photo-ops have been superb. Here's the comet surrounded by red oxygen auroras over Germany, and purple nitrogen auroras over Alaska. Photographers, submit your images here.
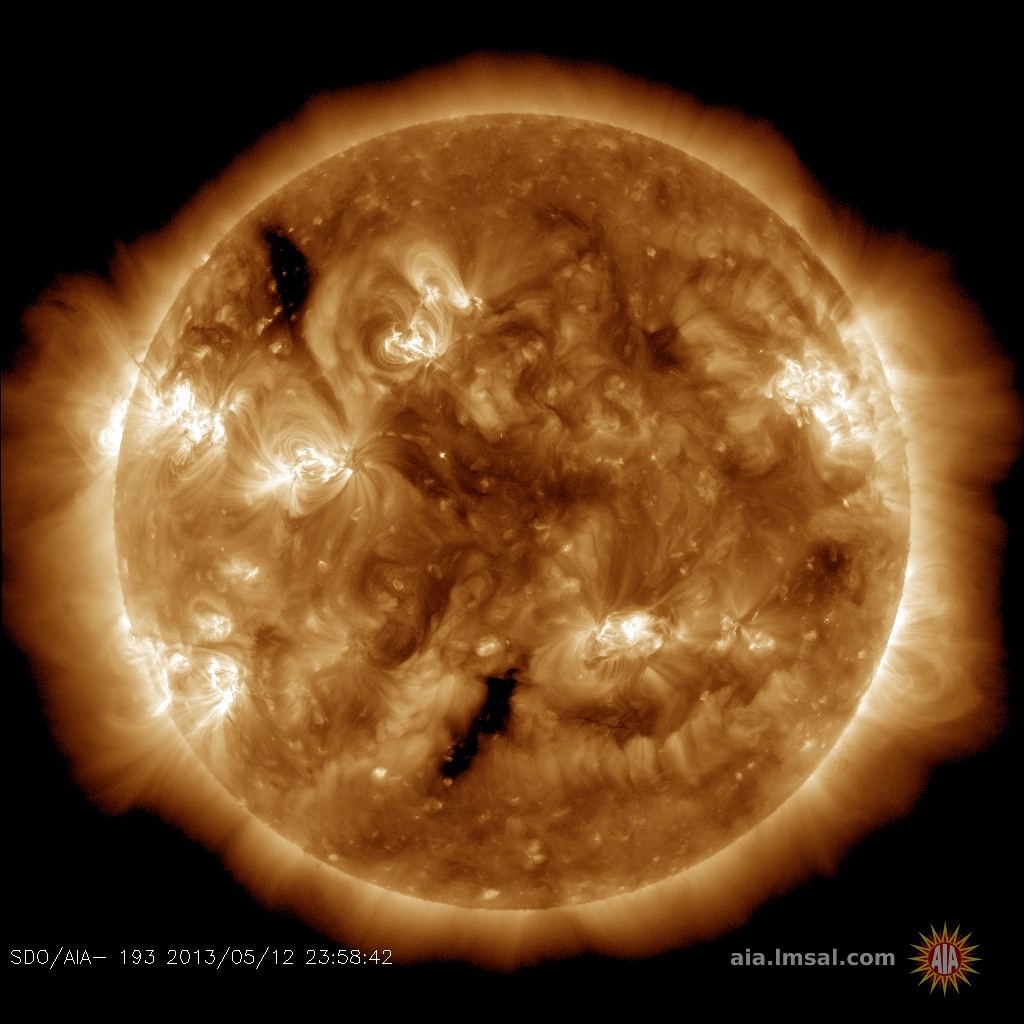
MAJOR FARSIDE EXPLOSION: Something exploded on the farside of the sun yesterday (late on Oct. 21st). The blast produced an exceptionally fast and potent CME, shown here in an animation from the Solar and Heliospheric Observatory (SOHO):
The USAF reported Type II radio emissions from this CME with high-velocity drift rates: 2474 km/s--a sign of fast-moving shocks inside the CME. Only a handful of CMEs in the Space Age have moved significantly faster, such as the great CME of Aug. 1972 (2850 km/s) and a CME propelled by an X8 flare in Sept. 2017 (2600–3300 km/s).
If the CME hit Earth, we would almost certainly experience a strong geomagnetic storm. Instead, it is going to hit Venus (as early as Oct. 23rd according to this NASA model). Venus does not have an internally generated global magnetic field to protect it, so the impact will erode some gas from the planet's cloudtops. Venus's crushingly-thick atmosphere won't notice.
The source of this explosion approximately matches the location of old sunspot 4246, currently transiting the farside of the sun. Only a week ago, that dangerous sunspot was facing Earth. ==> We have dodged a bullet. Solar flare alerts: SMS Text.
Realtime Space Weather Photo Gallery
Free: Spaceweather.com Newsletter
MILKY WAY IN A CRYSTAL BALL: Are you looking for a big gift? How about the entire Milky Way? The students of Earth to Sky Calculus have launched our own galaxy to the stratosphere onboard a cosmic ray research balloon. Here it is 113,517 feet above the Sierra Nevada mountains of central California:
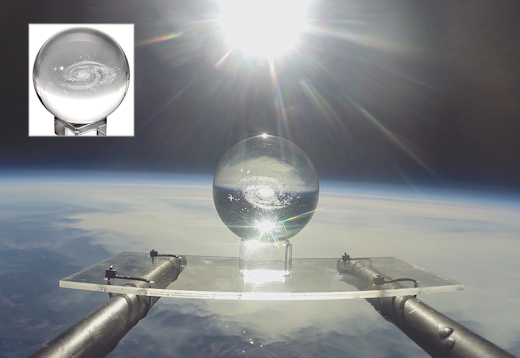
You can have it for $119.95. The galaxy is laser etched inside a 60 mm crystal sphere. You can turn it in your hands, inspecting the spiral star system from any angle. The gift-boxed sphere comes with a greeting card showing the item in flight and telling the story of its journey to the edge of space.
Far Out Gifts: Earth to Sky Store
All sales support hands-on STEM education
EARTH'S ELECTRICAL RINGS JUST SPRUNG A LEAK: This story shows how little we know. On Oct. 18th, a routine G2-class geomagnetic storm broke out when a CME passed close to Earth. What happened next was not routine. An extremely bright SAR arc cut across the night sky, stretching from the USA to Europe.
"My son and I were surprised by this red bow in the south," reports P-M Hedén, who photographed the display from Norrtälje, Sweden. It was so bright, he even captured its reflection in a local pond:
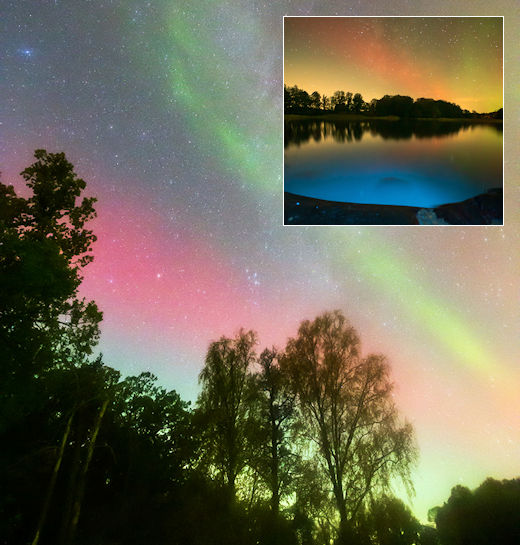
"Only a few times in a solar cycle do we get an SAR arc this bright," says Jeff Baumgardner, who has been studying the phenomenon for decades at Boston University's Center for Space Physics. "It nearly saturated our detectors."
SAR arcs appear when Earth’s ring current system springs a leak. Yes, Earth has rings. They are made of electricity, a donut-shaped circuit carrying millions of amps around our planet. The ring system is created by opposing motions of electrons and ions in Earth’s rotating magnetic field.
During strong geomagnetic storms, thermal energy from the ring current can leak into the atmosphere below, creating red lights in the sky. The ring-shaped arcs were discovered in 1956 at the dawn of the Space Age. At first, researchers didn’t know what they were and gave them a misleading name: "Stable Auroral Red arcs," or SAR arcs for short. However, they are not auroras.
This super SAR arc appeared over Maine on Oct. 18th
The storm on Oct. 18th was not strong. Nevertheless, it created one of the biggest and brightest SAR arcs in years. Some sky watchers could see it even though the human eye is famously insensitive to the arc's pure red color (630.0 nm).
Baumgardner doesn’t know why the arc was so bright. He says it was 10 to 30 times brighter than a G2 storm would typically produce. "We need to gather more information."
Meanwhile, sky watchers should remain alert for SAR arcs. Apparently, we don’t know when a bright one will appear.
more images: from Bengt Flodqvist of southern Öland, Sweden; from Carla Sanders of Searsport, Maine; from Janne-Kalle Räsänen of southern Finland; from Laura Kranich near Berlin, Germany
Realtime Space Weather Photo Gallery
Free: Spaceweather.com Newsletter
Realtime Aurora Photo Gallery
Free: Spaceweather.com Newsletter
Every night, a network
of
NASA
all-sky cameras scans the skies above the United
States for meteoritic fireballs. Automated software
maintained by NASA's Meteoroid Environment Office
calculates their orbits, velocity, penetration depth
in Earth's atmosphere and many other characteristics.
Daily results are presented here on Spaceweather.com.
On Oct 20, 2025, the network reported 27 fireballs.
(19 sporadics, 3 Orionids, 3 Leonis Minorids, 1 epsilon Geminid, 1 Southern Taurid)

In this diagram of the inner solar system, all of the fireball orbits intersect at a single point--Earth. The orbits are color-coded by velocity, from slow (red) to fast (blue).
[Larger image] [movies]
Potentially Hazardous Asteroids (
PHAs)
are space rocks larger than approximately 100m that
can come closer to Earth than 0.05 AU. None of the
known PHAs is on a collision course with our planet,
although astronomers are finding
new
ones all the time.
On October 23, 2025 there were 2349 potentially hazardous asteroids.
 |
Recent
& Upcoming Earth-asteroid encounters:
| Asteroid |
Date(UT) |
Miss Distance |
Velocity (km/s) |
Diameter (m) |
| 2025 TR2 |
2025-Oct-17 |
12.8 LD |
16.3 |
58 |
| 2025 UE4 |
2025-Oct-17 |
13.6 LD |
16.6 |
26 |
| 2025 UZ1 |
2025-Oct-17 |
3.7 LD |
9.6 |
12 |
| 2025 UD |
2025-Oct-17 |
5.7 LD |
14.6 |
38 |
| 2025 UT |
2025-Oct-17 |
1.7 LD |
10.5 |
13 |
| 2025 UY2 |
2025-Oct-17 |
1.6 LD |
14.1 |
10 |
| 2025 UQ |
2025-Oct-17 |
3.3 LD |
7.2 |
6 |
| 2025 UB1 |
2025-Oct-17 |
3.3 LD |
7.2 |
6 |
| 2025 UH1 |
2025-Oct-18 |
3.8 LD |
10.3 |
6 |
| 2025 UH3 |
2025-Oct-18 |
5.7 LD |
9.2 |
10 |
| 2025 UM1 |
2025-Oct-18 |
0.3 LD |
14.4 |
4 |
| 2025 UW |
2025-Oct-18 |
8.4 LD |
8.2 |
14 |
| 2022 UU15 |
2025-Oct-19 |
14.8 LD |
16.1 |
34 |
| 2025 UL |
2025-Oct-19 |
10.9 LD |
11.9 |
23 |
| 2025 TT10 |
2025-Oct-19 |
1.2 LD |
22.8 |
16 |
| 2025 UO2 |
2025-Oct-19 |
19.3 LD |
8.3 |
22 |
| 2025 UE |
2025-Oct-19 |
13.9 LD |
7.8 |
32 |
| 2025 UW3 |
2025-Oct-20 |
3.8 LD |
8.4 |
8 |
| 2025 TV10 |
2025-Oct-20 |
7.8 LD |
7.2 |
35 |
| 2025 UB2 |
2025-Oct-20 |
19.7 LD |
17 |
50 |
| 2025 TJ11 |
2025-Oct-20 |
7.2 LD |
13.1 |
25 |
| 2025 UR |
2025-Oct-21 |
3.7 LD |
11.6 |
20 |
| 2025 SD7 |
2025-Oct-21 |
9.9 LD |
12.5 |
55 |
| 2025 TQ10 |
2025-Oct-21 |
9.3 LD |
7.4 |
44 |
| 2023 UK3 |
2025-Oct-21 |
6.7 LD |
9 |
5 |
| 2025 UN1 |
2025-Oct-21 |
16.2 LD |
12.6 |
30 |
| 2025 UX |
2025-Oct-21 |
11.9 LD |
6.5 |
21 |
| 2025 TU4 |
2025-Oct-21 |
15.4 LD |
7.7 |
17 |
| 2025 TU10 |
2025-Oct-21 |
15.9 LD |
7.3 |
25 |
| 2025 UJ1 |
2025-Oct-22 |
2.5 LD |
15.3 |
11 |
| 2025 UC2 |
2025-Oct-22 |
0.9 LD |
10.6 |
9 |
| 2025 UB |
2025-Oct-22 |
3.2 LD |
5.4 |
12 |
| 2024 GD2 |
2025-Oct-22 |
17.8 LD |
4.2 |
28 |
| 2025 UV1 |
2025-Oct-22 |
5.5 LD |
11.7 |
21 |
| 2025 UA2 |
2025-Oct-22 |
4.6 LD |
11.3 |
13 |
| 2025 UK2 |
2025-Oct-22 |
13.7 LD |
7.2 |
30 |
| 2025 UE1 |
2025-Oct-22 |
0.7 LD |
15.3 |
17 |
| 2025 TG11 |
2025-Oct-22 |
10.4 LD |
10.8 |
19 |
| 2025 UP1 |
2025-Oct-23 |
18.4 LD |
6.8 |
12 |
| 2022 HM1 |
2025-Oct-23 |
15.1 LD |
13.3 |
27 |
| 2025 UR3 |
2025-Oct-23 |
1.3 LD |
9.9 |
8 |
| 2025 UE2 |
2025-Oct-23 |
5.9 LD |
9.2 |
11 |
| 2025 UD2 |
2025-Oct-23 |
2.1 LD |
9.6 |
16 |
| 2025 UL1 |
2025-Oct-24 |
9.1 LD |
14.1 |
30 |
| 2025 TX2 |
2025-Oct-24 |
6.3 LD |
6.8 |
26 |
| 2012 TP231 |
2025-Oct-25 |
15.2 LD |
6.7 |
37 |
| 2025 UX1 |
2025-Oct-25 |
3.7 LD |
14.5 |
10 |
| 2025 UP2 |
2025-Oct-25 |
5.2 LD |
3.1 |
6 |
| 2025 UD3 |
2025-Oct-25 |
1.9 LD |
6.3 |
6 |
| 2025 UU |
2025-Oct-25 |
5 LD |
12.6 |
29 |
| 2020 FA5 |
2025-Oct-26 |
15.7 LD |
26.5 |
210 |
| 2025 UU1 |
2025-Oct-26 |
16.1 LD |
13.2 |
26 |
| 2025 UV2 |
2025-Oct-26 |
14.6 LD |
7.7 |
12 |
| 2009 HC |
2025-Oct-26 |
8.6 LD |
4.2 |
39 |
| 2025 UJ2 |
2025-Oct-26 |
18.9 LD |
14.5 |
48 |
| 2025 UF3 |
2025-Oct-27 |
6.2 LD |
3.2 |
14 |
| 434196 |
2025-Oct-27 |
17.4 LD |
10.9 |
171 |
| 2025 UQ1 |
2025-Oct-28 |
10.4 LD |
5.8 |
10 |
| 2025 UH2 |
2025-Oct-29 |
19.3 LD |
8.9 |
29 |
| 2025 UL2 |
2025-Oct-29 |
3.9 LD |
12.4 |
21 |
| 2025 TP11 |
2025-Nov-02 |
12 LD |
8.4 |
35 |
| 2005 EZ223 |
2025-Nov-03 |
15.6 LD |
12.9 |
118 |
| 2023 VK6 |
2025-Nov-03 |
7.6 LD |
9.6 |
15 |
| 2025 TB12 |
2025-Nov-04 |
7.3 LD |
6.3 |
22 |
| 2021 VQ10 |
2025-Nov-08 |
9 LD |
15 |
13 |
| 2019 UH7 |
2025-Nov-08 |
13.3 LD |
5.8 |
11 |
| 2018 KC |
2025-Nov-09 |
16 LD |
9.3 |
11 |
| 2017 WG14 |
2025-Nov-09 |
16.7 LD |
11.7 |
45 |
| 2020 VK4 |
2025-Nov-10 |
16.4 LD |
3.8 |
9 |
| 2012 VC26 |
2025-Nov-11 |
13.3 LD |
6.4 |
6 |
| 2019 VL5 |
2025-Nov-14 |
14.7 LD |
9.1 |
24 |
| 2022 FG4 |
2025-Nov-17 |
18.7 LD |
22.2 |
105 |
| 3361 |
2025-Nov-19 |
14.8 LD |
9.1 |
435 |
| 2013 NJ4 |
2025-Nov-20 |
12.6 LD |
6.4 |
12 |
| 2021 WR |
2025-Nov-22 |
19.3 LD |
10 |
31 |
| 516155 |
2025-Nov-24 |
12.5 LD |
16.7 |
338 |
| 2020 WM |
2025-Nov-24 |
17.4 LD |
11.8 |
36 |
| 2019 UT6 |
2025-Nov-25 |
6.2 LD |
12.6 |
147 |
| 2018 WG2 |
2025-Nov-27 |
13.5 LD |
7.5 |
3 |
| 2007 VM184 |
2025-Dec-01 |
13.1 LD |
20 |
224 |
| 2018 WC2 |
2025-Dec-03 |
9.8 LD |
8.9 |
36 |
| 2021 JE1 |
2025-Dec-08 |
13.5 LD |
7.1 |
16 |
| 2019 XN3 |
2025-Dec-10 |
5.7 LD |
3.6 |
15 |
| 1999 SF10 |
2025-Dec-10 |
8.2 LD |
4.4 |
46 |
| 2016 YH |
2025-Dec-13 |
6.8 LD |
8.9 |
28 |
| 2025 TZ |
2025-Dec-16 |
19.1 LD |
6.1 |
48 |
| 2015 XX168 |
2025-Dec-18 |
4.7 LD |
11.6 |
27 |
| 2010 WR7 |
2025-Dec-20 |
19.5 LD |
8.3 |
71 |
Notes: LD means
"Lunar Distance." 1 LD = 384,401 km, the distance
between Earth and the Moon. 1 LD also equals 0.00256
AU.
| |
Cosmic Rays in the Atmosphere |
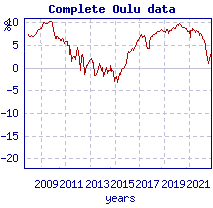
SPACE WEATHER BALLOON DATA: Almost once a week, Spaceweather.com and the students of Earth to Sky Calculus fly space weather balloons to the stratosphere over California. These balloons are equipped with sensors that detect secondary cosmic rays, a form of radiation from space that can penetrate all the way down to Earth's surface. Our monitoring program has been underway without interruption for 10 years, resulting in a unique dataset of in situ atmospheric measurements.
Latest results (Nov. 2024): Atmospheric radiation is sharply decreasing in 2024. Our latest measurements in November registered a 10-year low:
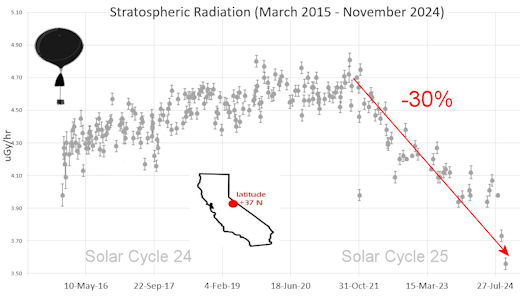
What's going on? Ironically, the radiation drop is caused by increasing solar activity. Solar Cycle 25 has roared to life faster than forecasters expected. The sun's strengthening and increasingly tangled magnetic field repels cosmic rays from deep space. In addition, solar coronal mass ejections (CMEs) sweep aside cosmic rays, causing sharp reductions called "Forbush Decreases." The two effects blend together to bring daily radiation levels down.
.Who cares? Cosmic rays are a surprisingly "down to Earth" form of space weather. They can alter the chemistry of the atmosphere, trigger lightning, and penetrate commercial airplanes. According to a study from the Harvard T.H. Chan school of public health, crews of aircraft have higher rates of cancer than the general population. The researchers listed cosmic rays, irregular sleep habits, and chemical contaminants as leading risk factors. A number of controversial studies (#1, #2, #3, #4) go even further, linking cosmic rays with cardiac arrhythmias and sudden cardiac death.
Technical notes: The radiation sensors onboard our helium balloons detect X-rays and gamma-rays in the energy range 10 keV to 20 MeV. These energies span the range of medical X-ray machines and airport security scanners.
Data points in the graph labeled "Stratospheric Radiation" correspond to the peak of the Regener-Pfotzer maximum, which lies about 67,000 feet above central California. When cosmic rays crash into Earth's atmosphere, they produce a spray of secondary particles that is most intense at the entrance to the stratosphere. Physicists Eric Regener and Georg Pfotzer discovered the maximum using balloons in the 1930s and it is what we are measuring today.
| |
The
official U.S. government space weather bureau |
| |
The
first place to look for information about sundogs,
pillars, rainbows and related phenomena. |
| |
Researchers
call it a "Hubble for the sun." SDO
is the most advanced solar observatory ever. |
| |
3D
views of the sun from NASA's Solar and Terrestrial
Relations Observatory |
| |
Realtime
and archival images of the Sun from SOHO. |
| |
information about sunspots based on the latest NOAA/USAF Active Region Summary |
| |
current counts of failed and deployed Starlink satellites from Jonathan's Space Page. See also, all satellite statistics. |
| |
Authoritative predictions of space junk and satellite re-entries |
| |
from
the NOAA Space Environment Center |
| |
fun to read, but should be taken with a grain of salt! Forecasts looking ahead more than a few days are often wrong. |
| |
from the NOAA Space Environment Center |
| |
the
underlying science of space weather |
 |
Got a chipped or cracked windshield that prevents you from seeing space weather events while driving? Get windshield replacement from SR Windows & Glass with free mobile auto glass service anywhere in the Phoenix area. |
| |
These links help Spaceweather.com stay online. Thank you to our supporters! |
|
|
| |
|
|
|


