 | | | Switch to: Europe, USA, New Zealand, Antarctica Credit: NOAA/Ovation  Planetary K-index Planetary K-index
Now: Kp= 0 quiet
24-hr max: Kp= 2 quiet
explanation | more data
Interplanetary Mag. Field
Btotal: 2.6 nT
Bz: 1.6 nT north
more data: ACE, DSCOVR
Updated: Today at 2345 UT Coronal Holes: 07 Jul 20 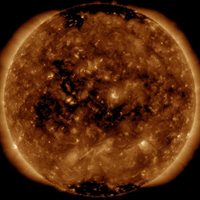
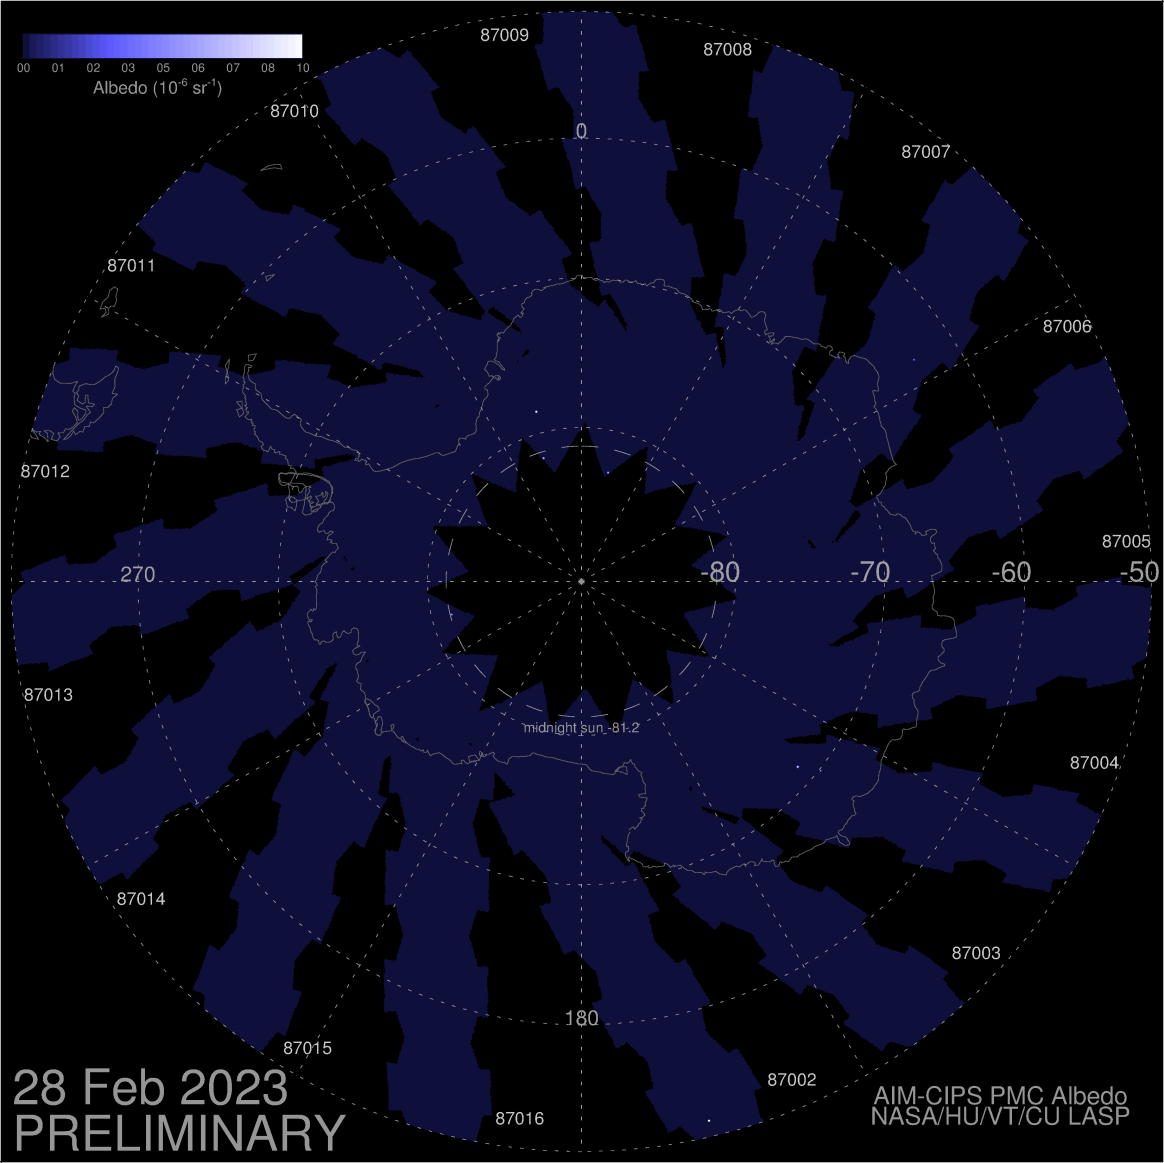
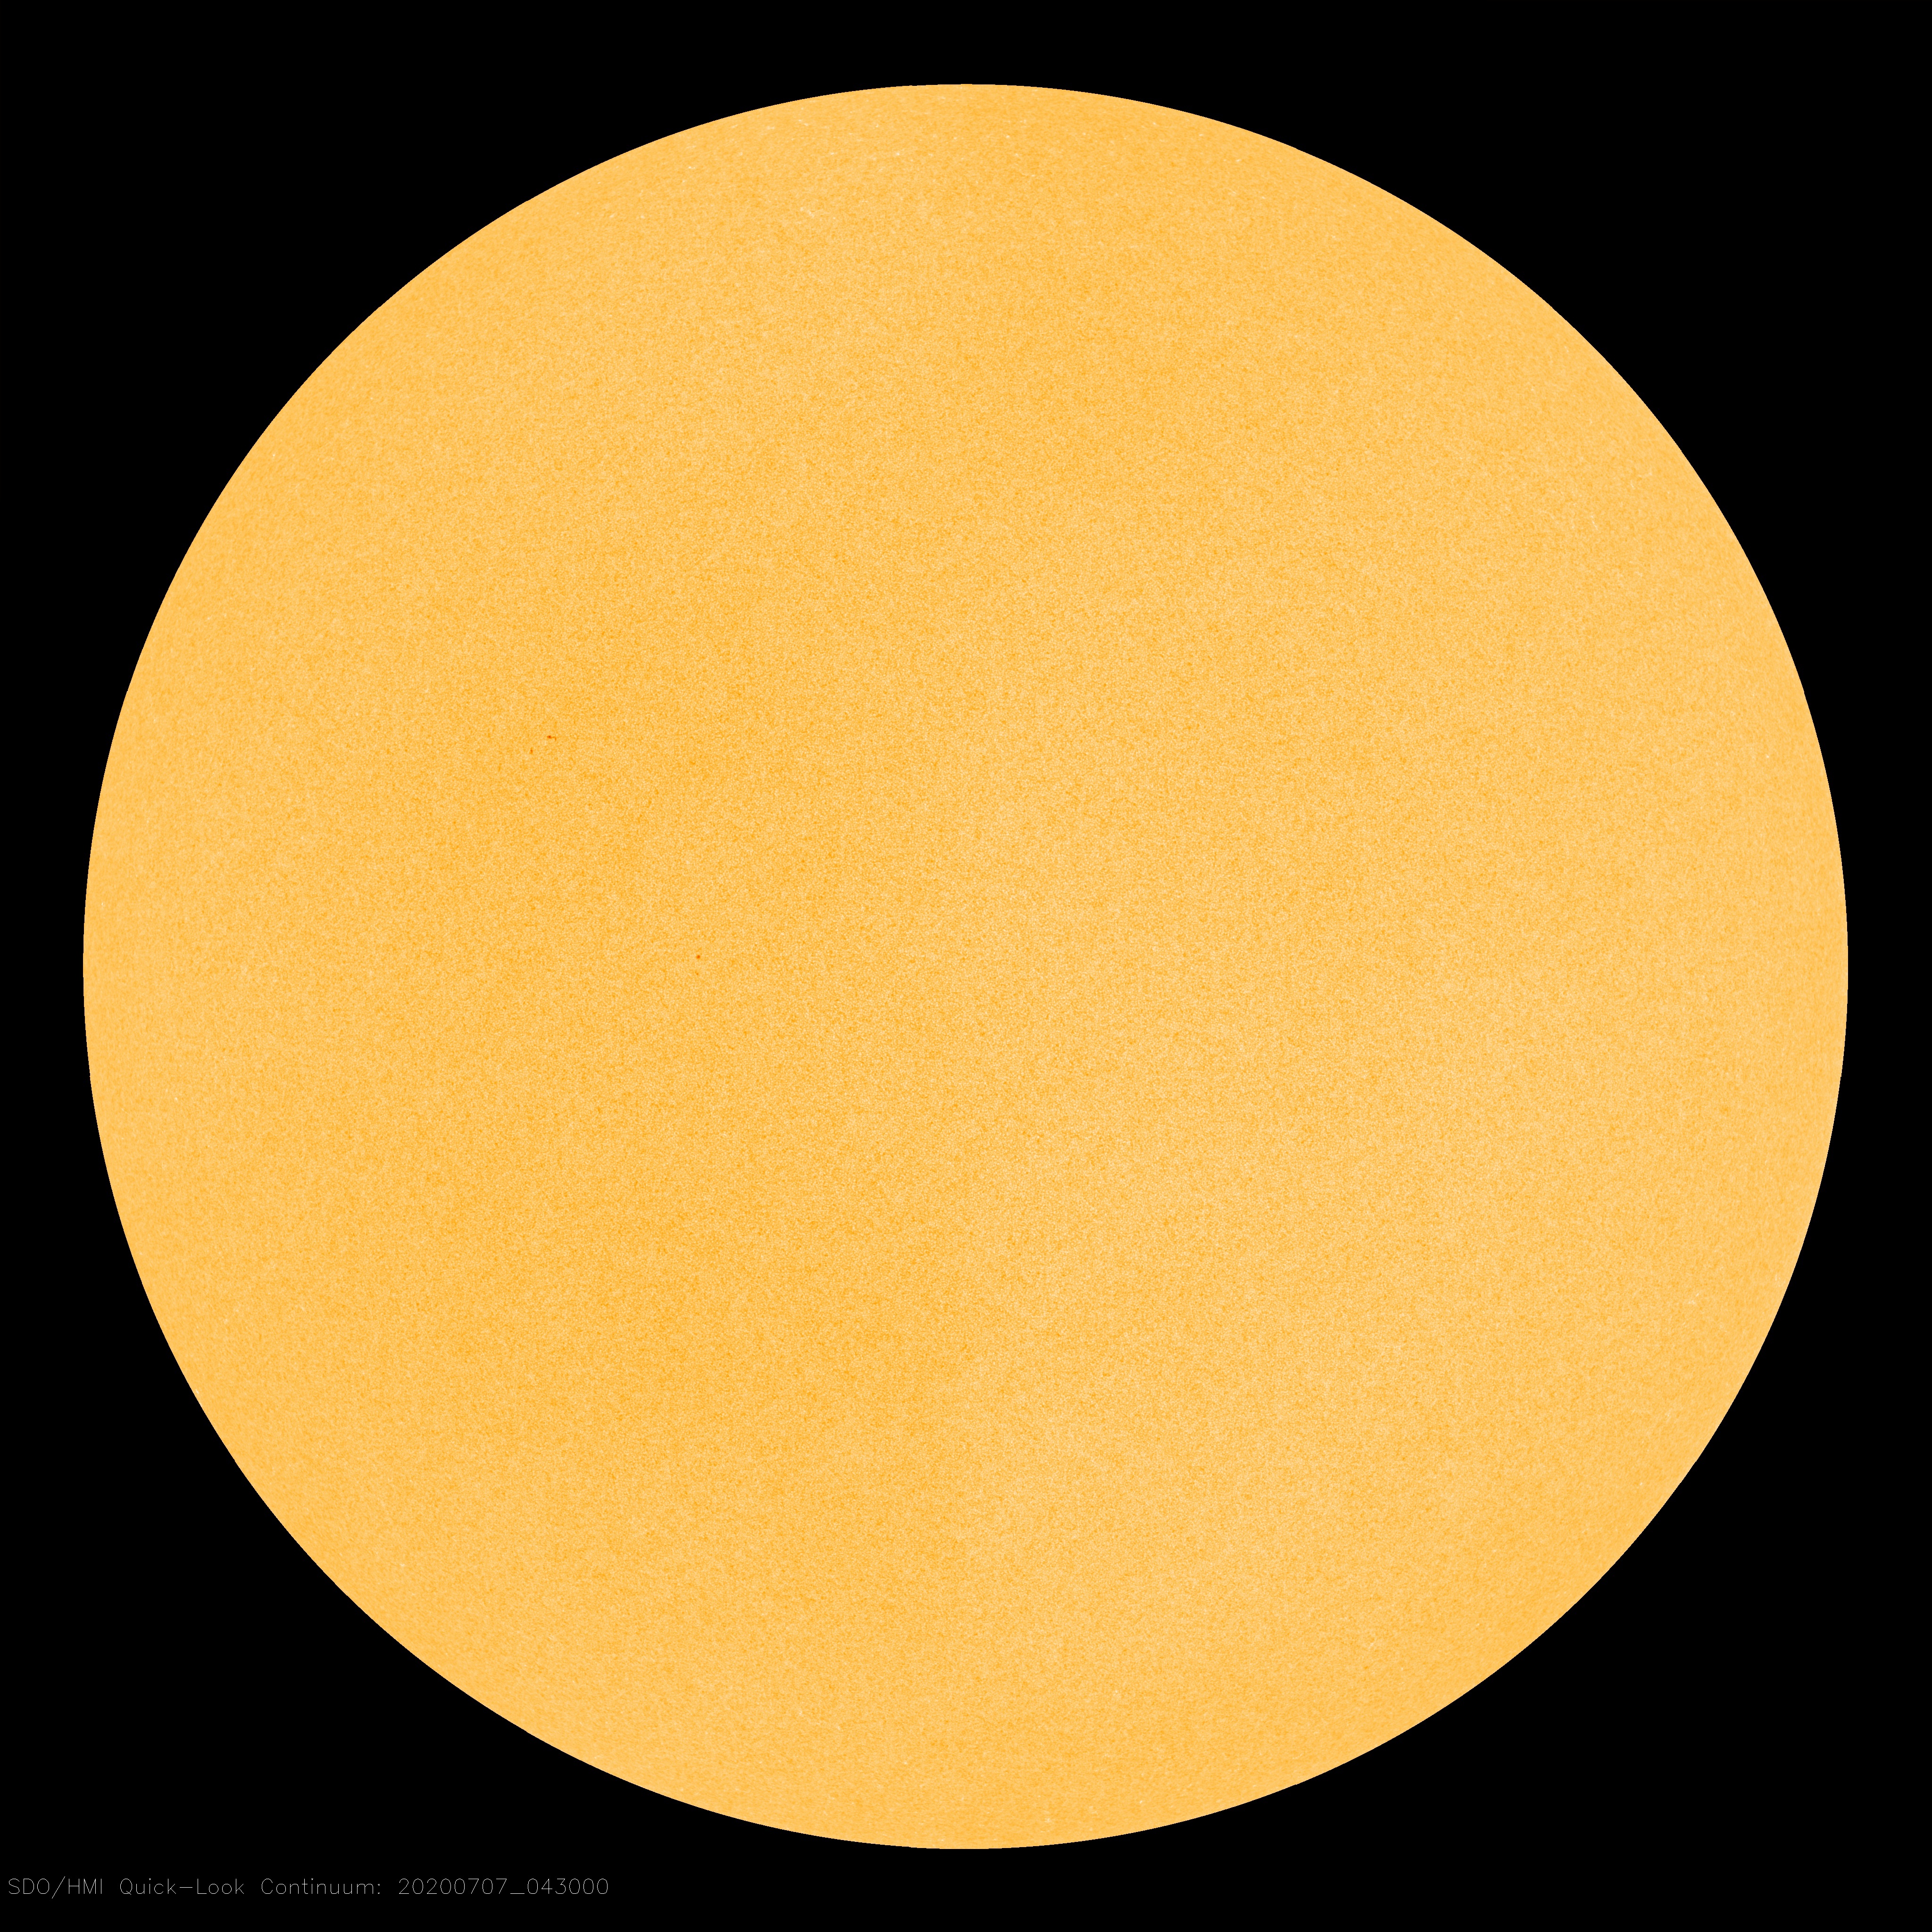
There are no significant coronal holes on the Earthside of the sun. Credit: SDO/AIA  Noctilucent Clouds NLC season is underway. NASA's AIM spacecraft detected a blue cloud over the north pole on May 17th--one of the earliest starts in the spacecraft's 14 year history. Check here for daily images from AIM. Switch view: Europe, USA, Asia, Polar Updated at: Noctilucent Clouds NLC season is underway. NASA's AIM spacecraft detected a blue cloud over the north pole on May 17th--one of the earliest starts in the spacecraft's 14 year history. Check here for daily images from AIM. Switch view: Europe, USA, Asia, Polar Updated at: SPACE WEATHER
NOAA Forecasts | | Updated at: 2020 Jul 07 2200 UTC FLARE | 0-24 hr | 24-48 hr | CLASS M | 01 % | 01 % | CLASS X | 01 % | 01 % | Geomagnetic Storms:
Probabilities for significant disturbances in Earth's magnetic field are given for three activity levels: active, minor storm, severe storm Updated at: 2020 Jul 07 2200 UTC Mid-latitudes | 0-24 hr | 24-48 hr | ACTIVE | 20 % | 20 % | MINOR | 05 % | 05 % | SEVERE | 01 % | 01 % | High latitudes | 0-24 hr | 24-48 hr | ACTIVE | 15 % | 15 % | MINOR | 25 % | 25 % | SEVERE | 25 % | 25 % | | | |  | | | | | | | | | | | Never miss another geomagnetic storm. Sign up for Space Weather Alerts and you'll receive a text message when auroras appear in your area. Aurora tour guides and professional astronomers use this service. Now you can, too! | | | NEW CYCLE PROTO-SUNSPOT (UPDATE): That didn't last long. A new-cycle sunspot in the sun's northern hemisphere (right here) is decaying only hours after it appeared. This is typical of sunspots during Solar Minimum. They tend to be short-lived with many, like this one, not persisting long enough to receive an official number. Aurora alerts: SMS Text. COMET NEOWISE MEETS A NOCTILUCENT CLOUD: When European astronomers woke up Monday morning to photograph Comet NEOWISE (C/2020 F3), they saw something they didn't expect. The sunrise comet was surrounded by noctilucent clouds. Robert Barsa video-recorded the encounter from Lubietova, Slovakia: 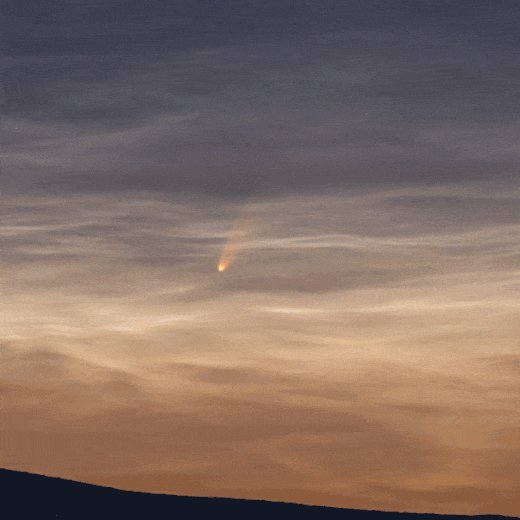
Talk about perfect timing. Barsa chose to photograph Comet NEOWISE during a major outbreak of noctilucent clouds. "The comet was drowning in them," says Barsa. "I could easily see the comet with my naked eye as it rose over Dumbier Peak in the Low Tatras Mountains. It was stunning." The silvery ripples in Barsa's video are tendrils of frosted meteor smoke. Many of the meteoroids that seed noctilucent clouds come from comets. Barsa captured both phenomena in a single, very rare timelapse. (Remarkably, Michael Jaeger recorded a similar video from Jauerling, Austria, on the same morning.) Realtime Noctilucent Cloud Photo Gallery
Free: Spaceweather.com Newsletter THE TAIL OF COMET NEOWISE: "Today (July 7) is my 4th day of observing and photographing Comet NEOWISE (C/2020 F3)," reports Fred Espenak of Portal, Arizona. "In spite of the thin haze along the horizon, the comet shown though and displayed a dust tail stretching 3 degrees in 7x40 binoculars." He took this picture from a neighbor's ranch: 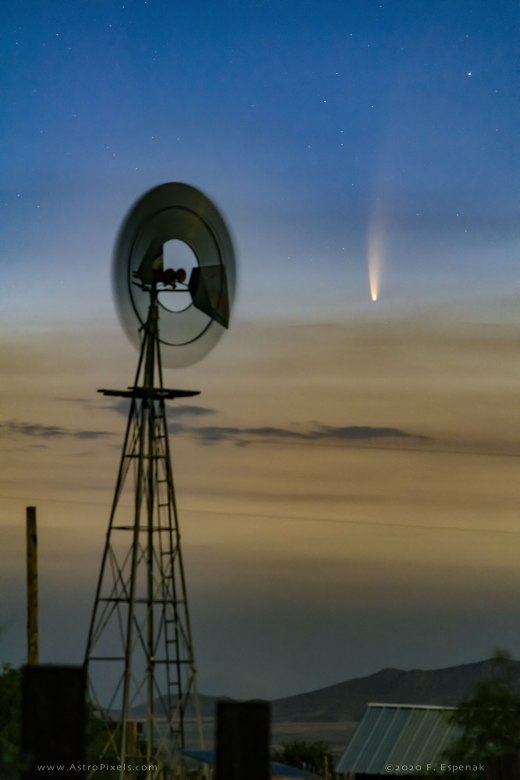
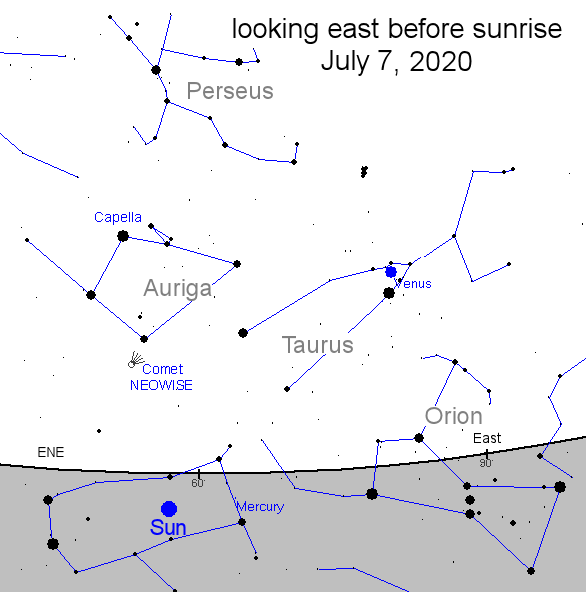
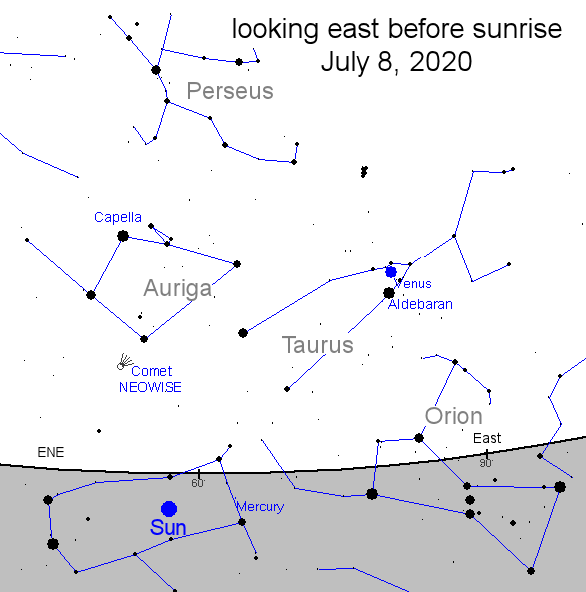
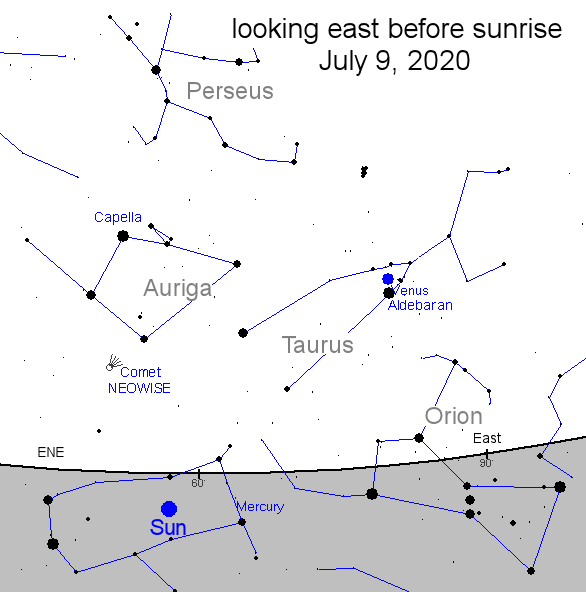
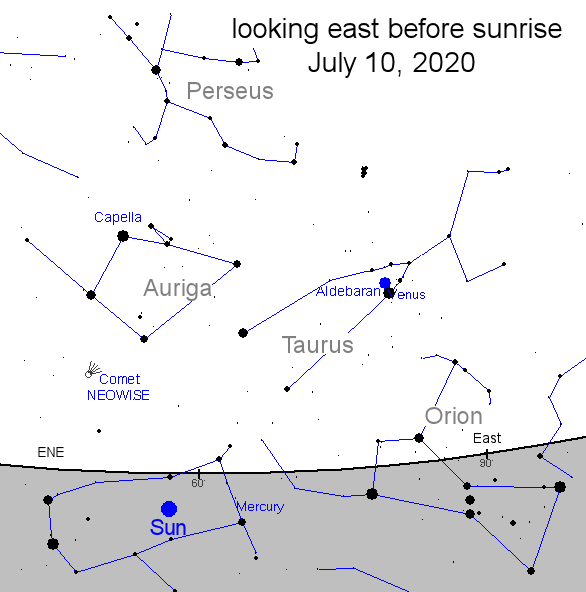
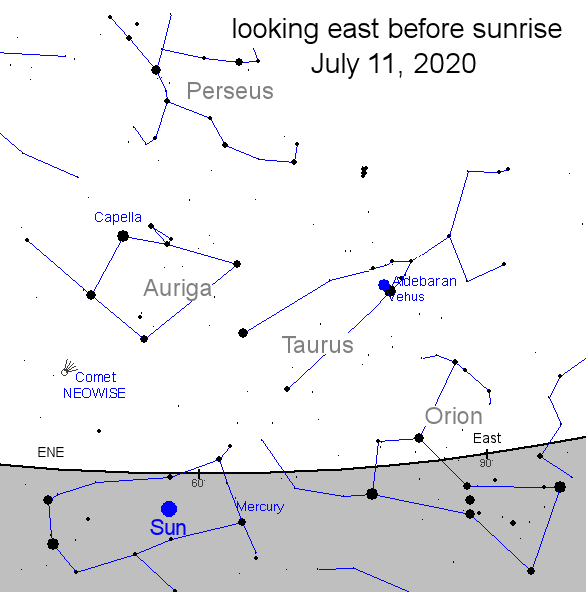
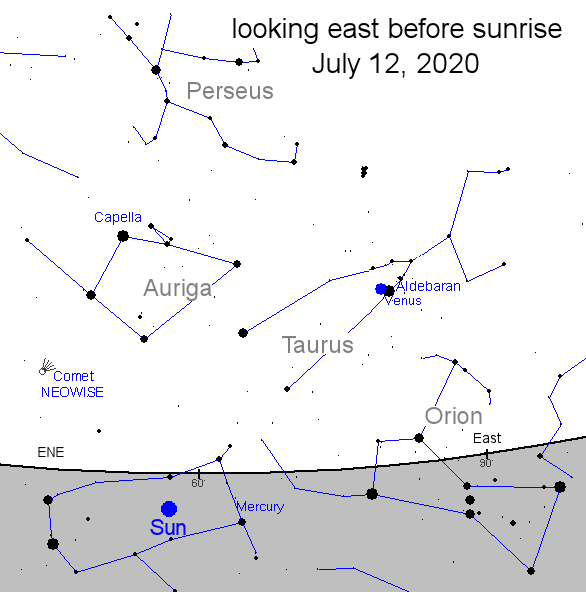
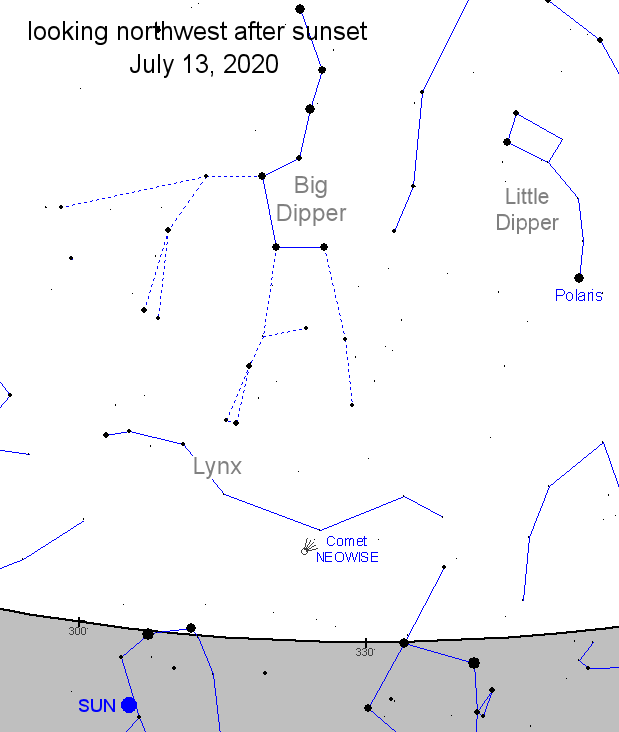
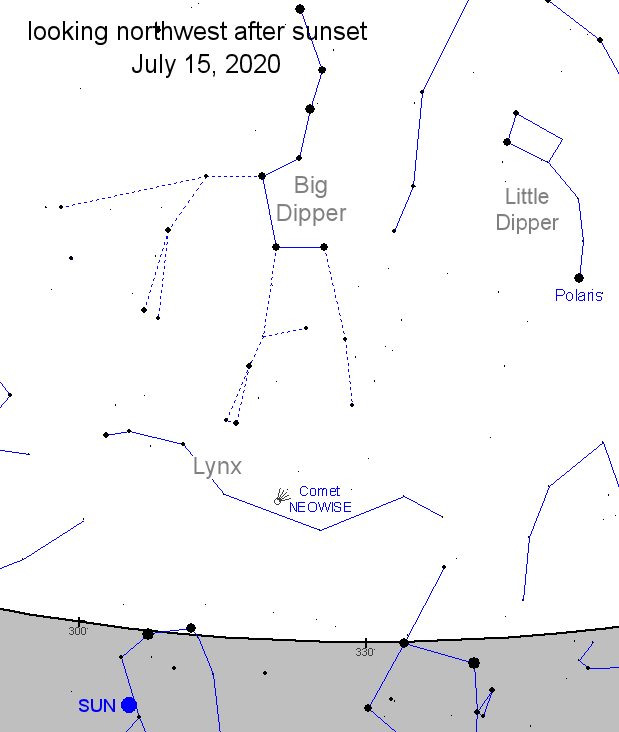
"Today was the first day that I can truly say that the comet was visible to the naked eye 100% of the time even though the sky and landscape were illuminated by a bright, nearly full Moon," he adds. Chris Schur saw even more of the comet's tail from Payson, Arizona. "I was able to see at least 5 degrees of tail through my binoculars," says Schur. "The comet was super easy to see, with maybe 3 degrees of tail visible to the naked eye." For comparison, the bowl of the Big Dipper is about 10 degrees wide. Comet NEOWISE is now a worldwide sensation. It will remain a morning comet for the next ~week, then, by mid-month, shift to evening skies where casual star gazers can see it without waking at the crack of dawn. Sky maps: July 7, 8, 9, 10, 11, 12, 13, 14, 15. Realtime Comet NEOWISE Photo Gallery
Free: Spaceweather.com Newsletter THE INFINITY BLACK PEARL: It came from Tahiti--and now it's been to the edge of space. On April 15, 2020, this genuine Black Tahitian South Sea Cultured Pearl flew to the stratosphere onboard an Earth to Sky Calculus cosmic ray balloon, soaring 107,611 feet above the Sierra Nevada mountains of central California: 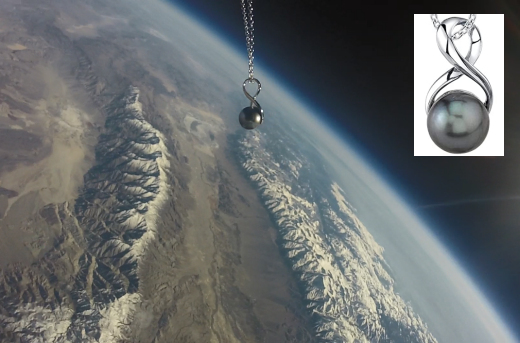
You can have it for $249.95. The students of Earth to Sky Calculus are selling these exotic space pearls to fund their cosmic ray monitoring program. Measuring 9 mm in diameter, the pearl is mounted on a 925 sterling silver infinity twist and suspended on a matching 17 inch long sterling silver chain. Each pearl comes with a greeting card showing the pendant in flight and telling the story of its journey to the edge of space. Far Out Gifts: Earth to Sky Store
All sales support hands-on STEM education
Realtime Space Weather Photo Gallery
Free: Spaceweather.com Newsletter
Every night, a network of NASA all-sky cameras scans the skies above the United States for meteoritic fireballs. Automated software maintained by NASA's Meteoroid Environment Office calculates their orbits, velocity, penetration depth in Earth's atmosphere and many other characteristics. Daily results are presented here on Spaceweather.com. On July 7, 2020, the network reported 8 fireballs.
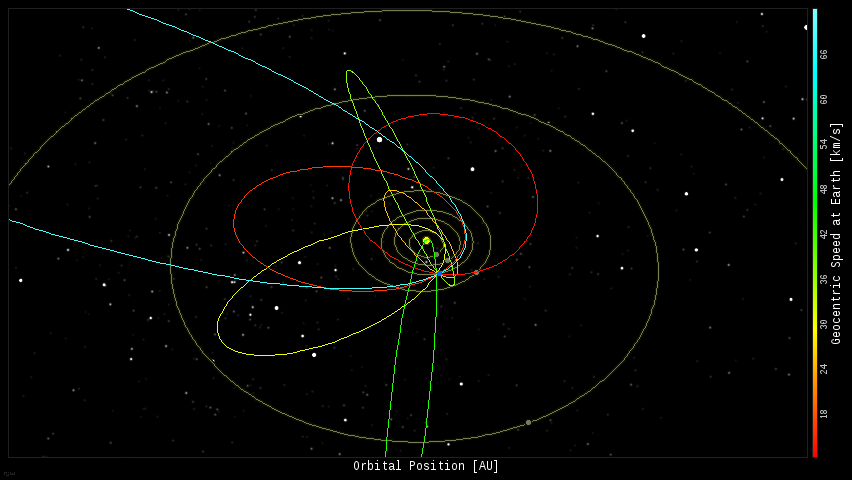
(7 sporadics, 1 Microscorpiid) 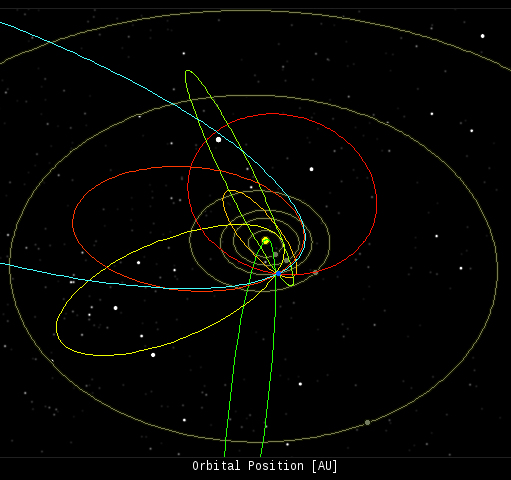 In this diagram of the inner solar system, all of the fireball orbits intersect at a single point--Earth. The orbits are color-coded by velocity, from slow (red) to fast (blue). [Larger image] [movies] Potentially Hazardous Asteroids ( PHAs) are space rocks larger than approximately 100m that can come closer to Earth than 0.05 AU. None of the known PHAs is on a collision course with our planet, although astronomers are finding new ones all the time. On July 7, 2020 there were 2037 potentially hazardous asteroids.
 | Recent & Upcoming Earth-asteroid encounters: | Asteroid | Date(UT) | Miss Distance | Velocity (km/s) | Diameter (m) | | 2020 MT2 | 2020-Jul-03 | 16.1 LD | 8.4 | 59 | | 2020 MO | 2020-Jul-03 | 9.3 LD | 9.6 | 41 | | 2007 UN12 | 2020-Jul-04 | 16.7 LD | 2.9 | 6 | | 2020 LS | 2020-Jul-04 | 19.4 LD | 11.5 | 75 | | 2020 NB | 2020-Jul-05 | 0.5 LD | 8.3 | 19 | | 2020 MU1 | 2020-Jul-11 | 18.8 LD | 2.7 | 38 | | 2020 ML | 2020-Jul-12 | 11.4 LD | 4.4 | 24 | | 2020 KJ7 | 2020-Jul-13 | 11.8 LD | 3.4 | 31 | | 2009 OS5 | 2020-Jul-13 | 17.6 LD | 2.6 | 45 | | 2020 MQ2 | 2020-Jul-14 | 17.1 LD | 8.3 | 44 | | 2020 MX | 2020-Jul-17 | 15 LD | 5.3 | 51 | | 2016 DY30 | 2020-Jul-19 | 9 LD | 15.1 | 3 | | 2020 ME3 | 2020-Jul-19 | 14.8 LD | 4.6 | 24 | | 2002 BF25 | 2020-Jul-21 | 9.4 LD | 6.8 | 129 | | 2020 MX3 | 2020-Jul-29 | 9.5 LD | 8.6 | 70 | | 2018 PY7 | 2020-Jul-31 | 8.9 LD | 9.5 | 16 | | 2007 RF1 | 2020-Jul-31 | 10.7 LD | 5 | 21 | | 2018 BD | 2020-Aug-03 | 7.6 LD | 9.4 | 3 | | 2009 PQ1 | 2020-Aug-05 | 10.8 LD | 13.5 | 112 | | 2020 FA1 | 2020-Aug-23 | 18.4 LD | 1.9 | 20 | | 2016 AH164 | 2020-Aug-26 | 15.7 LD | 5.6 | 4 | | 2011 ES4 | 2020-Sep-01 | 0.3 LD | 8.2 | 30 | Notes: LD means "Lunar Distance." 1 LD = 384,401 km, the distance between Earth and the Moon. 1 LD also equals 0.00256 AU. MAG is the visual magnitude of the asteroid on the date of closest approach. | | Cosmic Rays in the Atmosphere | SOMETHING NEW! We have developed a new predictive model of aviation radiation. It's called E-RAD--short for Empirical RADiation model. We are constantly flying radiation sensors onboard airplanes over the US and and around the world, so far collecting more than 22,000 gps-tagged radiation measurements. Using this unique dataset, we can predict the dosage on any flight over the USA with an error no worse than 15%. E-RAD lets us do something new: Every day we monitor approximately 1400 flights criss-crossing the 10 busiest routes in the continental USA. Typically, this includes more than 80,000 passengers per day. E-RAD calculates the radiation exposure for every single flight. The Hot Flights Table is a daily summary of these calculations. It shows the 5 charter flights with the highest dose rates; the 5 commercial flights with the highest dose rates; 5 commercial flights with near-average dose rates; and the 5 commercial flights with the lowest dose rates. Passengers typically experience dose rates that are 20 to 70 times higher than natural radiation at sea level. To measure radiation on airplanes, we use the same sensors we fly to the stratosphere onboard Earth to Sky Calculus cosmic ray balloons: neutron bubble chambers and X-ray/gamma-ray Geiger tubes sensitive to energies between 10 keV and 20 MeV. These energies span the range of medical X-ray machines and airport security scanners. Column definitions: (1) The flight number; (2) The maximum dose rate during the flight, expressed in units of natural radiation at sea level; (3) The maximum altitude of the plane in feet above sea level; (4) Departure city; (5) Arrival city; (6) Duration of the flight. SPACE WEATHER BALLOON DATA: Approximately once a week, Spaceweather.com and the students of Earth to Sky Calculus fly space weather balloons to the stratosphere over California. These balloons are equipped with radiation sensors that detect cosmic rays, a surprisingly "down to Earth" form of space weather. Cosmic rays can seed clouds, trigger lightning, and penetrate commercial airplanes. Furthermore, there are studies ( #1, #2, #3, #4) linking cosmic rays with cardiac arrhythmias and sudden cardiac death in the general population. Our latest measurements show that cosmic rays are intensifying, with an increase of more than 18% since 2015: 
The data points in the graph above correspond to the peak of the Regener-Pfotzer maximum, which lies about 67,000 feet above central California. When cosmic rays crash into Earth's atmosphere, they produce a spray of secondary particles that is most intense at the entrance to the stratosphere. Physicists Eric Reneger and Georg Pfotzer discovered the maximum using balloons in the 1930s and it is what we are measuring today. En route to the stratosphere, our sensors also pass through aviation altitudes: 
In this plot, dose rates are expessed as multiples of sea level. For instance, we see that boarding a plane that flies at 25,000 feet exposes passengers to dose rates ~10x higher than sea level. At 40,000 feet, the multiplier is closer to 50x. The radiation sensors onboard our helium balloons detect X-rays and gamma-rays in the energy range 10 keV to 20 MeV. These energies span the range of medical X-ray machines and airport security scanners. Why are cosmic rays intensifying? The main reason is the sun. Solar storm clouds such as coronal mass ejections (CMEs) sweep aside cosmic rays when they pass by Earth. During Solar Maximum, CMEs are abundant and cosmic rays are held at bay. Now, however, the solar cycle is swinging toward Solar Minimum, allowing cosmic rays to return. Another reason could be the weakening of Earth's magnetic field, which helps protect us from deep-space radiation. | | The official U.S. government space weather bureau | | | The first place to look for information about sundogs, pillars, rainbows and related phenomena. | | | Researchers call it a "Hubble for the sun." SDO is the most advanced solar observatory ever. | | | 3D views of the sun from NASA's Solar and Terrestrial Relations Observatory | | | Realtime and archival images of the Sun from SOHO. | | | from the NOAA Space Environment Center | | | fun to read, but should be taken with a grain of salt! Forecasts looking ahead more than a few days are often wrong. | | | from the NOAA Space Environment Center | | | the underlying science of space weather |  | To find reviews of new online casino sites in the UK try The Casino DB where there are hundreds of online casino reviews complete with bonuses and ratings. Get a bonus when playing at a new casino in the UK. The Genie got you covered! Looking for a new online casino? Try Casimpo the new site dedicated to making online casino simple and easy for all. | | | These links help Spaceweather.com stay online. Thank you to our supporters! | | | | | | | | |  | | |  | ©2019 Spaceweather.com. All rights reserved. This site is penned daily by Dr. Tony Phillips. | |


