It's waiting for you: The most successful Aurora Photo Tour on Earth! 100% success rate 4 years in a row and winner of the TripAdvisor Certificate of Excellence Award. Join LapplandMedia's aurora tours in Abisko, Swedish Lapland! | | |
GEOMAGNETIC FORECAST: Geomagnetic activity is expected to remain low for the rest of the week. The next storms are possible on May 16th when Earth enters a stream of solar wind flowing from a coronal hole on the sun. High-latitude sky watchers should be alert for auroras at that time. Aurora alerts: text, voice.
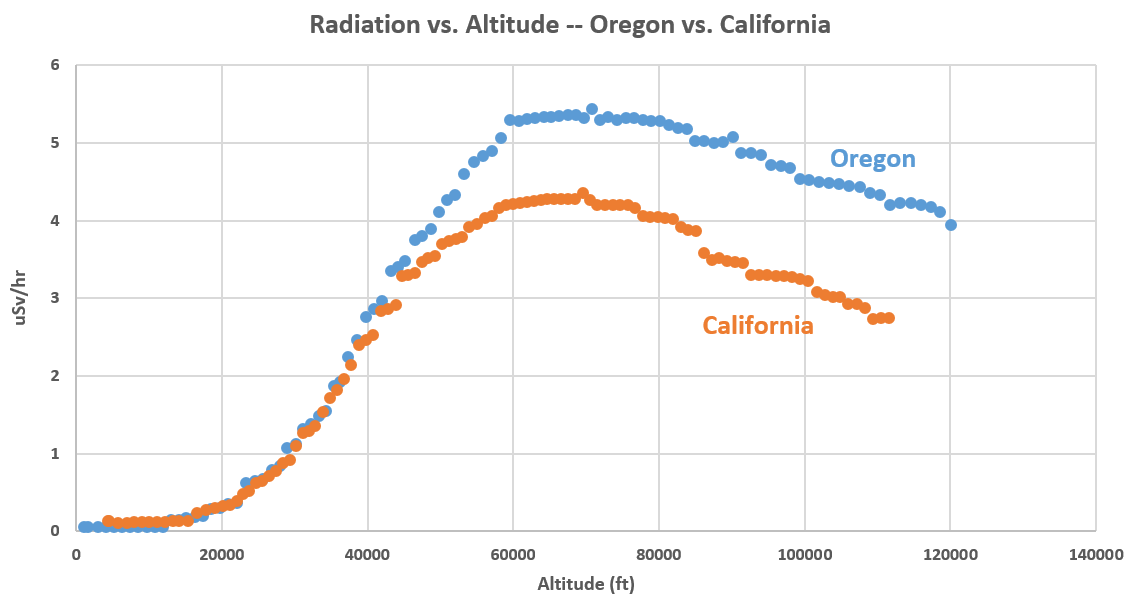
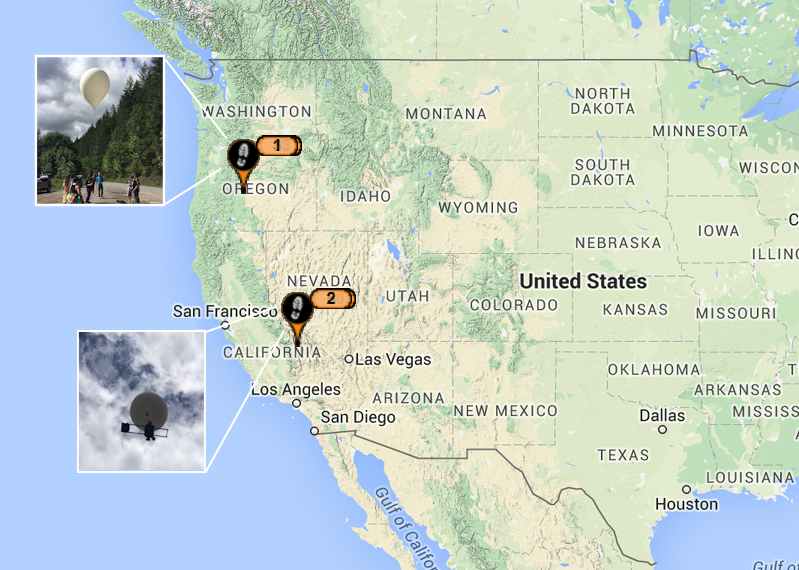
SPACE WEATHER BALLOON RESULTS: Last weekend, on May 8th, Spaceweather.com and the students of Earth to Sky Calculus simultaneously launched a pair of space weather balloons separated by 500 miles--one near Bend, Oregon, and the other near Bishop, California: map. Both balloons carried a payload of cosmic ray sensors to altitudes near 120,000 ft. Which state had more radiation in its atmosphere? The answer is Oregon:
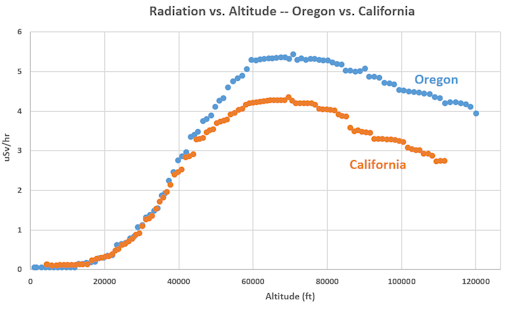
The graph shows how radiation levels changed as the balloons ascended. From ground level to 40,000 feet, the two curves are almost indistinguishable. In terms of radiation, California and Oregon are much the same at altitudes where planes fly. Above 40,000 feet, however, the curves diverge. Peak radiation levels detected in the stratosphere over Oregon were more than 25% higher than California.
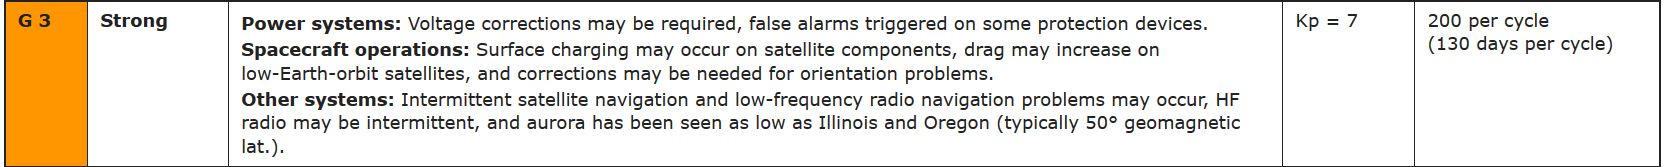
Some of this difference is to be expected. Oregon is closer to Earth's magnetic north pole where radiation levels are naturally higher. The natural difference between Oregon and California might have been amplified by space weather. At the time of the balloon launch, the strongest geomagnetic storm of 2016 (a G3-class event now known as the "Mother's Day Storm") was underway.
Could the Mother's Day Storm have been a factor? We will have to launch another pair of balloons to find out. A repeat of the experiment during quiet conditions should reveal the role of geomagnetic activity.
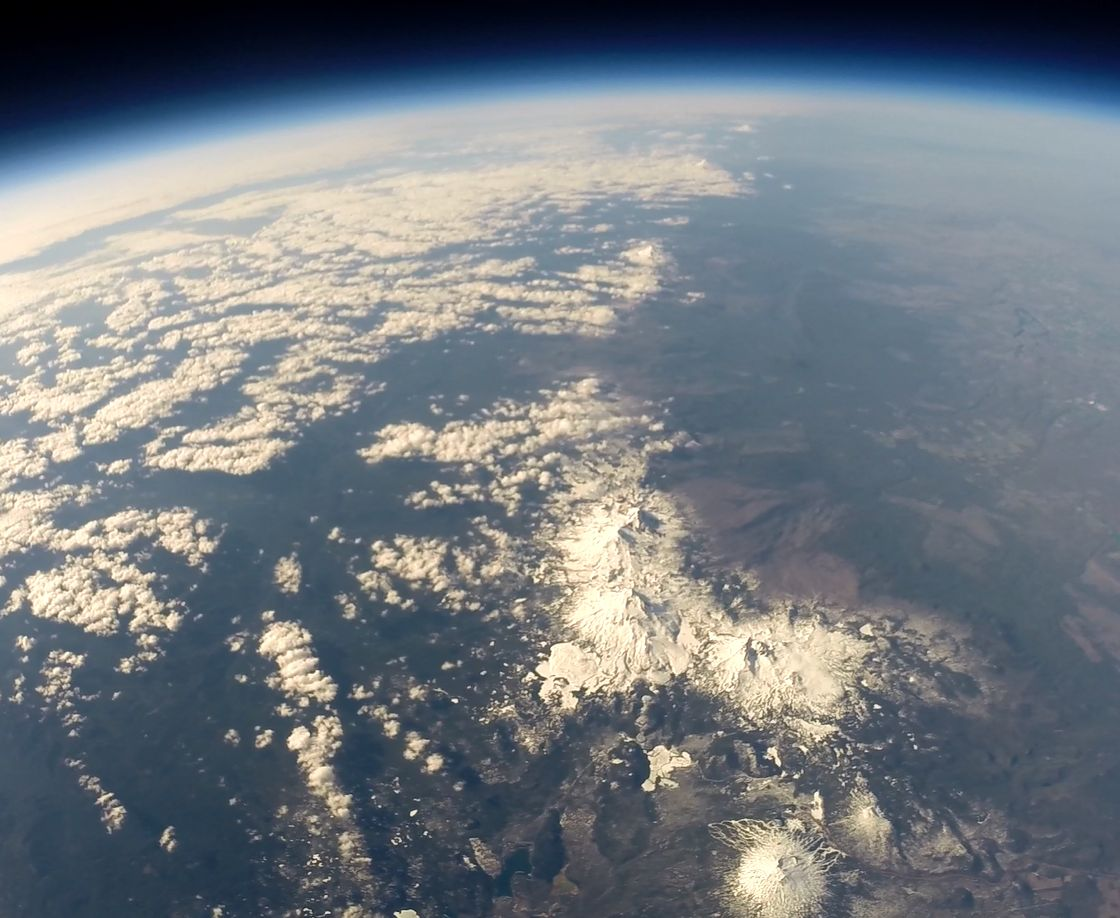
Balloon flights produce more than just good data. There's also spectacular photography. This shot shows the Cascade mountains of Oregon from 120,700 ft:
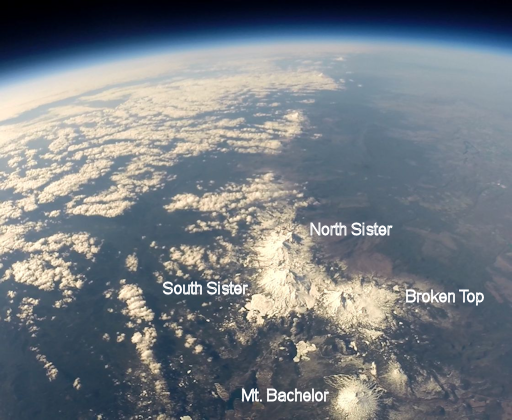
Sponsors of our research can have their pictures taken in front of this landscape. If you would like to sponsor our next Oregon-California balloon flight, currently scheduled for June, please contact Dr. Tony Phillips to get involved.
EARTH'S MAGNETIC FIELD IS CHANGING: Anyone watching a compass needle point steadily north might suppose that Earth's magnetic field is a constant. It's not. Researchers have long known that changes are afoot. The north magnetic pole routinely moves, as much as 40 km/yr, causing compass needles to drift over time. Moreover, the global magnetic field has weakened 10% since the 19th century.
A new study by the European Space Agency's constellation of Swarm satellites reveals that changes may be happening even faster than previously thought. In this map, blue depicts where Earth's magnetic field is weak and red shows regions where it is strong:
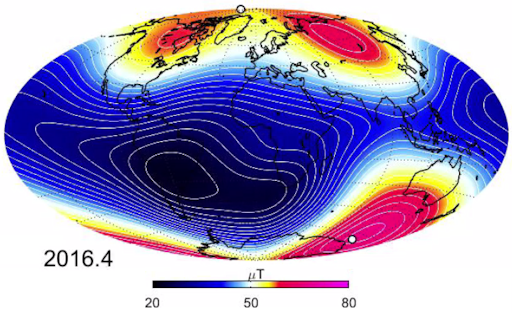
Data from Swarm, combined with observations from the CHAMP and Ørsted satellites, show clearly that the field has weakened by about 3.5% at high latitudes over North America, while it has strengthened about 2% over Asia. The region where the field is at its weakest – the South Atlantic Anomaly – has moved steadily westward and weakened further by about 2%. These changes have occured over the relatively brief period between 1999 and mid-2016.
Earth's magnetic field protects us from solar storms and cosmic rays. Less magnetism means more radiation can penetrate our planet's atmosphere. Indeed, high altitude balloons launched by Spaceweather.com routinely detect increasing levels of cosmic rays over California. Perhaps the ebbing magnetic field over North America contributes to that trend.
As remarkable as these changes sound, they're mild compared to what Earth's magnetic field has done in the past. Sometimes the field completely flips, with north and the south poles swapping places. Such reversals, recorded in the magnetism of ancient rocks, are unpredictable. They come at irregular intervals averaging about 300,000 years; the last one was 780,000 years ago. Are we overdue for another? No one knows.
Swarm is a trio of satellites equipped with vector magnetometers capable of sensing Earth's magnetic field all the way from orbital altitudes down to the edge of our planet's core. The constellation is expected to continue operations at least until 2017, and possibly beyond, so stay tuned for updates.
Realtime Space Weather Photo Gallery
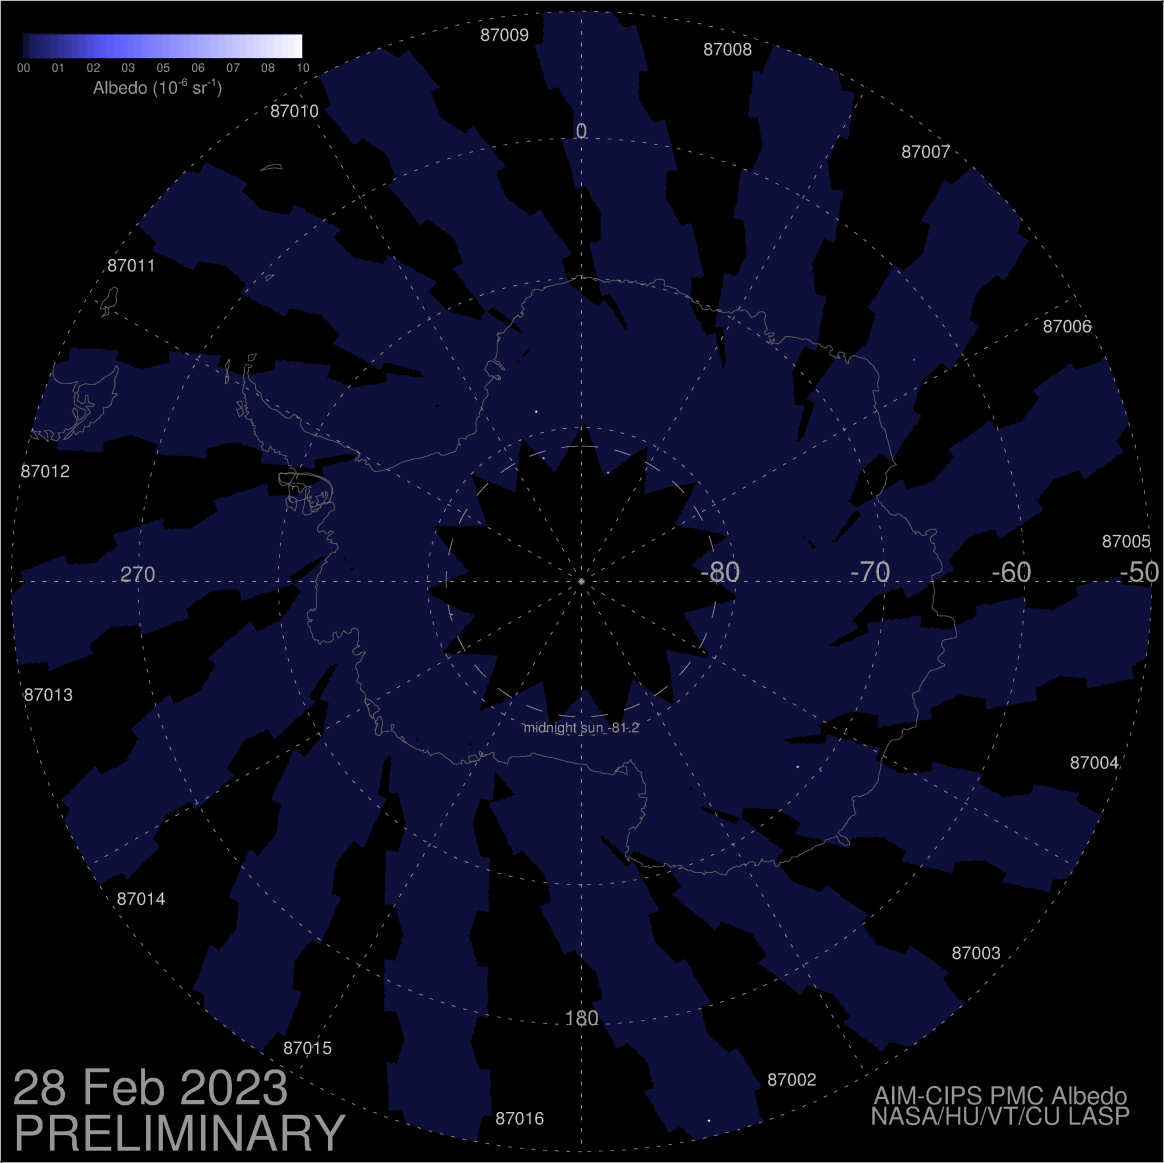
WHAT ARE THESE CLOUDS? Every summer, something strange and wonderful happens high above the Earth's poles. Ice crystals form and cling to the smoky remains of meteors, forming electric-blue clouds with tendrils that ripple hypnotically against the sunset sky. The arrival of the first "noctilucent clouds" (NLCs) is always eagerly anticipated by high-latitude sky watchers. On May 10th in Scotland, Andy Stables may have spotted the first apparition of 2016:
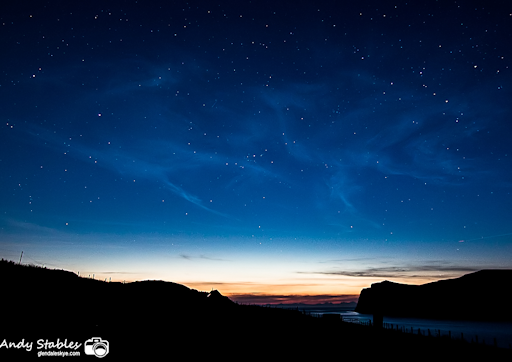
"I feel certain these are noctilucent clouds," says Stables, who is a veteran observer of NLCs, "but it is exceptionally early to capture them. It is the earliest I have ever managed to see them here on the Isle of Skye."
Normally, the first noctilucent clouds appear in late May or even early June. An apparition on May 10th makes one wonder if this could be something else--e.g., unusually high cirrus clouds catching the rays of the sun after sunset.
"I tried to convince myself that these might be cirrus clouds, but the sun was more than 12o below the horizon, which would make catching cirrus quite difficult," adds Stables.
NLCs are Earth's highest clouds. Seeded by meteoroids, they float at the edge of space more than 80 km above the planet's surface. The clouds are very cold and filled with tiny ice crystals that glow electric-blue when they catch the rays of the setting sun.
The jury's still out on whether the clouds Stables saw are NLCs. NASA's AIM spacecraft, which monitors noctilucent clouds from Earth orbit, has not yet confirmed the sighting. Under certain lighting conditions, however, the human eye can be more sensitive to NLCs than instruments on the spacecraft, so they could be real.
Just in case, high-latitude sky watchers should be alert for NLCs in the evenings ahead. Observing tips: Look west 30 to 60 minutes after sunset when the sun has dipped 6o to 16o below the horizon. If you see luminous blue-white tendrils spreading across the sky, you've probably spotted a noctilucent cloud.
Realtime NLC Photo Gallery
Realtime Aurora Photo Gallery
Realtime Comet Photo Gallery
Every night, a network of
NASA all-sky cameras scans the skies above the United States for meteoritic fireballs. Automated software maintained by NASA's Meteoroid Environment Office calculates their orbits, velocity, penetration depth in Earth's atmosphere and many other characteristics. Daily results are presented here on Spaceweather.com.
On May. 14, 2016, the network reported 11 fireballs.
(11 sporadics)
In this diagram of the inner solar system, all of the fireball orbits intersect at a single point--Earth. The orbits are color-coded by velocity, from slow (red) to fast (blue). [Larger image] [movies]
Potentially Hazardous Asteroids (
PHAs) are space rocks larger than approximately 100m that can come closer to Earth than 0.05 AU. None of the known PHAs is on a collision course with our planet, although astronomers are finding
new ones all the time.
On May 14, 2016 there were 1702 potentially hazardous asteroids.
Notes: LD means "Lunar Distance." 1 LD = 384,401 km, the distance between Earth and the Moon. 1 LD also equals 0.00256 AU. MAG is the visual magnitude of the asteroid on the date of closest approach. | | Cosmic Rays in the Atmosphere |
| Situation Report -- Oct. 30, 2015 | Stratospheric Radiation (+37o N) |
| Cosmic ray levels are elevated (+6.1% above the Space Age median). The trend is flat. Cosmic ray levels have increased +0% in the past month. |
| Sept. 06: 4.14 uSv/hr (414 uRad/hr) |
| Sept. 12: 4.09 uSv/hr (409 uRad/hr) |
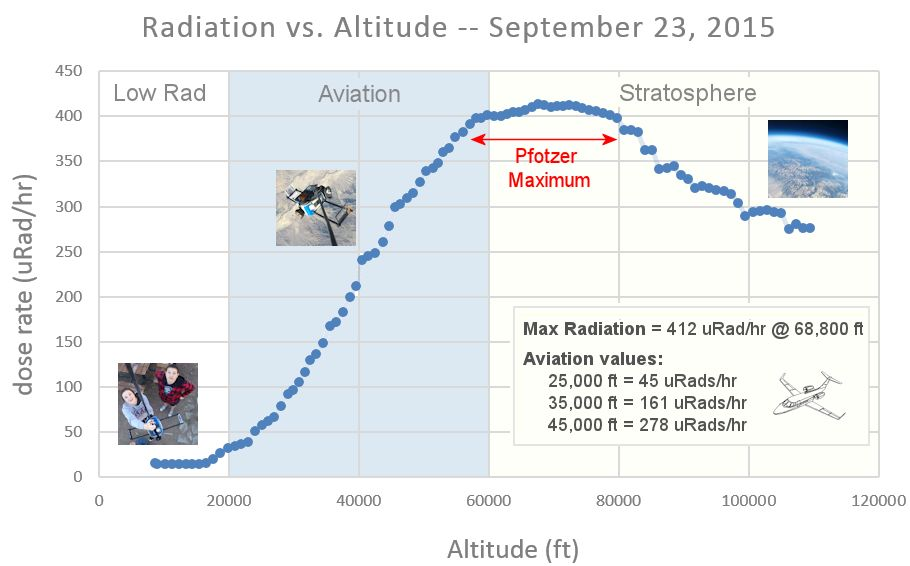
| Sept. 23: 4.12 uSv/hr (412 uRad/hr) |
| Sept. 25: 4.16 uSv/hr (416 uRad/hr) |
| Sept. 27: 4.13 uSv/hr (413 uRad/hr) |
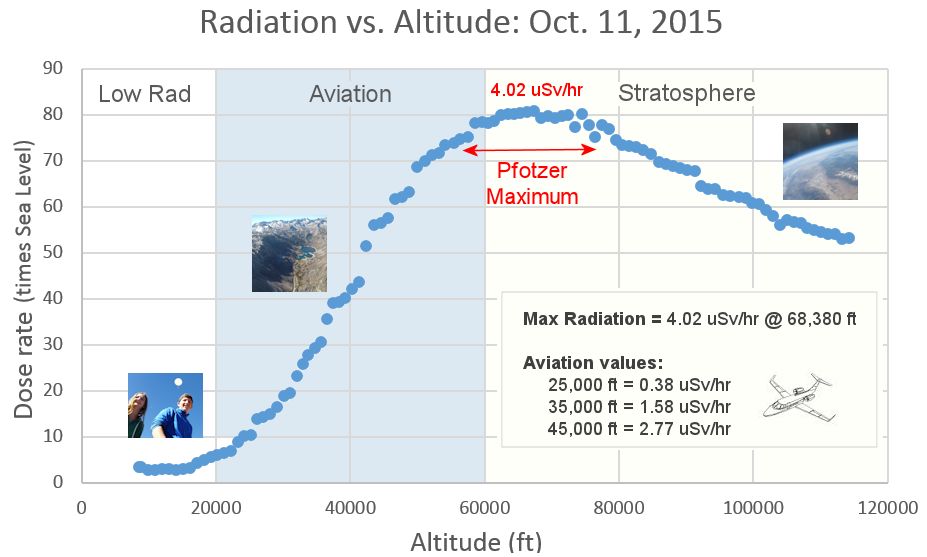
| Oct. 11: 4.02 uSv/hr (402 uRad/hr) |
| Oct. 22: 4.11 uSv/hr (411 uRad/hr) |
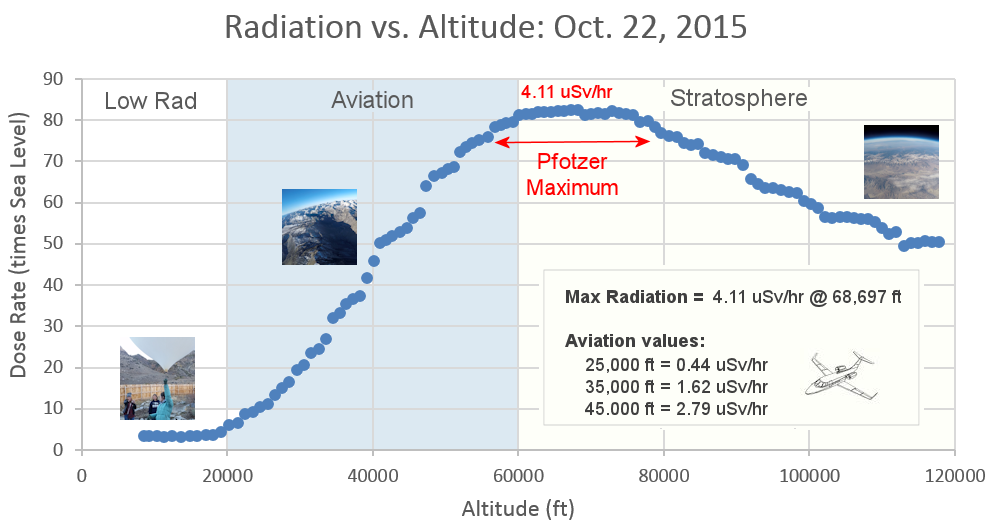
These measurements are based on regular space weather balloon flights: learn more. Approximately once a week, Spaceweather.com and the students of Earth to Sky Calculus fly "space weather balloons" to the stratosphere over California. These balloons are equipped with radiation sensors that detect cosmic rays, a surprisingly "down to Earth" form of space weather. Cosmic rays can seed clouds, trigger lightning, and penetrate commercial airplanes. Our measurements show that someone flying back and forth across the continental USA, just once, can absorb as much ionizing radiation as 2 to 5 dental X-rays. For example, here is the data from a flight on Oct. 22, 2015:
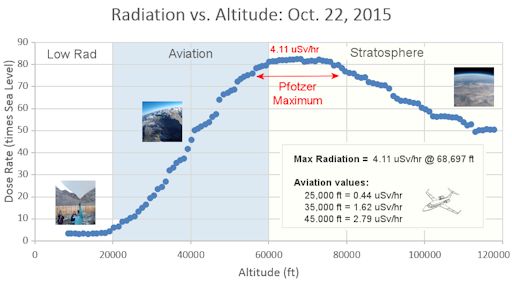
Radiation levels peak at the entrance to the stratosphere in a broad region called the "Pfotzer Maximum." This peak is named after physicist George Pfotzer who discovered it using balloons and Geiger tubes in the 1930s. Radiation levels there are more than 80x sea level.
Note that the bottom of the Pfotzer Maximim is near 55,000 ft. This means that some high-flying aircraft are not far from the zone of maximum radiation. Indeed, according to the Oct 22th measurements, a plane flying at 45,000 feet is exposed to 2.79 uSv/hr. At that rate, a passenger would absorb about one dental X-ray's worth of radiation in about 5 hours.
The radiation sensors onboard our helium balloons detect X-rays and gamma-rays in the energy range 10 keV to 20 MeV. These energies span the range of medical X-ray machines and airport security scanners.
| | The official U.S. government space weather bureau |
| | The first place to look for information about sundogs, pillars, rainbows and related phenomena. |
| | Researchers call it a "Hubble for the sun." SDO is the most advanced solar observatory ever. |
| | 3D views of the sun from NASA's Solar and Terrestrial Relations Observatory |
| | Realtime and archival images of the Sun from SOHO. |
| | from the NOAA Space Environment Center |
| | the underlying science of space weather |
 | Sponsored link: Claim your tax refund with this UK tax rebate company and get back your overpaid tax. |
| Sponsored link: Enjoy this fabulous range of leather sofas from a leader in the UK sofa manufacturer industry.. |


