All-inclusive Northern Lights trips in Tromsø, Norway. Small groups, big experiences! Highly qualified guides ensure unique and unforgettable adventures with a personal touch. Visit Explore the Arctic | | |
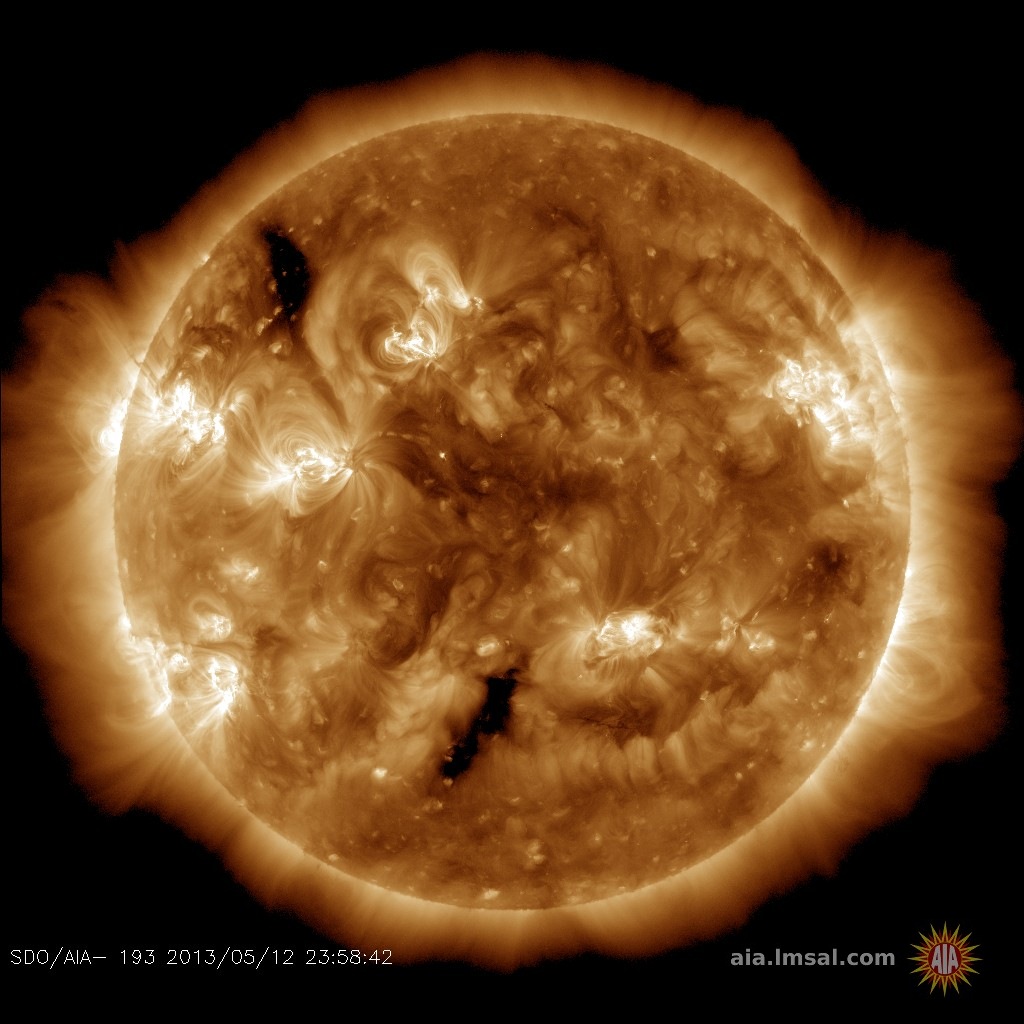
SOLAR MINIMUM DEEPENS: The sun has been without sunspots for 30 of the past 31 days. To find a similar stretch of blanks suns, you have to go back to 2009 when the sun was experiencing the deepest solar minimum in a century. Clearly, solar minimum has returned, bringing extra cosmic rays, long-lasting holes in the sun's atmosphere, and strangely pink auroras. Free: Aurora alerts.
LATE-SEASON SURGE IN NOCTILUCENT CLOUDS: Noctilucent clouds (NLCs) are behaving strangely. Normally, NLCs begin to dim in late July, then fade away completely as August unfolds. It is their seasonal pattern. This year, though, the night-shining clouds are surging as July comes to an end. "We had a mind-blowing display of noctilucent clouds display on July 26th," reports Kairo Kiitsak, who sends this picture from Simuna, Estonia:
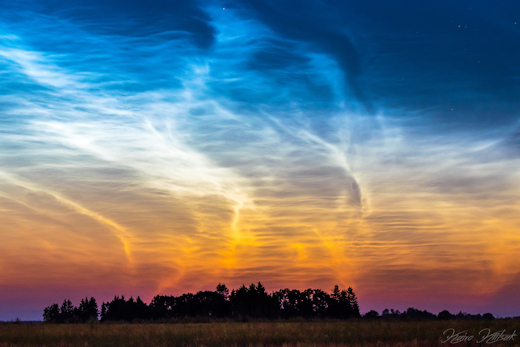
"The rippling structure of the clouds was amazing," says Kiitsak. "In all, the display lasted for full three hours."
The clouds rippled as far south as Poland, where Marek Nikodem saw them before sunrise on July 28th:
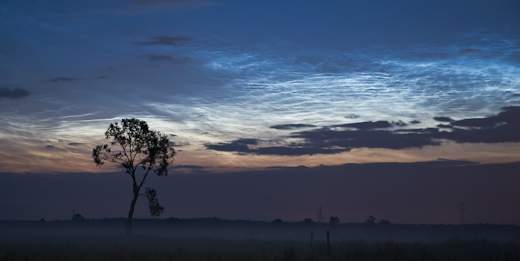
"It was quite a surprise," says Nikodem. "As a rule, the NLC season in Poland ends around July 25. But not this year, today in the morning there was a bright and really beautiful display."
Noctilucent clouds form when summertime wisps of water vapor rise to the top of the atmosphere and wrap themselves around specks of meteor smoke. Mesospheric winds assemble the resulting ice crystals into NLCs. In 2017 a heat wave in the mesosphere melted those crystals, causing a brief "noctilucent blackout." Could something similar, but opposite, be happening now? Perhaps a cold spell in the mesosphere is extending the season. Another possibility is the solar cycle. Previous studies have shown that NLCs sometimes intensify during solar minimum. Solar minimum conditions are in effect now as the sun has been without spots for 30 of the past 31 days.
Stay tuned for updates.
Realtime Noctilucent Cloud Photo Gallery
TOTAL ECLIPSE OF THE MOON: On July 27, 2018, the Moon passed through the shadow of our planet, producing the longest lunar eclipse of the century. The face of the Moon turned red for 1 hour and 43 minutes--an event visible from every continent except North America. Anthony Ayiomamitis photographed the eclipse from Athens, Greece:
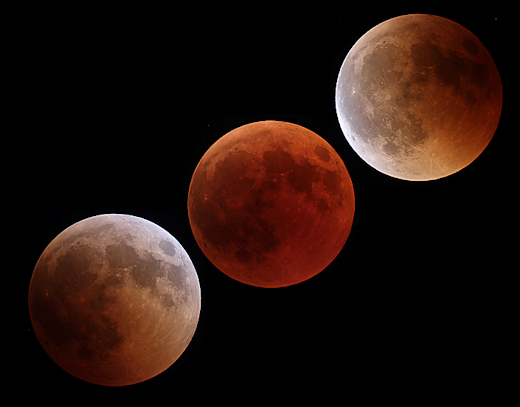
"We were very fortunate to have pristine skies for this evenings longest total lunar eclipse of the 21st century," says Ayiomamitis.
In the composite image, above, Anthony sandwiched an image of the all-red totally eclipsed Moon between images of the Moon just before and after totality. Note the fringes of pale blue in those outer Moons.
The blue color is caused by ozone. Atmospheric scientist Richard Keen of the University of Colorado explains: "Most of the light illuminating the Moon passes through the stratosphere, and is reddened by scattering. However, light passing through the upper stratosphere penetrates the ozone layer, which absorbs red light and actually makes the passing light ray bluer." This creates a turquoise-blue border around the red.
For more shots of the eclipse, and its "ozone fringe," browse the photo gallery:
Realtime Lunar Eclipse Photo Gallery
FAR-OUT GIFT: Nothing says "I Love You" like a heart-shaped pendant from the edge of space. On March 17, 2018, the students of Earth to Sky Calculus flew an array of cosmic ray sensors to the stratosphere onboard a giant helium balloon. This pendant went along for the ride:
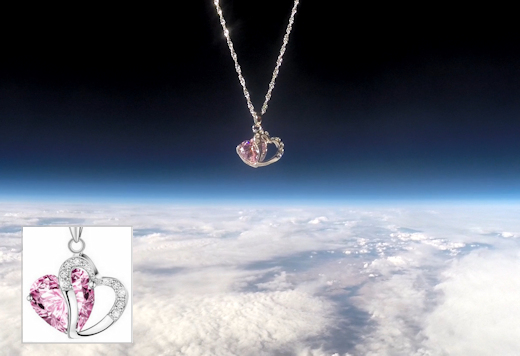
You can have it for $99.95. The students are selling these pendants as a fund-raiser for their cosmic ray monitoring program. Each pendant comes with a greeting card showing the jewelry in flight and telling the story of its journey to the stratosphere and back again.
Far Out Gifts: Earth to Sky Store
All sales support hands-on STEM education
Realtime Aurora Photo Gallery
Realtime Space Weather Photo Gallery
Every night, a network of
NASA all-sky cameras scans the skies above the United States for meteoritic fireballs. Automated software maintained by NASA's Meteoroid Environment Office calculates their orbits, velocity, penetration depth in Earth's atmosphere and many other characteristics. Daily results are presented here on Spaceweather.com.
On Jul. 28, 2018, the network reported 145 fireballs.
(139 sporadics, 3 Perseids, 2 , 1 Southern delta Aquariid)
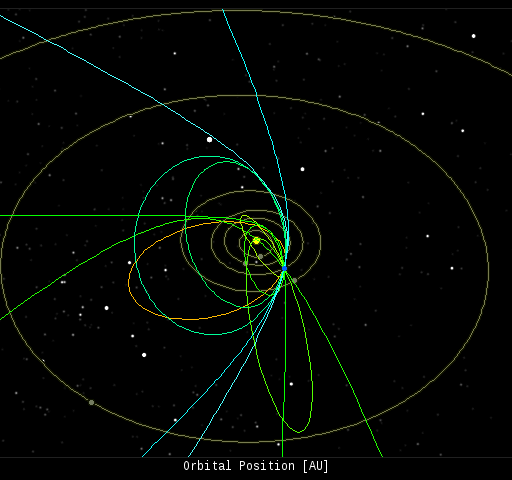
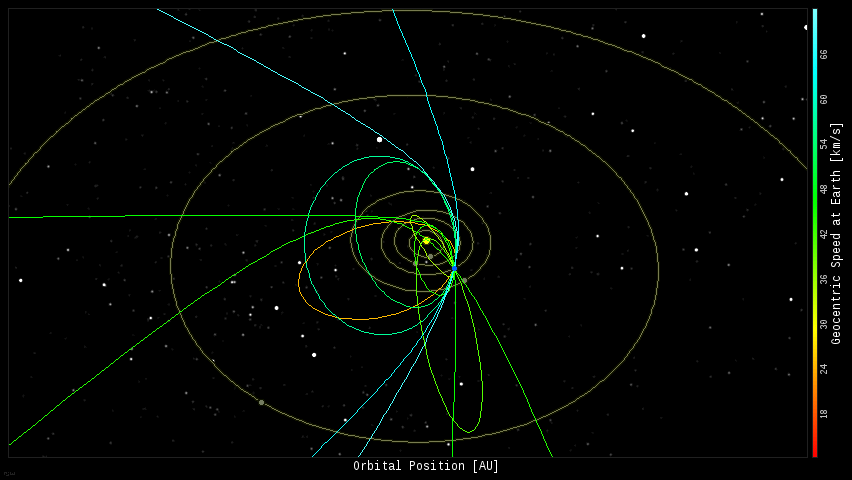
In this diagram of the inner solar system, all of the fireball orbits intersect at a single point--Earth. The orbits are color-coded by velocity, from slow (red) to fast (blue). [Larger image] [movies]
Potentially Hazardous Asteroids (
PHAs) are space rocks larger than approximately 100m that can come closer to Earth than 0.05 AU. None of the known PHAs is on a collision course with our planet, although astronomers are finding
new ones all the time.
On July 28, 2018 there were 1912 potentially hazardous asteroids.
 |
Recent & Upcoming Earth-asteroid encounters: | Asteroid | Date(UT) | Miss Distance | Velocity (km/s) | Diameter (m) |
| 2018 NR1 | 2018-Jul-27 | 17.1 LD | 5.1 | 35 |
| 2018 OZ | 2018-Aug-06 | 7 LD | 9.6 | 34 |
| 2018 LQ2 | 2018-Aug-27 | 9.4 LD | 1.5 | 39 |
| 2016 GK135 | 2018-Aug-28 | 16.8 LD | 2.8 | 9 |
| 2016 NF23 | 2018-Aug-29 | 13.3 LD | 9 | 93 |
| 1998 SD9 | 2018-Aug-29 | 4.2 LD | 10.7 | 51 |
| 2018 DE1 | 2018-Aug-30 | 15.2 LD | 6.5 | 28 |
| 2001 RQ17 | 2018-Sep-02 | 19.3 LD | 8.3 | 107 |
| 2015 FP118 | 2018-Sep-03 | 12.3 LD | 9.8 | 490 |
| 2017 SL16 | 2018-Sep-20 | 8.5 LD | 6.4 | 25 |
Notes: LD means "Lunar Distance." 1 LD = 384,401 km, the distance between Earth and the Moon. 1 LD also equals 0.00256 AU. MAG is the visual magnitude of the asteroid on the date of closest approach. | | Cosmic Rays in the Atmosphere |
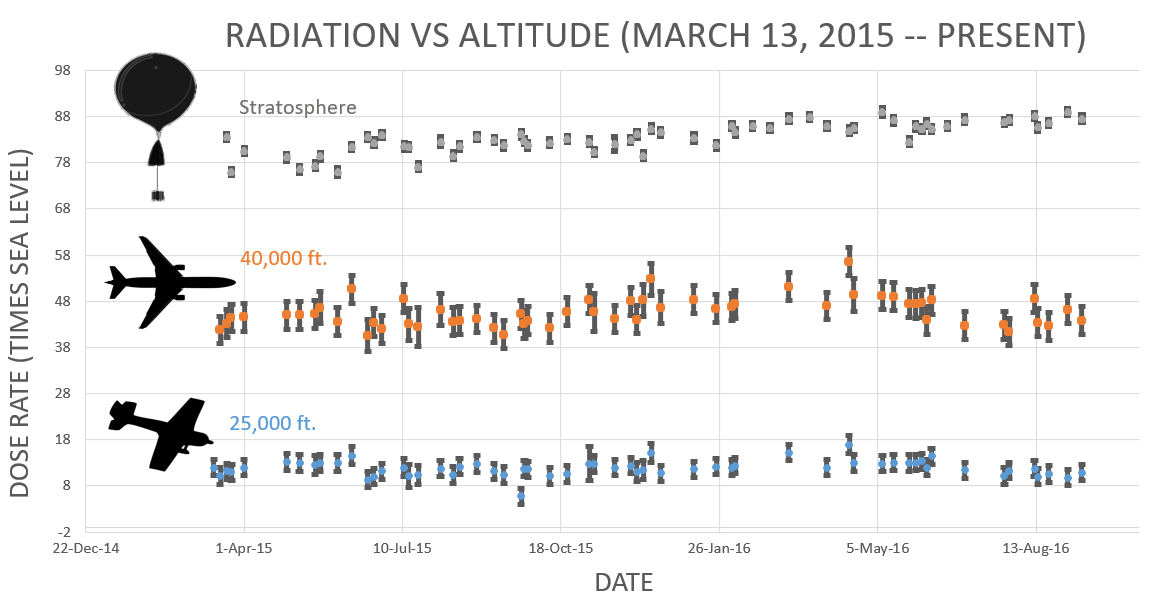
Readers, thank you for your patience while we continue to develop this new section of Spaceweather.com. We've been working to streamline our data reduction, allowing us to post results from balloon flights much more rapidly, and we have developed a new data product, shown here:

This plot displays radiation measurements not only in the stratosphere, but also at aviation altitudes. Dose rates are expessed as multiples of sea level. For instance, we see that boarding a plane that flies at 25,000 feet exposes passengers to dose rates ~10x higher than sea level. At 40,000 feet, the multiplier is closer to 50x. These measurements are made by our usual cosmic ray payload as it passes through aviation altitudes en route to the stratosphere over California.
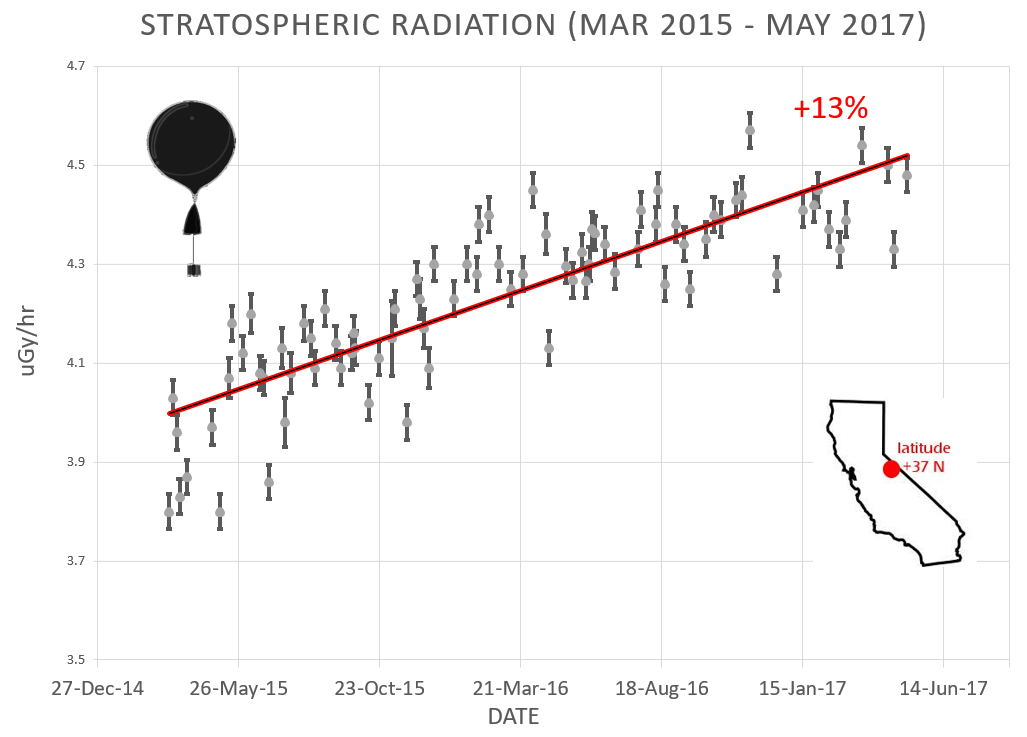
What is this all about? Approximately once a week, Spaceweather.com and the students of Earth to Sky Calculus fly space weather balloons to the stratosphere over California. These balloons are equipped with radiation sensors that detect cosmic rays, a surprisingly "down to Earth" form of space weather. Cosmic rays can seed clouds, trigger lightning, and penetrate commercial airplanes. Furthermore, there are studies ( #1, #2, #3, #4) linking cosmic rays with cardiac arrhythmias and sudden cardiac death in the general population. Our latest measurements show that cosmic rays are intensifying, with an increase of more than 13% since 2015:
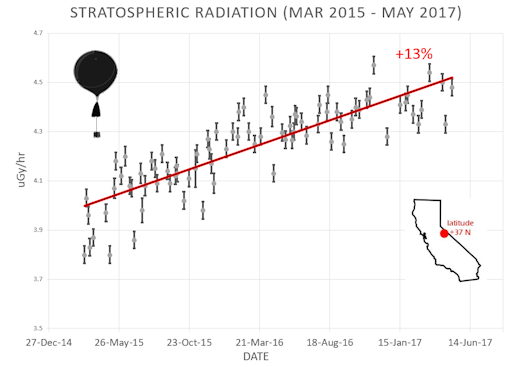
Why are cosmic rays intensifying? The main reason is the sun. Solar storm clouds such as coronal mass ejections (CMEs) sweep aside cosmic rays when they pass by Earth. During Solar Maximum, CMEs are abundant and cosmic rays are held at bay. Now, however, the solar cycle is swinging toward Solar Minimum, allowing cosmic rays to return. Another reason could be the weakening of Earth's magnetic field, which helps protect us from deep-space radiation.
The radiation sensors onboard our helium balloons detect X-rays and gamma-rays in the energy range 10 keV to 20 MeV. These energies span the range of medical X-ray machines and airport security scanners.
The data points in the graph above correspond to the peak of the Reneger-Pfotzer maximum, which lies about 67,000 feet above central California. When cosmic rays crash into Earth's atmosphere, they produce a spray of secondary particles that is most intense at the entrance to the stratosphere. Physicists Eric Reneger and Georg Pfotzer discovered the maximum using balloons in the 1930s and it is what we are measuring today.
| | The official U.S. government space weather bureau |
| | The first place to look for information about sundogs, pillars, rainbows and related phenomena. |
| | Researchers call it a "Hubble for the sun." SDO is the most advanced solar observatory ever. |
| | 3D views of the sun from NASA's Solar and Terrestrial Relations Observatory |
| | Realtime and archival images of the Sun from SOHO. |
| | from the NOAA Space Environment Center |
| | fun to read, but should be taken with a grain of salt! Forecasts looking ahead more than a few days are often wrong. |
| | from the NOAA Space Environment Center |
| | the underlying science of space weather |
 | If you are a Youtuber and want to buy real Youtube views than try out Buyrealsocial.com for the best results possible! |
| To find reviews of new online casino sites in the UK try The Casino DB where there are hundreds of online casino reviews complete with bonuses and ratings. |
| | These links help Spaceweather.com stay online. Thank you to our supporters! |
| | | | | | |


