Spotless Days Current Stretch: 12 days 2020 total: 28 days (62%) 2019 total: 281 days (77%) 2018 total: 221 days (61%) 2017 total: 104 days (28%) 2016 total: 32 days (9%) 2015 total: 0 days (0%) 2014 total: 1 day (<1%) 2013 total: 0 days (0%) 2012 total: 0 days (0%) 2011 total: 2 days (<1%) 2010 total: 51 days (14%) 2009 total: 260 days (71%) 2008 total: 268 days (73%) 2007 total: 152 days (42%) 2006 total: 70 days (19%) Updated 14 Feb 2020
Thermosphere Climate Index today: 3.53x10¹⁰W Cold Max: 49.4x10¹⁰ W Hot (10/1957) Min: 2.05x10¹⁰W Cold (02/2009) explanation | more data:gfx, txt Updated 14 Feb 2020
Cosmic RaysSolar minimum is underway. The sun's magnetic field is weak, allowing extra cosmic rays into the solar system. Neutron counts from the University of Oulu's Sodankyla Geophysical Observatory show that cosmic rays reaching Earth in 2019 are near a Space Age peak. Oulu Neutron Counts Percentages of the Space Age average: today: +10.6% Very High 7-day change: +0.3% Max: +11.7% Very High (12/2009) Min: -32.1% Very Low (06/1991) explanation |more data Updated 14 Feb 2020 @ 1800 UT
Planetary K-index Now: Kp= 0 quiet 24-hr max: Kp= 2 quiet explanation | more data
Interplanetary Mag. Field Btotal: 2.8 nT Bz: 1.7 nT north more data: ACE, DSCOVR Updated: Today at 2346 UT
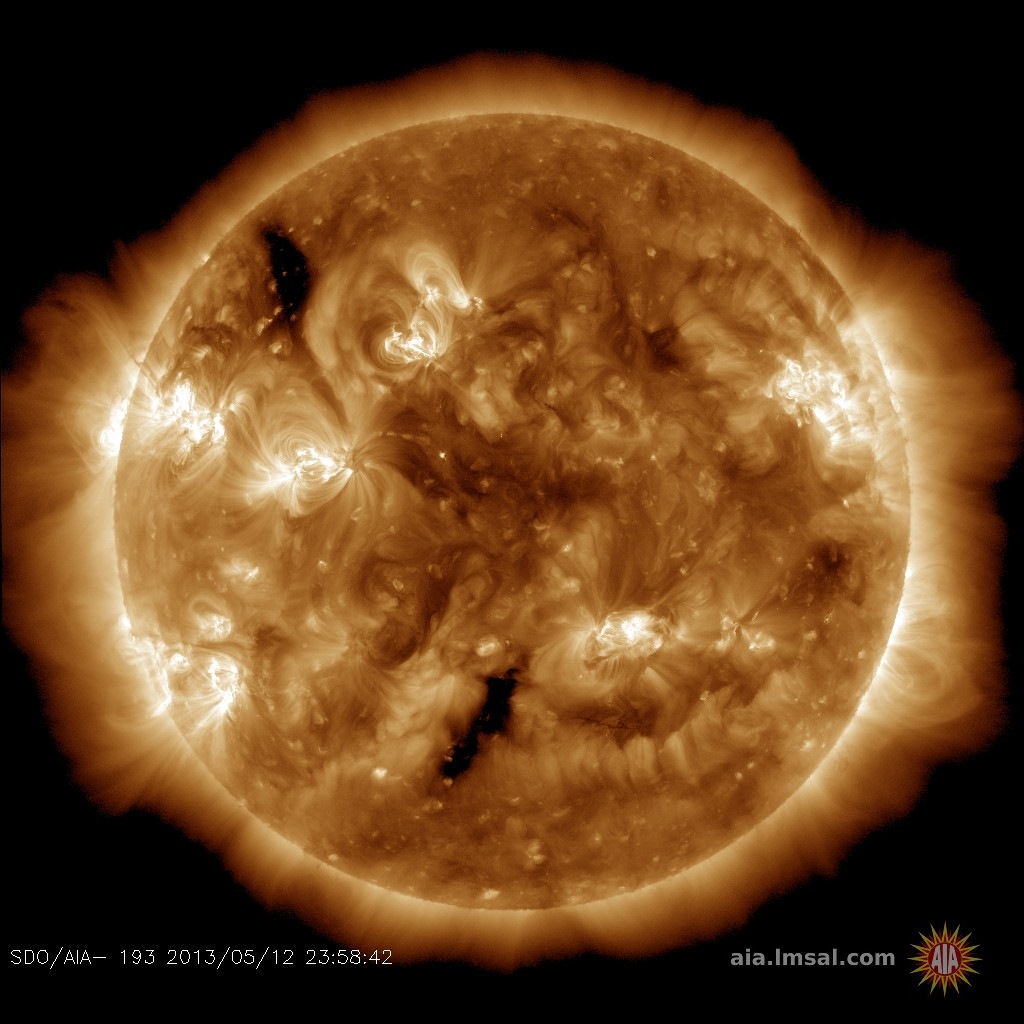
Coronal Holes: 14 Feb 20
Solar wind flowing from this shallow coronal hole could buffet Earth's magnetic field on Feb. 16-17. Credit: SDO/AIA
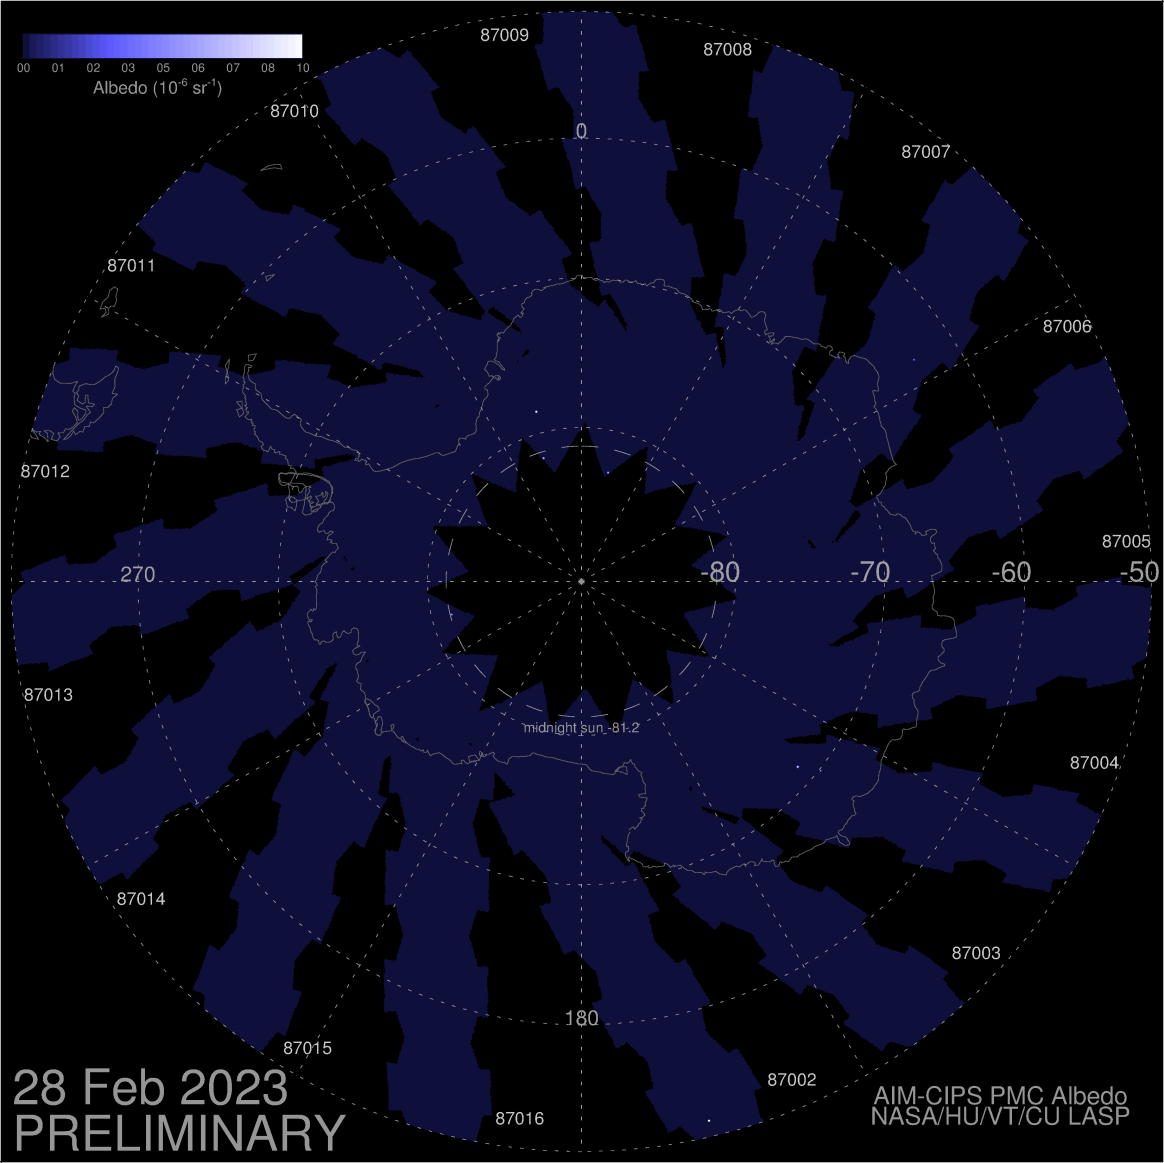
Noctilucent CloudsThe southern hemisphere season for noctilucent clouds began on Nov. 15th--the earliest start in recorded history. Check here for daily images from NASA's AIM spacecraft.
Geomagnetic Storms: Probabilities for significant disturbances in Earth's magnetic field are given for three activity levels: active, minor storm, severe storm
Updated at: 2020 Feb 14 2200 UTC
Mid-latitudes
0-24 hr
24-48 hr
ACTIVE
10 %
10 %
MINOR
01 %
01 %
SEVERE
01 %
01 %
High latitudes
0-24 hr
24-48 hr
ACTIVE
15 %
15 %
MINOR
20 %
20 %
SEVERE
10 %
10 %
Friday, Feb. 14, 2020
What's up in space
Marianne’s Arctic tours: Operating in small groups of 7 to 14 persons--all needs supplied for safety, comfort and pleasure. Night & day photography or non-photographic landscape - wildlife tours. Click for details!
SURFING THE JET STREAM REDUCES AVIATION RADIATION: Last weekend, British Airways Flight 112 made headlines when it flew from New York to London in less than 5 hours, smashing the speed record for subsonic flight. It did it by surfing the jet stream. The plane's early arrival had an unintended benefit: Passengers absorbed significantly fewer cosmic rays. Surfing the jet stream, it turns out, is a good way to manage aviation radiation: full story.
THE CHANGING SHAPE OF BETELGEUSE: Betelgeuse isn't just dimming, it's also changing shape. Today, the European Southern Observatory released new images of Betelgeuse from the Very Large Telescope (VLT) in Chile's Atacama desert. The unstable red supergiant is definitely lopsided:
A team led by Miguel Montargès of KU Leuven in Belgium took the picture in Dec. 2019, shortly after the star began its unprecedented dimming. They were able to compare it to a "normal" picture of Betelgeuse taken 11 months earlier. The change in shape is striking.
What's going on? The researchers aren't sure why Betelgeuse looks so different, but they suspect the involvement of dust. Red supergiants like Betelgeuse create and eject vast amounts of dusty material, losing mass even before they explode as supernovas. The lopsided shape and dimming of Betelgeuse might be explained if a cloud of dust is partially blocking its disk. Indeed, VLT infrared observations of Betelgeuse at the same time reveal lots of dust around the star.
Mystery solved? Not necessarily. "Our knowledge of red supergiants remains incomplete, and this is still a work in progress, so a surprise can still happen," notes Montargès. Other possibilities include magnetic activity on Betelgeuse's surface (such as a giant starspot) and, of course, the early stages of a supernova explosion.
The Very Large Telescope with its adaptive optics instruments is one of the few facilities in the world capable of imaging the surface of Betelgeuse, located more thann 600 light years away. More images from the Atacama desert may yet reveal what's happening--if Betelgeuse doesn't tell us first!
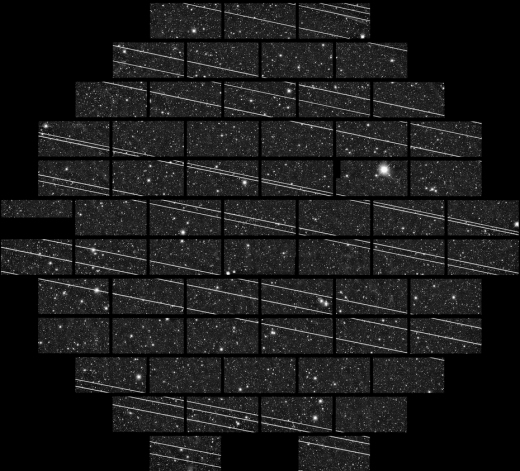
NEW IAU STATEMENT ON SATELLITE MEGA-CONSTELLATIONS: The night sky is in danger. This has been true for years as urban landscapes became increasingly light-polluted. But now there's a new threat, one you can't escape by driving into the countryside. It's the "mega-constellation." Some companies are planning to launch tens of thousands of internet satellites into low-Earth orbit. The recent launch by Space X of just 240 Starlink satellites has already ruined many astronomical observations.
Above: Astronomers at the Cerro Tololo Inter-American Observatory were trying to photograph nearby galaxies when 19 Starlink satellites intervened. [Full Story]
This week the International Astronomical Union (IAU) issued a new press release describing the impact of satellite mega-constellations on astronomy. IAU astronomers simulated 25,000 satellites similar in type to the satellites of SpaceX, Amazon, and OneWeb, and here are their results:
1. The number of satellites above the horizon at any given time would be between ~1500 and a few thousand. Most will appear very close to the horizon, with only a relative few passing directly overhead.
2. When the sun is 18 degrees below the horizon--that is, when the night becomes dark--the number of illuminated satellites above the horizon would be around 1000. These numbers will decrease during the hours around midnight when many satellites fall into Earth's shadow.
3. At the moment it is difficult to predict how many of the illuminated satellites will be visible to the naked eye because of uncertainties in their reflectivity. Probably, the vast majority will be too faint to see. This depends to some degree on experiments such as those being carried out by SpaceX to reduce the reflectivity of their satellites with different coatings.
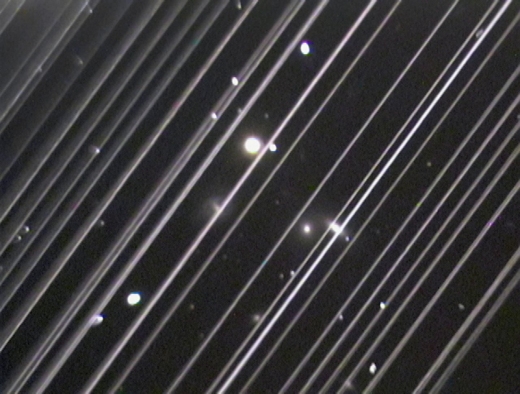
Above: Starlink satellites photobomb the NGC 5353/4 galaxy group at Lowell Observatory [more]
4. Even if most satellites are invisible to the naked eye, mega-constellations pose a serious problem for professional astronomy. The trails of these satellites are bright enough to saturate modern detectors on large telescopes, and wide-field scientific astronomical observations will be severely affected.
5. The Vera C. Rubin Observatory currently under construction in Chile will be particularly hard-hit. The innovative observatory will scan large swaths of the sky, looking for near-Earth asteroids, studying dark energy, and much more. According to the IAU, up to 30% of the 30-second images during twilight hours will be affected. In theory, the effects of the new satellites could be mitigated by accurately predicting their orbits and interrupting observations, when necessary, during their passage, but this is a burdensome procedure.
There are no international rules governing the brightness of orbiting manmade objects. Until now, they didn't seem to be necessary. Mega-constellations, however, threaten "the uncontaminated view of the night sky from dark places, which should be considered a non-renounceable world human heritage," says the press release. Therefore the IAU will present its findings at meetings of the UN Committee for Peaceful Uses of Outer Space, bringing the attention of this problem to world leaders.
VALENTINE'S GIFTS FROM THE EDGE OF SPACE: Today is Valentine's Day, and nothing says "I love you" like a gift from the edge of space. Everything in the Earth to Sky Store is 10% off:
Everything in the store has been flown to the stratosphere onboard cosmic ray balloons, which the students of Earth to Sky Calculus launch approximately once a week to monitor atmospheric radiation. All sales support our cosmic ray ballooning program and help launch young scientists into research careers through hands-on STEM education.
At checkout, be sure to enter the coupon code "ILOVESPACE"!
Every night, a network of NASA all-sky cameras scans the skies above the United States for meteoritic fireballs. Automated software maintained by NASA's Meteoroid Environment Office calculates their orbits, velocity, penetration depth in Earth's atmosphere and many other characteristics. Daily results are presented here on Spaceweather.com.
On Feb. 14, 2020, the network reported 3 fireballs. (3 sporadics)
In this diagram of the inner solar system, all of the fireball orbits intersect at a single point--Earth. The orbits are color-coded by velocity, from slow (red) to fast (blue). [Larger image] [movies]
Near Earth Asteroids
Potentially Hazardous Asteroids (PHAs) are space rocks larger than approximately 100m that can come closer to Earth than 0.05 AU. None of the known PHAs is on a collision course with our planet, although astronomers are finding new ones all the time.
On February 14, 2020 there were 2018 potentially hazardous asteroids.
Notes: LD means "Lunar Distance." 1 LD = 384,401 km, the distance between Earth and the Moon. 1 LD also equals 0.00256 AU. MAG is the visual magnitude of the asteroid on the date of closest approach.
Cosmic Rays in the Atmosphere
SOMETHING NEW! We have developed a new predictive model of aviation radiation. It's called E-RAD--short for Empirical RADiation model. We are constantly flying radiation sensors onboard airplanes over the US and and around the world, so far collecting more than 22,000 gps-tagged radiation measurements. Using this unique dataset, we can predict the dosage on any flight over the USA with an error no worse than 15%.
E-RAD lets us do something new: Every day we monitor approximately 1400 flights criss-crossing the 10 busiest routes in the continental USA. Typically, this includes more than 80,000 passengers per day. E-RAD calculates the radiation exposure for every single flight.
The Hot Flights Table is a daily summary of these calculations. It shows the 5 charter flights with the highest dose rates; the 5 commercial flights with the highest dose rates; 5 commercial flights with near-average dose rates; and the 5 commercial flights with the lowest dose rates. Passengers typically experience dose rates that are 20 to 70 times higher than natural radiation at sea level.
To measure radiation on airplanes, we use the same sensors we fly to the stratosphere onboard Earth to Sky Calculus cosmic ray balloons: neutron bubble chambers and X-ray/gamma-ray Geiger tubes sensitive to energies between 10 keV and 20 MeV. These energies span the range of medical X-ray machines and airport security scanners.
Column definitions: (1) The flight number; (2) The maximum dose rate during the flight, expressed in units of natural radiation at sea level; (3) The maximum altitude of the plane in feet above sea level; (4) Departure city; (5) Arrival city; (6) Duration of the flight.
SPACE WEATHER BALLOON DATA: Approximately once a week, Spaceweather.com and the students of Earth to Sky Calculus fly space weather balloons to the stratosphere over California. These balloons are equipped with radiation sensors that detect cosmic rays, a surprisingly "down to Earth" form of space weather. Cosmic rays can seed clouds, trigger lightning, and penetrate commercial airplanes. Furthermore, there are studies ( #1, #2, #3, #4) linking cosmic rays with cardiac arrhythmias and sudden cardiac death in the general population. Our latest measurements show that cosmic rays are intensifying, with an increase of more than 18% since 2015:
The data points in the graph above correspond to the peak of the Regener-Pfotzer maximum, which lies about 67,000 feet above central California. When cosmic rays crash into Earth's atmosphere, they produce a spray of secondary particles that is most intense at the entrance to the stratosphere. Physicists Eric Reneger and Georg Pfotzer discovered the maximum using balloons in the 1930s and it is what we are measuring today.
En route to the stratosphere, our sensors also pass through aviation altitudes:
In this plot, dose rates are expessed as multiples of sea level. For instance, we see that boarding a plane that flies at 25,000 feet exposes passengers to dose rates ~10x higher than sea level. At 40,000 feet, the multiplier is closer to 50x.
The radiation sensors onboard our helium balloons detect X-rays and gamma-rays in the energy range 10 keV to 20 MeV. These energies span the range of medical X-ray machines and airport security scanners.
Why are cosmic rays intensifying? The main reason is the sun. Solar storm clouds such as coronal mass ejections (CMEs) sweep aside cosmic rays when they pass by Earth. During Solar Maximum, CMEs are abundant and cosmic rays are held at bay. Now, however, the solar cycle is swinging toward Solar Minimum, allowing cosmic rays to return. Another reason could be the weakening of Earth's magnetic field, which helps protect us from deep-space radiation.
To find reviews of new online casino sites in the UK try The Casino DB where there are hundreds of online casino reviews complete with bonuses and ratings.
Get a bonus when playing at a new casino in the UK. The Genie got you covered!
Looking for a new online casino? Try Casimpo the new site dedicated to making online casino simple and easy for all.
These links help Spaceweather.com stay online. Thank you to our supporters!


