Spotless Days Current Stretch: 28 days 2019 total: 102 days (61%) 2018 total: 221 days (61%) 2017 total: 104 days (28%) 2016 total: 32 days (9%) 2015 total: 0 days (0%) 2014 total: 1 day (<1%) 2013 total: 0 days (0%) 2012 total: 0 days (0%) 2011 total: 2 days (<1%) 2010 total: 51 days (14%) 2009 total: 260 days (71%) 2008 total: 268 days (73%) 2007 total: 152 days (42%) 2006 total: 70 days (19%) Updated 16 Jun 2019
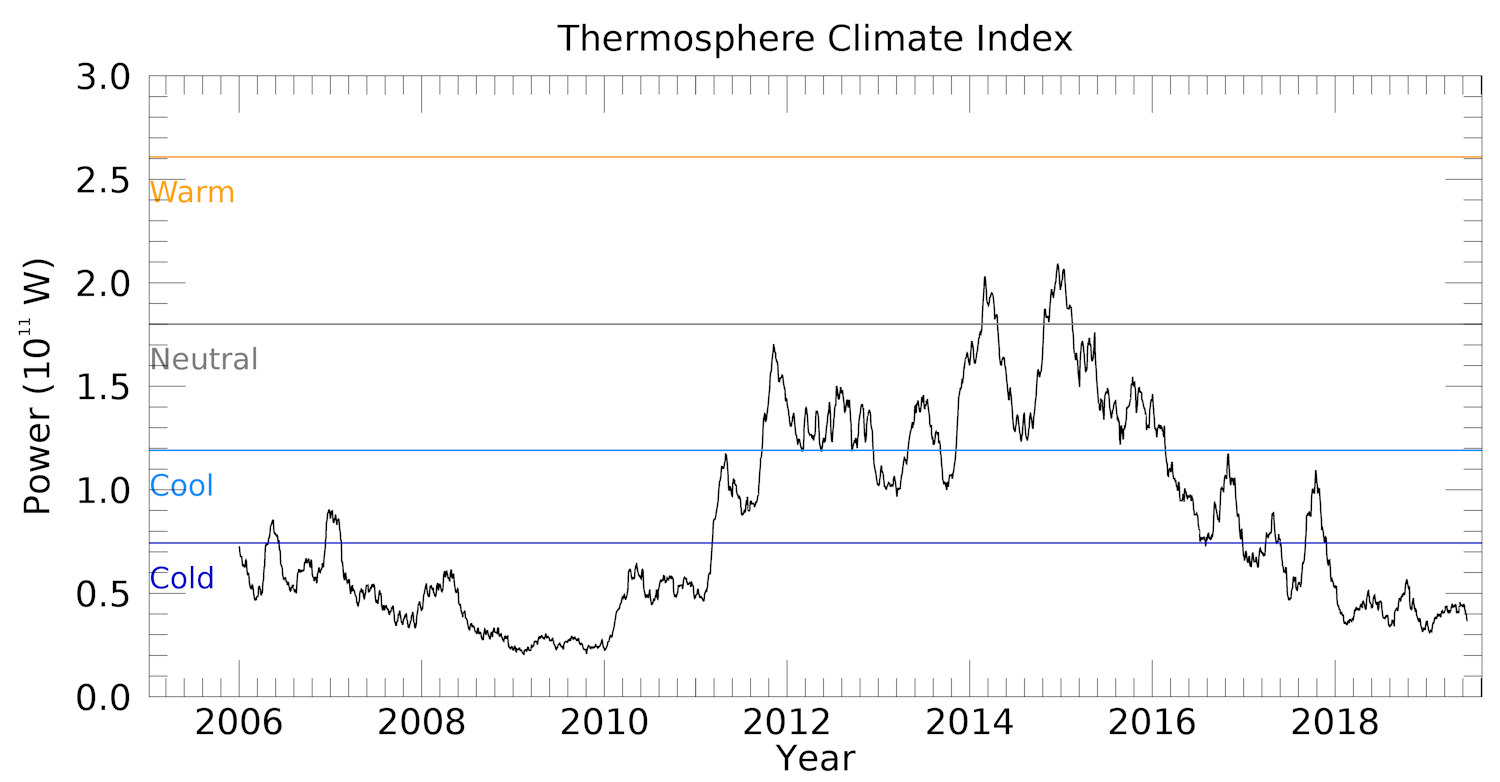
Thermosphere Climate Index today: 3.56x10¹⁰W Cold Max: 49.4x10¹⁰ W Hot (10/1957) Min: 2.05x10¹⁰W Cold (02/2009) explanation | more data Updated 16 Jun 2019
Planetary K-index Now: Kp= 0 quiet 24-hr max: Kp= 2 quiet explanation | more data
Interplanetary Mag. Field Btotal: 2.5 nT Bz: -0.3 nT south more data: ACE, DSCOVR Updated: Today at 2353 UT
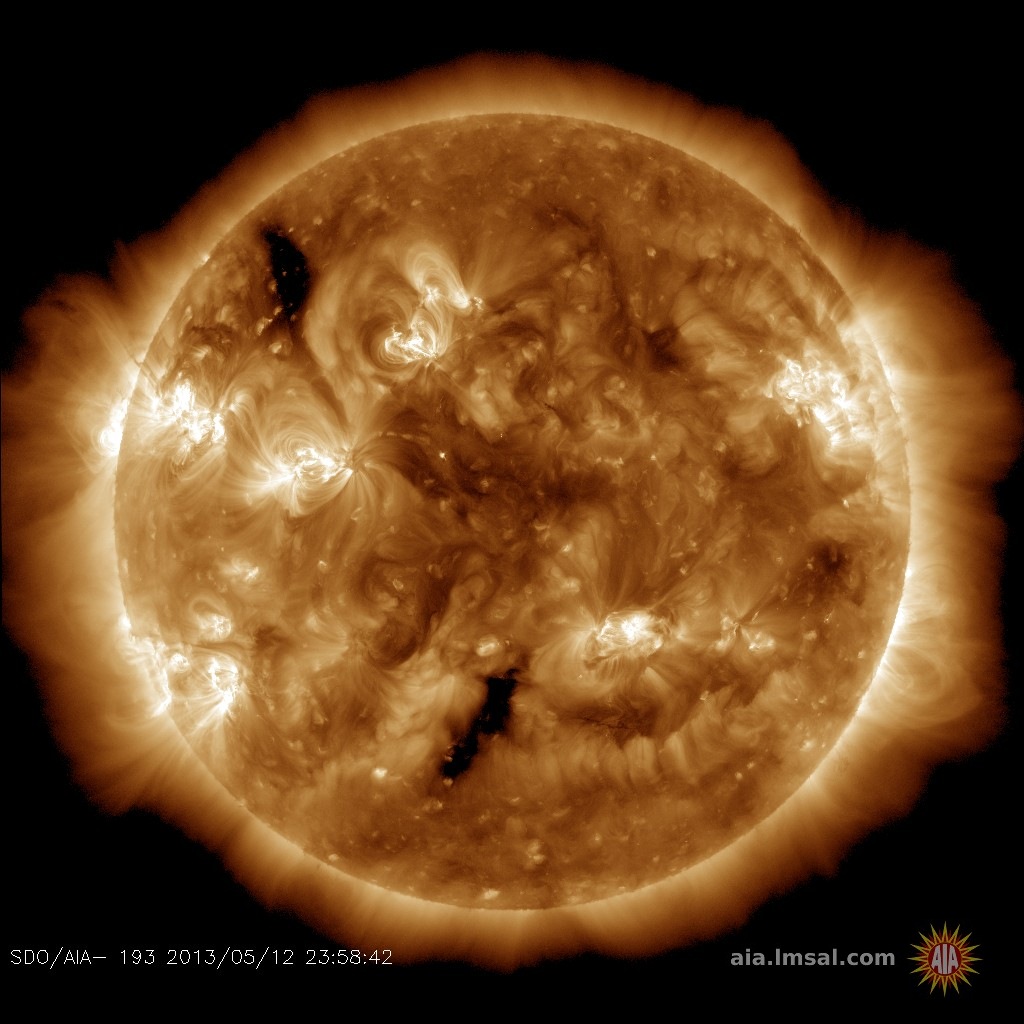
Coronal Holes: 16 Jun 19
Solar wind flowing from this large coronal hole could buffet Earth's magnetic field on June 18-19. Credit: SDO/AIA
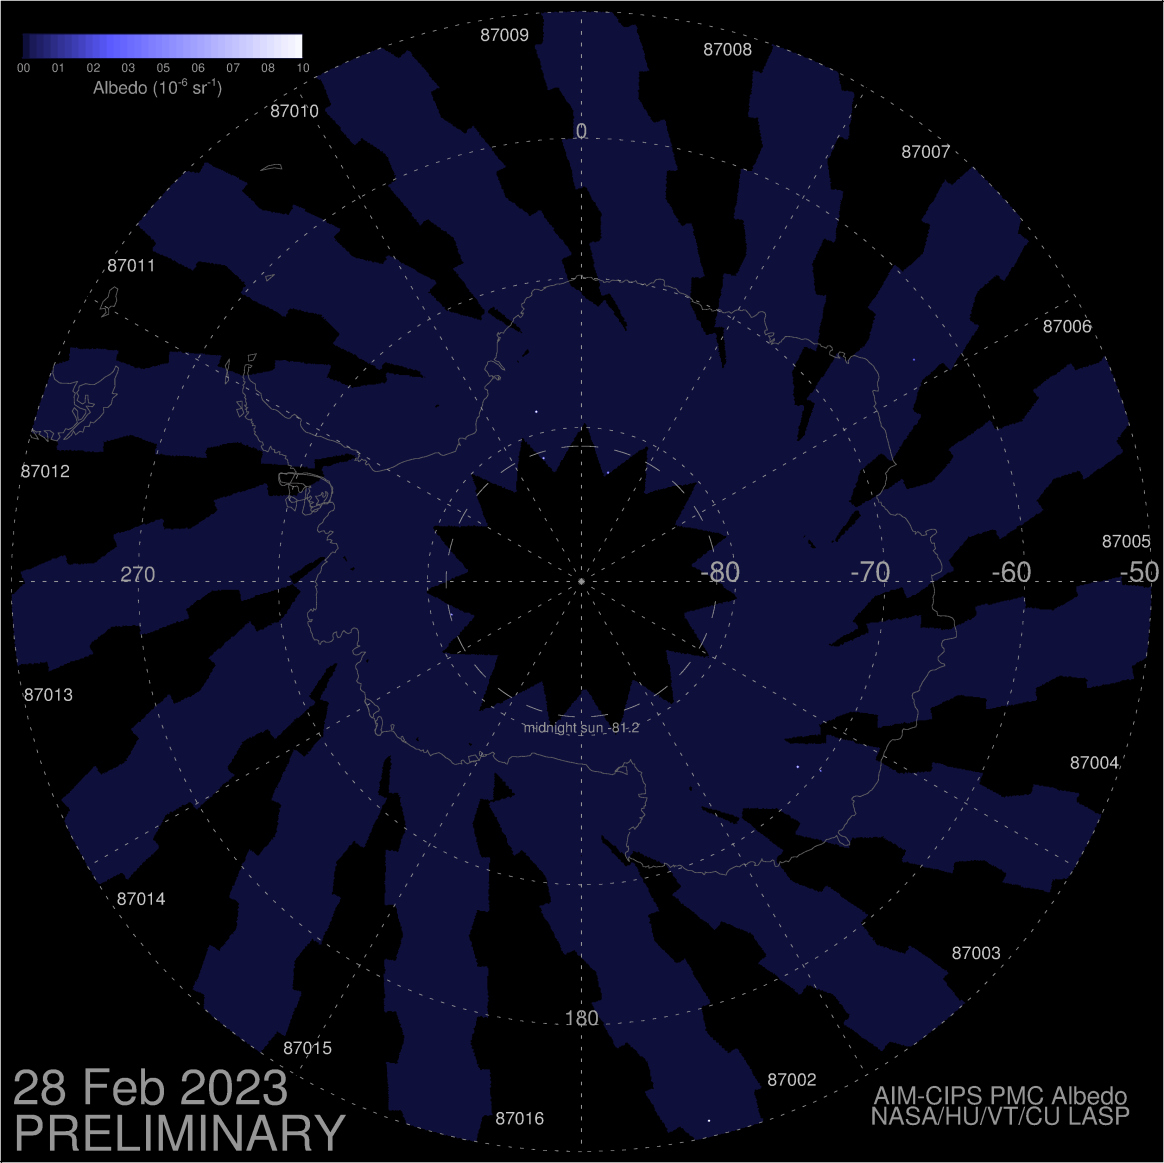
Noctilucent CloudsThe northern season for noctilicent clouds is underway. Monitor the daily images from NASA's AIM spacecraft to see how the clouds spread around the Arctic Circle as northern summer unfolds.
Geomagnetic Storms: Probabilities for significant disturbances in Earth's magnetic field are given for three activity levels: active, minor storm, severe storm
Updated at: 2019 Jun 16 2200 UTC
Mid-latitudes
0-24 hr
24-48 hr
ACTIVE
25 %
25 %
MINOR
05 %
05 %
SEVERE
01 %
01 %
High latitudes
0-24 hr
24-48 hr
ACTIVE
20 %
20 %
MINOR
30 %
30 %
SEVERE
25 %
25 %
Sunday, Jun. 16, 2019
What's up in space
Solar minimum is here - but even now strangely beautiful auroras are dancing around the poles. Deep inside the Arctic Circle, the expert guides of Aurora Holidays in Utsjoki, Finland, can help you chase them. Book now!
AURORA AUSTRALIS WATCH: Earth's magnetic field could become unsettled on June 18th and 19th when an incoming stream of solar wind reaches our planet. The gaseous material is flowing from a large hole in the sun's atmosphere. Polar sky watchers should be alert for auroras, especially in the southern hemisphere where winter darkness favors their visibility. Aurora alerts: SMS Text.
RED SPRITES AT THE EDGE OF SPACE: We all know what comes out of the bottom of thunderclouds: lightning. But what comes out of the top? Red sprites. High above Earth on May 10th, astronauts onboard the International Space Station watched a cluster of the red forms explode from the top of a powerful thunderstorm located between Los Angeles and Las Vegas:
Spaceweather.com reader Frankie Lucena of Cabo Rojo, Puerto Rico, noticed the sprites in a time lapse video of lightning NASA released last week. "The space station was over California and traveling northeast when they took the picture," notes Lucena.
The photo shows how high sprites can go, reaching all the way from the thunderstorm to a layer of green airglow 100 km above Earth's surface. This means sprites touch the edge of space, alongside auroras, meteors and noctilucent clouds. They are a true space weather phenomenon.
Solar Minimum may be boosting sprites. During this phase of the solar cycle, cosmic rays from deep space penetrate Earth's atmosphere more than usual--a result of the sun's weakening magnetic field. Some researchers believe that cosmic rays may provide the ionizing "spark" that triggers many sprites. If so, stay tuned for more as Solar Minimum deepens.
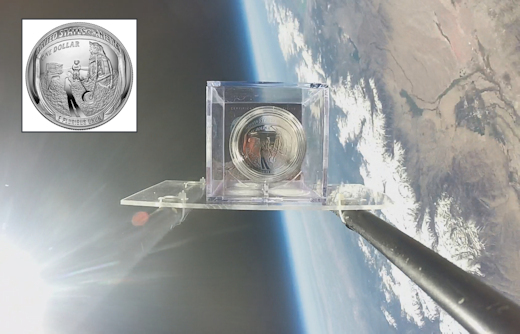
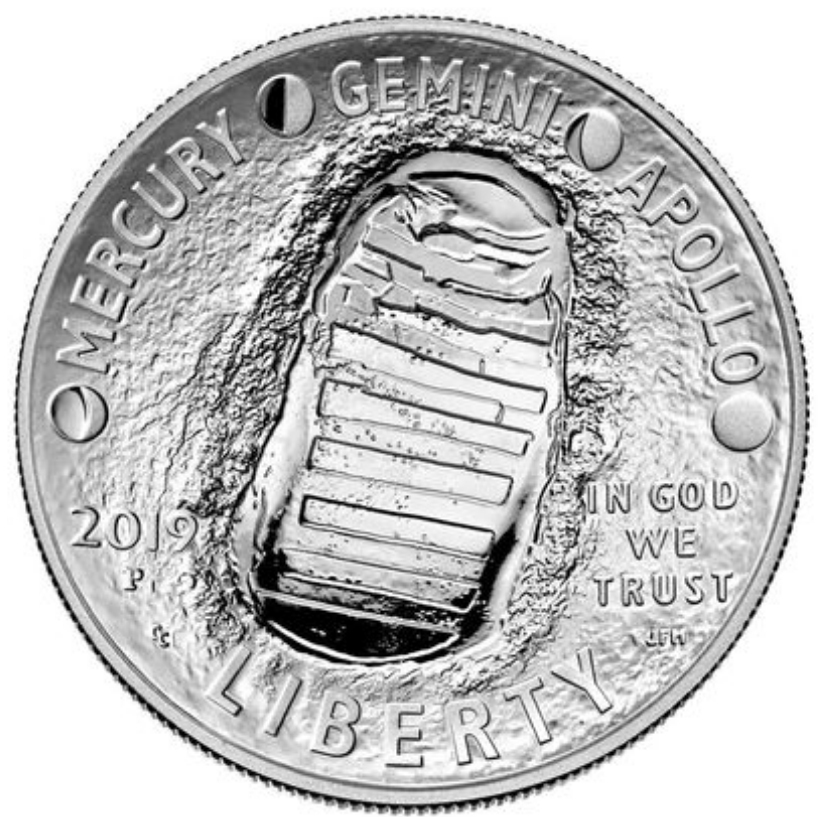
APOLLO 11 PROOF SILVER DOLLAR: To celebrate the 50th anniversary of the Apollo 11 Moon landing, the United States Mint has created a commemorative 2019 Proof Silver Dollar. We decided to celebrate even more by flying the coins to the edge of space. On June 8th, the students of Earth to Sky Calculus launched this 99.9% silver dollar 111,222 feet above Earth's surface:
You can have it for $179.95. The students are selling the coins to support their cosmic ray ballooning program. The silver dollar is curved and reproduces the helmet of astronaut Buzz Aldrin. Reflected in Buzz's visor are Neil Armstrong, the United States flag, and the lunar lander. The opposite side of the coin shows Neil's first footprint on the Moon. Each of these coins comes with a greeting card showing the item in flight and a certificate of authenticity.
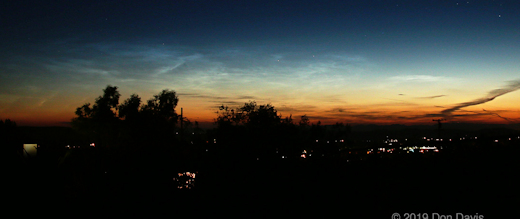
RECORD-SETTING NOCTILUCENT CLOUDS: If you've never seen a cloud of frosted meteor smoke, now is the time to look. 2019 is shaping up to be the best year for noctilucent clouds (NLCs) ... maybe ever. Normally confined to near-Arctic latitudes, NLCs have been seen this month in most US states. On Friday morning, June 14th, Don Davis saw them, astonishingly, from the city of Joshua Tree not far from Los Angeles CA:
Noctilucent clouds over Joshua Tree CA on June 14, 2019
"They were dim but distinct," says Davis. "I photographed them easily using a 4 second exposure at ISO 400."
Davis's sighting at +34.1 degrees sets the record for low-latitude observations of NLCs, breaking the previous record set only five days earlier by Brian Guyer at the National Weather Service in Albuquerque, New Mexico (+35.1 degrees).
"I'm shocked to report that I saw the noctilucent clouds while venturing outdoors for a weather observation shortly after sunset," says Guyer, who is a senior meteorologist. "When I noticed the faint blue wavy tendrils far off to the north, I asked myself, 'am I really seeing noctilucent clouds from here?' I'm happy to see that other folks are also seeing these beautiful spectacles of nature at lower latitudes."
Noctilucent clouds form every year when wisps of summertime water vapor rise to the top of Earth's atmosphere and crystallize around specks of meteor smoke. The season typically starts in late May, peaks in July, and peters out in August. If NLCs are being seen in California and New Mexico in June, the season's peak in early July could be very special indeed.
Noctilucent clouds have been creeping south for years--a possible result of climate change and/or the solar cycle. 2019 has broken all the old records for southern sightings, bringing the clouds into the mainstream of mid- to low-latitude sky watching. Now everyone should be alert for NLCs.
Observing tips: Look west 30 to 60 minutes after sunset (or before sunrise) when the sun is just below the horizon. If you see luminous blue-white tendrils spreading across the sky, you may have spotted a noctilucent cloud.
Every night, a network of NASA all-sky cameras scans the skies above the United States for meteoritic fireballs. Automated software maintained by NASA's Meteoroid Environment Office calculates their orbits, velocity, penetration depth in Earth's atmosphere and many other characteristics. Daily results are presented here on Spaceweather.com.
On Jun. 16, 2019, the network reported 4 fireballs. (4 sporadics)
In this diagram of the inner solar system, all of the fireball orbits intersect at a single point--Earth. The orbits are color-coded by velocity, from slow (red) to fast (blue). [Larger image] [movies]
Near Earth Asteroids
Potentially Hazardous Asteroids (PHAs) are space rocks larger than approximately 100m that can come closer to Earth than 0.05 AU. None of the known PHAs is on a collision course with our planet, although astronomers are finding new ones all the time.
On June 16, 2019 there were 1983 potentially hazardous asteroids.
Notes: LD means "Lunar Distance." 1 LD = 384,401 km, the distance between Earth and the Moon. 1 LD also equals 0.00256 AU. MAG is the visual magnitude of the asteroid on the date of closest approach.
Cosmic Rays in the Atmosphere
SOMETHING NEW! We have developed a new predictive model of aviation radiation. It's called E-RAD--short for Empirical RADiation model. We are constantly flying radiation sensors onboard airplanes over the US and and around the world, so far collecting more than 22,000 gps-tagged radiation measurements. Using this unique dataset, we can predict the dosage on any flight over the USA with an error no worse than 15%.
E-RAD lets us do something new: Every day we monitor approximately 1400 flights criss-crossing the 10 busiest routes in the continental USA. Typically, this includes more than 80,000 passengers per day. E-RAD calculates the radiation exposure for every single flight.
The Hot Flights Table is a daily summary of these calculations. It shows the 5 charter flights with the highest dose rates; the 5 commercial flights with the highest dose rates; 5 commercial flights with near-average dose rates; and the 5 commercial flights with the lowest dose rates. Passengers typically experience dose rates that are 20 to 70 times higher than natural radiation at sea level.
To measure radiation on airplanes, we use the same sensors we fly to the stratosphere onboard Earth to Sky Calculus cosmic ray balloons: neutron bubble chambers and X-ray/gamma-ray Geiger tubes sensitive to energies between 10 keV and 20 MeV. These energies span the range of medical X-ray machines and airport security scanners.
Column definitions: (1) The flight number; (2) The maximum dose rate during the flight, expressed in units of natural radiation at sea level; (3) The maximum altitude of the plane in feet above sea level; (4) Departure city; (5) Arrival city; (6) Duration of the flight.
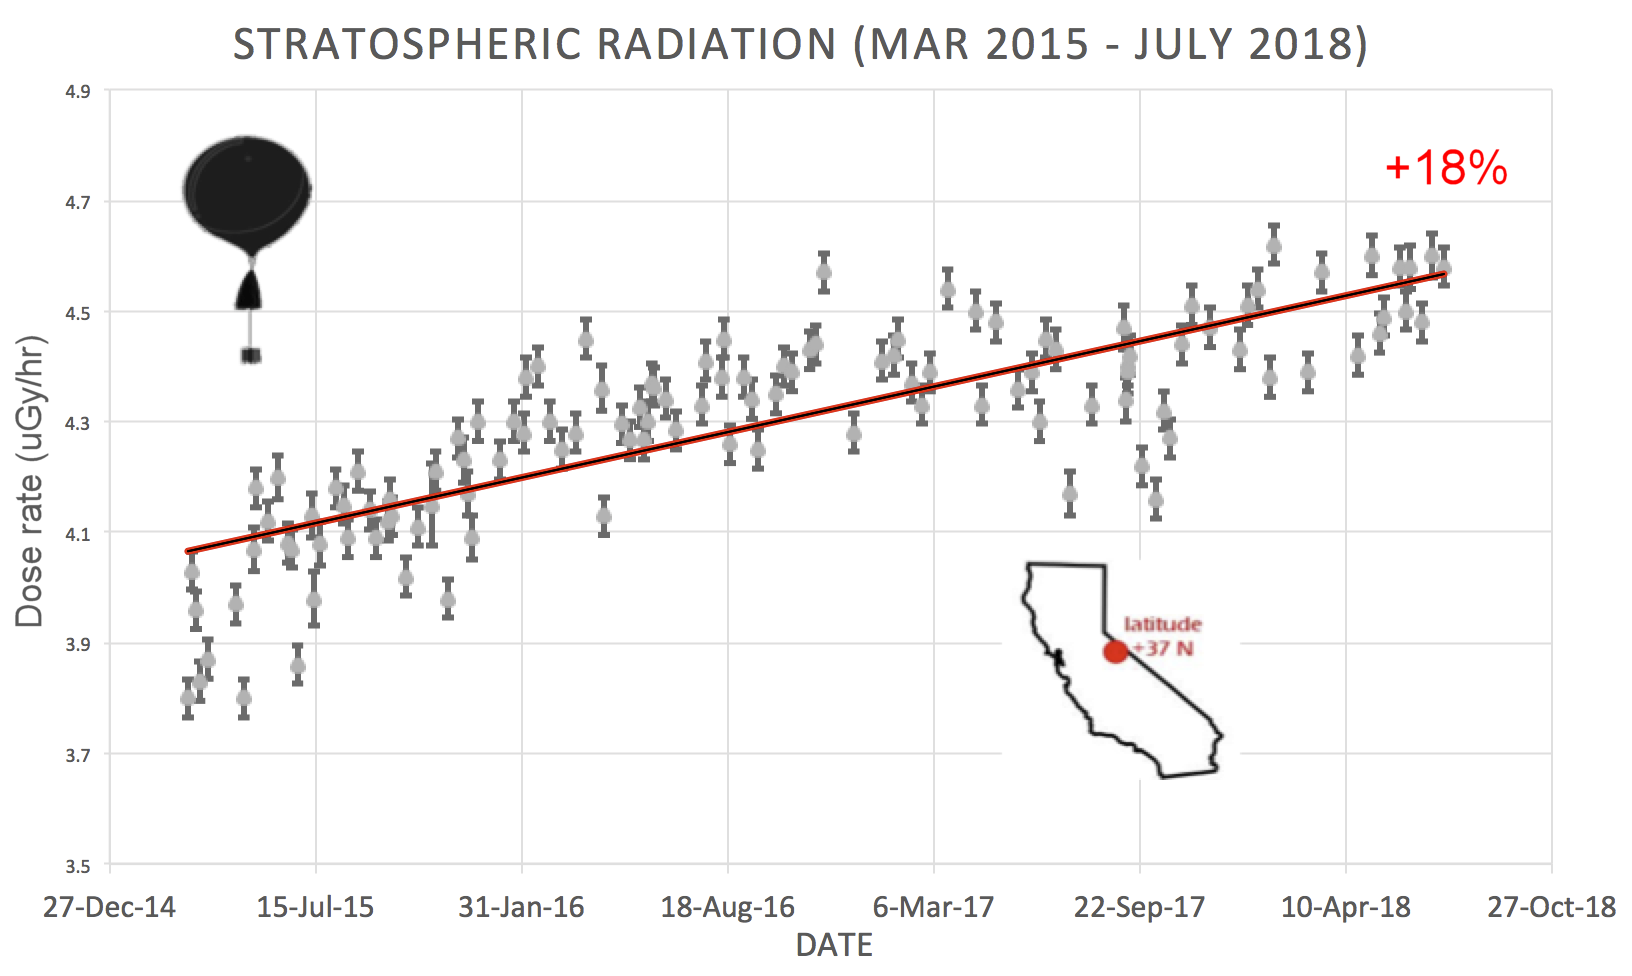
SPACE WEATHER BALLOON DATA: Approximately once a week, Spaceweather.com and the students of Earth to Sky Calculus fly space weather balloons to the stratosphere over California. These balloons are equipped with radiation sensors that detect cosmic rays, a surprisingly "down to Earth" form of space weather. Cosmic rays can seed clouds, trigger lightning, and penetrate commercial airplanes. Furthermore, there are studies ( #1, #2, #3, #4) linking cosmic rays with cardiac arrhythmias and sudden cardiac death in the general population. Our latest measurements show that cosmic rays are intensifying, with an increase of more than 18% since 2015:
The data points in the graph above correspond to the peak of the Reneger-Pfotzer maximum, which lies about 67,000 feet above central California. When cosmic rays crash into Earth's atmosphere, they produce a spray of secondary particles that is most intense at the entrance to the stratosphere. Physicists Eric Reneger and Georg Pfotzer discovered the maximum using balloons in the 1930s and it is what we are measuring today.
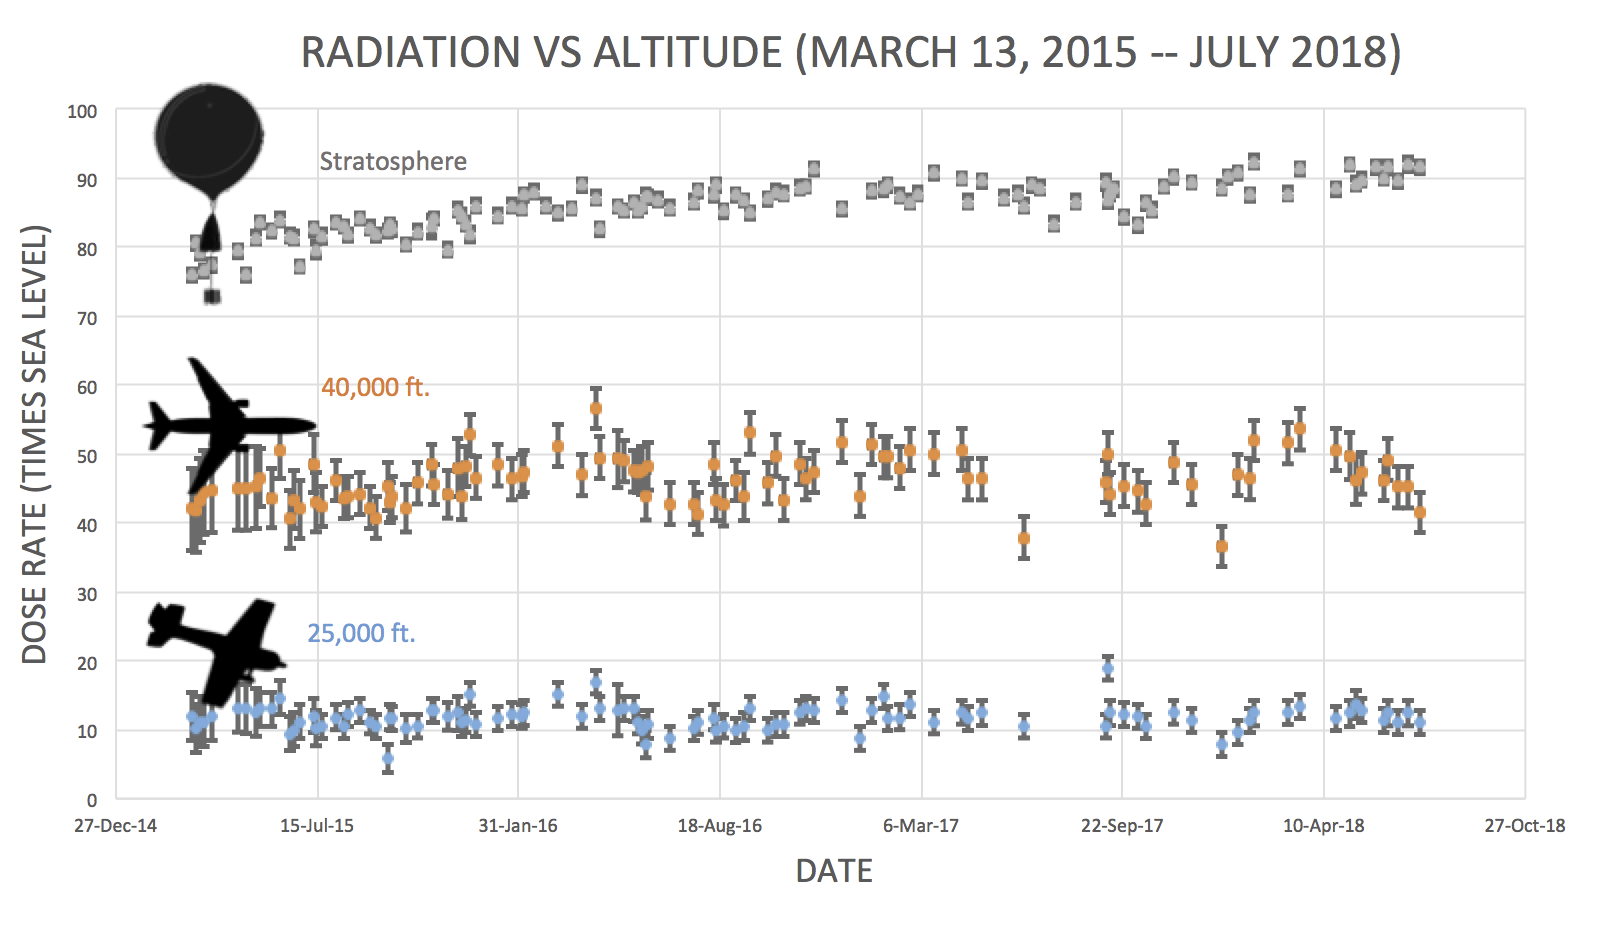
En route to the stratosphere, our sensors also pass through aviation altitudes:
In this plot, dose rates are expessed as multiples of sea level. For instance, we see that boarding a plane that flies at 25,000 feet exposes passengers to dose rates ~10x higher than sea level. At 40,000 feet, the multiplier is closer to 50x.
The radiation sensors onboard our helium balloons detect X-rays and gamma-rays in the energy range 10 keV to 20 MeV. These energies span the range of medical X-ray machines and airport security scanners.
Why are cosmic rays intensifying? The main reason is the sun. Solar storm clouds such as coronal mass ejections (CMEs) sweep aside cosmic rays when they pass by Earth. During Solar Maximum, CMEs are abundant and cosmic rays are held at bay. Now, however, the solar cycle is swinging toward Solar Minimum, allowing cosmic rays to return. Another reason could be the weakening of Earth's magnetic field, which helps protect us from deep-space radiation.
To find reviews of new online casino sites in the UK try The Casino DB where there are hundreds of online casino reviews complete with bonuses and ratings.
Looking for a new online casino? Try Casimpo the new site dedicated to making online casino simple and easy for all.
These links help Spaceweather.com stay online. Thank you to our supporters!


