Lights Over lapland is excited to announce that Autumn Aurora Adventures are available for immediate booking! Reserve your adventure of a lifetime in Abisko National Park, Sweden today! | | |
THE SUN IS FLATLINING: Lonely sunspot AR2664 is decaying and no longer poses a threat for even minor explosions. As a result, the sun's X-ray output is low and flatlining. NOAA forecasters say the chance of a strong solar flare on June 28th is no more than 1%. Free: Aurora Alerts
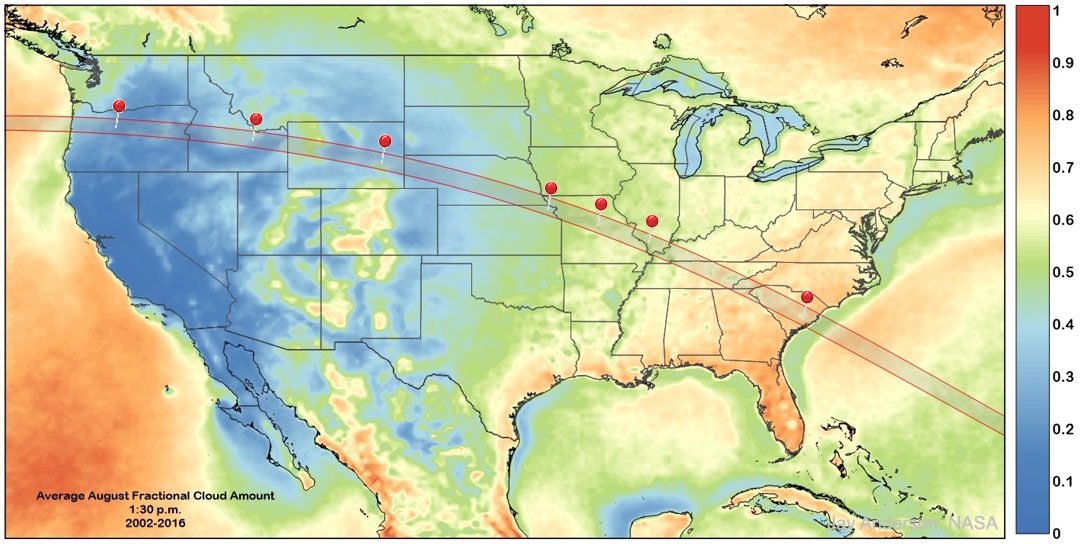
WHERE WILL YOU BE ON AUG. 21, 2017? The Great American Solar Eclipse is less than two months away. Do you know where you will be? The map below shows the path of totality (the narrow zone where the Moon completely covers the sun) overlaid on a statistical map of cloudiness for the month of August. The best places to be are blue:
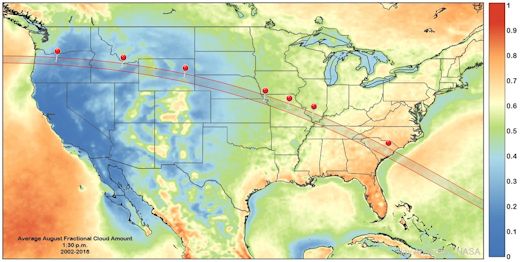
Canadian meteorologist Jay Anderson and colleague Jennifer West made the map based on data from NASA's Terra and Aqua satellites. It shows that people in western states, where fractional cloud cover dips as low as 15%, are most likely to witness the precious two and a half minutes of totality. Overcast is more of a problem east of Missouri. As the Moon's shadow approaches the Atlantic Coast of the USA, there is a better than 50% chance that it will be hitting the tops of clouds instead of the landscape below.
Pushpins in the map show confirmed launch sites for the our Solar Eclipse Balloon Network. Using space weather balloons, teams of student researchers will launch cameras to the stratosphere for a unique view of the eclipse high above any obscuring clouds. There's more to their mission, however, than photography: Each balloon will also be equipped with an array of cosmic ray sensors. By the time the eclipse is finished, we will have gained a snapshot of how deep-space radiation is penetrating Earth's atmosphere across the entirety of North America. Want to join us? Click here.
Realtime Solar Eclipse Photo Gallery
SUNSET RAINBOW: On June 25th, Brad Timerson of Newark NY stepped outside after a brief rain shower and witnessed a remarkably tall--and remarkably red--rainbow. "It was about as big as a rainbow can be," marveled Timerson. "I had to use my iPhone in panorama mode to catch it all."
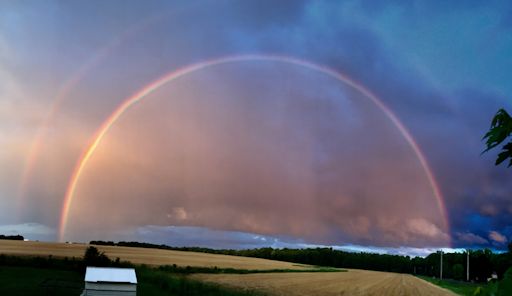
What made this rainbow so tall? And so red? The answer to both questions is the sunset. Atmospheric optics expert Les Cowley explains:
"Sunset rainbows ride high in the sky because their centers are exactly opposite the sun. Like a see-saw, the lower the sun, the higher is the bow. Sunset light making up the 'bow is highly reddened by its long travel through the lower atmosphere where air and dust preferentially scatter away blues and greens."
"Timerson's 'bow shows something more, that rainbows are disks with colored rims," adds Cowley. "When you next see a bow, look for the contrast between the bright sky inside and the dark of Alexanders dark band immediately outside."
Realtime Space Weather Photo Gallery
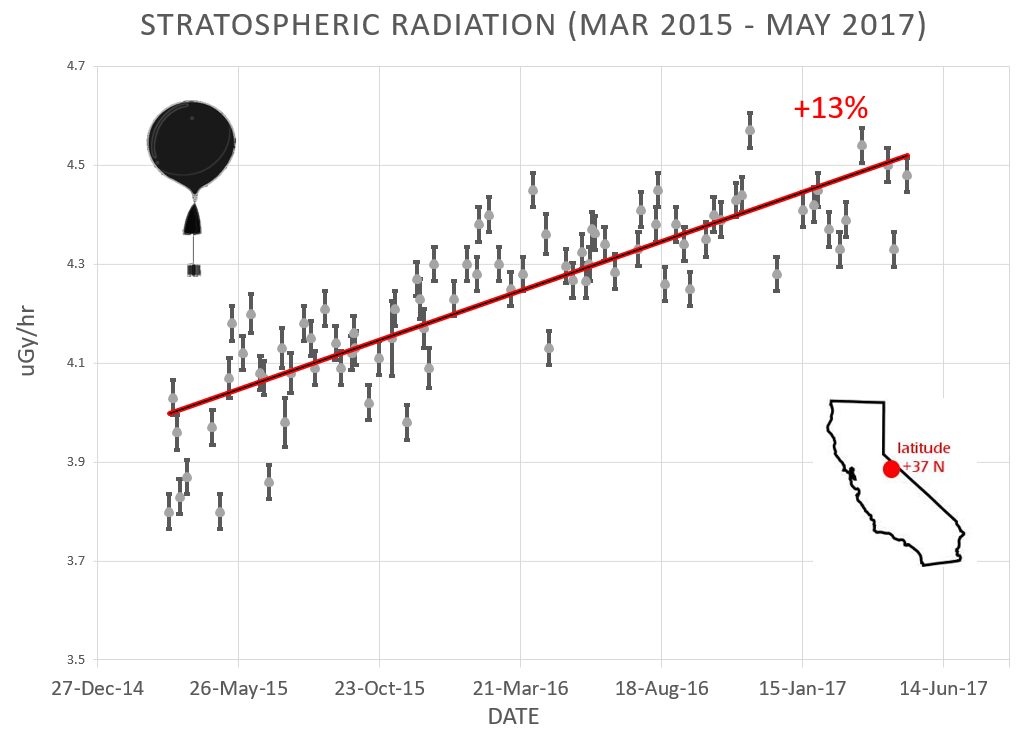
NEW ATMOSPHERIC RADIATION RESULTS: For the past two+ years, Spaceweather.com and the students of Earth to Sky Calculus have been monitoring cosmic rays in the atmosphere above California using high-altitude space weather balloons. After more than 100 flights, they find that dose rates have increased over the Golden State by 13% since March 2015.
Now we know the same thing is happening over New England--only more so.
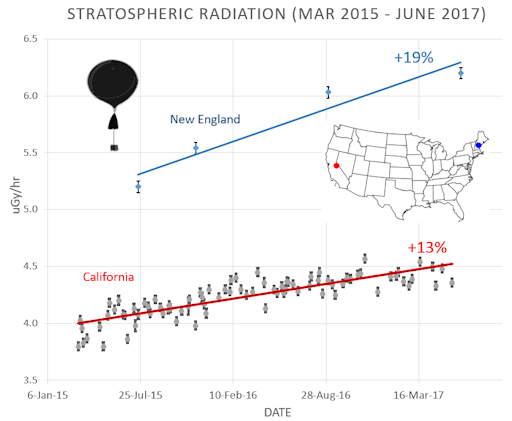
The Earth to Sky team has flown balloons over Maine and New Hampshire four times since 2015, most recently on June 15, 2017. Although the data are relatively sparse compared to the better-sampled west coast, the results are clear. Radiation in the stratosphere over the northeastern corner of the USA is not only stronger than California, but also intensifying much faster--a 19% increase in New England vs. 13% in California.
What's happening? Generally speaking, cosmic rays are increasing throughout the entire solar system. This is because of the sunspot cycle. The sun is currently plunging toward a deep Solar Minimum. As it descends, the sun's weakening magnetic field and flagging solar wind provides less and less shielding against high-energy particles from deep space. Every planet in the Solar System is getting an extra dose.
The difference we see between California and New England is telling us something local about Earth. After the sun's magnetosphere deflects many cosmic rays, Earth's magnetic field and atmosphere provide another line of defense. Our data show that central California is better defended by geomagnetism than New England.
Cosmic rays penetrate commercial airlines, dosing passengers and flight crews enough that pilots are classified as occupational radiation workers. Some research shows that cosmic rays can seed clouds and trigger lightning, potentially altering weather and climate. Furthermore, there are studies ( #1, #2, #3, #4) linking cosmic rays with cardiac arrhythmias in the general population.
Far Out Gifts: Earth to Sky Store
All proceeds support hands-on STEM education
Realtime Aurora Photo Gallery
Realtime Noctilucent Cloud Photo Gallery
Every night, a network of
NASA all-sky cameras scans the skies above the United States for meteoritic fireballs. Automated software maintained by NASA's Meteoroid Environment Office calculates their orbits, velocity, penetration depth in Earth's atmosphere and many other characteristics. Daily results are presented here on Spaceweather.com.
On Jun. 28, 2017, the network reported 15 fireballs.
(15 sporadics)
In this diagram of the inner solar system, all of the fireball orbits intersect at a single point--Earth. The orbits are color-coded by velocity, from slow (red) to fast (blue). [Larger image] [movies]
Potentially Hazardous Asteroids (
PHAs) are space rocks larger than approximately 100m that can come closer to Earth than 0.05 AU. None of the known PHAs is on a collision course with our planet, although astronomers are finding
new ones all the time.
On June 28, 2017 there were 1803 potentially hazardous asteroids.
 |
Recent & Upcoming Earth-asteroid encounters: | Asteroid | Date(UT) | Miss Distance | Velocity (km/s) | Diameter (m) |
| 441987 | 2017-Jun-24 | 7.9 LD | 12.7 | 178 |
| 2017 MA3 | 2017-Jun-27 | 3.2 LD | 9.3 | 16 |
| 2017 MB3 | 2017-Jun-30 | 5 LD | 6.4 | 31 |
| 2017 MC1 | 2017-Jun-30 | 2.5 LD | 11.6 | 44 |
| 2017 MC3 | 2017-Jul-02 | 6.5 LD | 13.2 | 52 |
| 2017 ME4 | 2017-Jul-03 | 5.4 LD | 6.8 | 20 |
| 2017 MC4 | 2017-Jul-11 | 7.6 LD | 20.6 | 154 |
| 2017 BS5 | 2017-Jul-23 | 3.1 LD | 5.8 | 54 |
| 2014 OA339 | 2017-Aug-13 | 12.3 LD | 10 | 47 |
Notes: LD means "Lunar Distance." 1 LD = 384,401 km, the distance between Earth and the Moon. 1 LD also equals 0.00256 AU. MAG is the visual magnitude of the asteroid on the date of closest approach. | | Cosmic Rays in the Atmosphere |
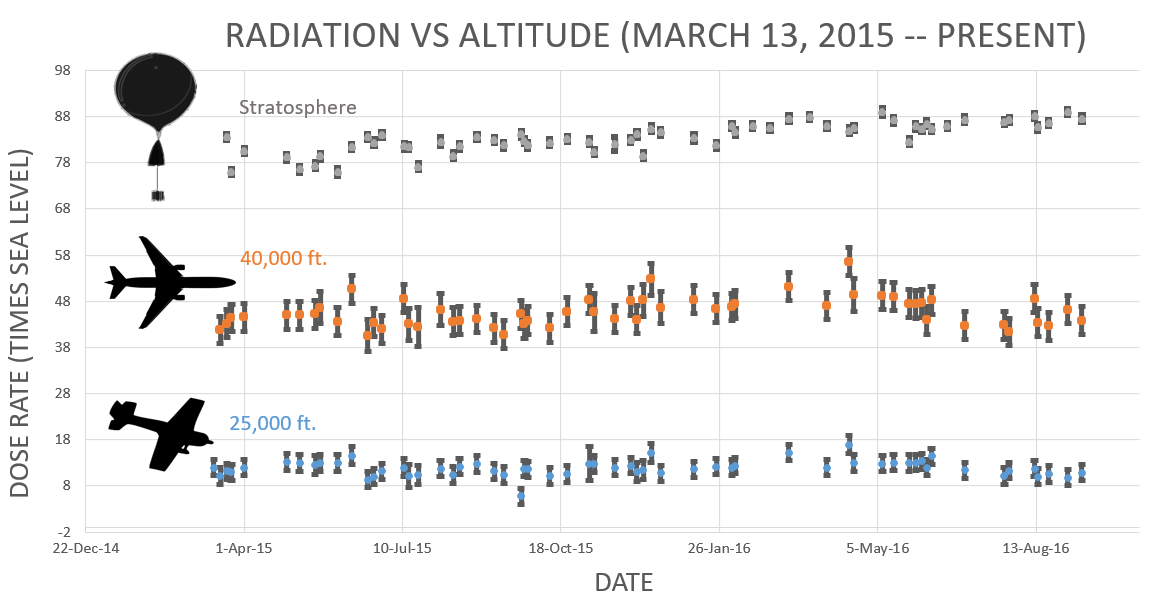
Readers, thank you for your patience while we continue to develop this new section of Spaceweather.com. We've been working to streamline our data reduction, allowing us to post results from balloon flights much more rapidly, and we have developed a new data product, shown here:

This plot displays radiation measurements not only in the stratosphere, but also at aviation altitudes. Dose rates are expessed as multiples of sea level. For instance, we see that boarding a plane that flies at 25,000 feet exposes passengers to dose rates ~10x higher than sea level. At 40,000 feet, the multiplier is closer to 50x. These measurements are made by our usual cosmic ray payload as it passes through aviation altitudes en route to the stratosphere over California.
What is this all about? Approximately once a week, Spaceweather.com and the students of Earth to Sky Calculus fly space weather balloons to the stratosphere over California. These balloons are equipped with radiation sensors that detect cosmic rays, a surprisingly "down to Earth" form of space weather. Cosmic rays can seed clouds, trigger lightning, and penetrate commercial airplanes. Furthermore, there are studies ( #1, #2, #3, #4) linking cosmic rays with cardiac arrhythmias and sudden cardiac death in the general population. Our latest measurements show that cosmic rays are intensifying, with an increase of more than 13% since 2015:
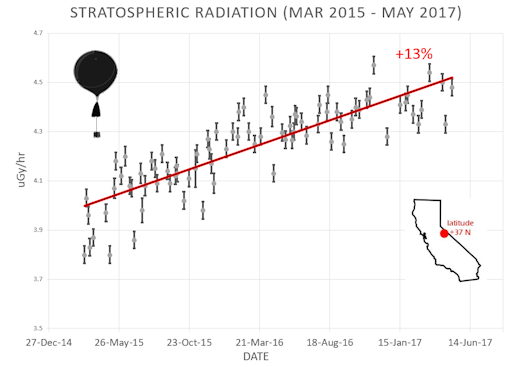
Why are cosmic rays intensifying? The main reason is the sun. Solar storm clouds such as coronal mass ejections (CMEs) sweep aside cosmic rays when they pass by Earth. During Solar Maximum, CMEs are abundant and cosmic rays are held at bay. Now, however, the solar cycle is swinging toward Solar Minimum, allowing cosmic rays to return. Another reason could be the weakening of Earth's magnetic field, which helps protect us from deep-space radiation.
The radiation sensors onboard our helium balloons detect X-rays and gamma-rays in the energy range 10 keV to 20 MeV. These energies span the range of medical X-ray machines and airport security scanners.
The data points in the graph above correspond to the peak of the Reneger-Pfotzer maximum, which lies about 67,000 feet above central California. When cosmic rays crash into Earth's atmosphere, they produce a spray of secondary particles that is most intense at the entrance to the stratosphere. Physicists Eric Reneger and Georg Pfotzer discovered the maximum using balloons in the 1930s and it is what we are measuring today.
| | The official U.S. government space weather bureau |
| | The first place to look for information about sundogs, pillars, rainbows and related phenomena. |
| | Researchers call it a "Hubble for the sun." SDO is the most advanced solar observatory ever. |
| | 3D views of the sun from NASA's Solar and Terrestrial Relations Observatory |
| | Realtime and archival images of the Sun from SOHO. |
| | from the NOAA Space Environment Center |
| | a proud supporter of science education and Spaceweather.com |
| | fun to read, but should be taken with a grain of salt! Forecasts looking ahead more than a few days are often wrong. |
| | from the NOAA Space Environment Center |
| | the underlying science of space weather |
 | Beautyz for top beauty products reviews and their buying guides |
| Reviews here can help you to pick up best memory foam mattresses. |
| | These links help Spaceweather.com stay online. Thank you to our supporters! |
| | | | | | |


