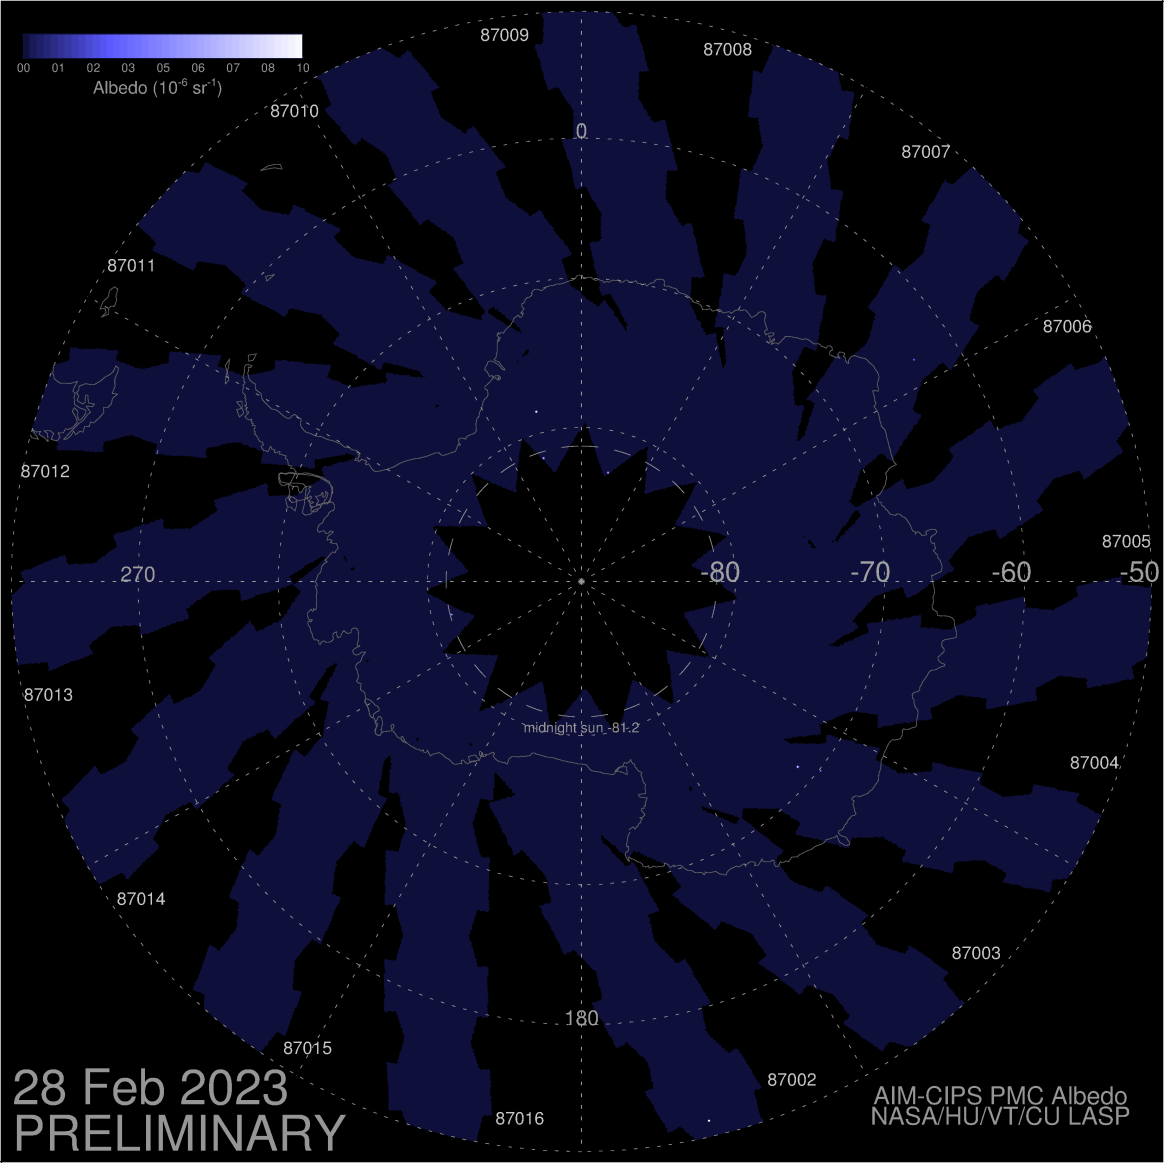
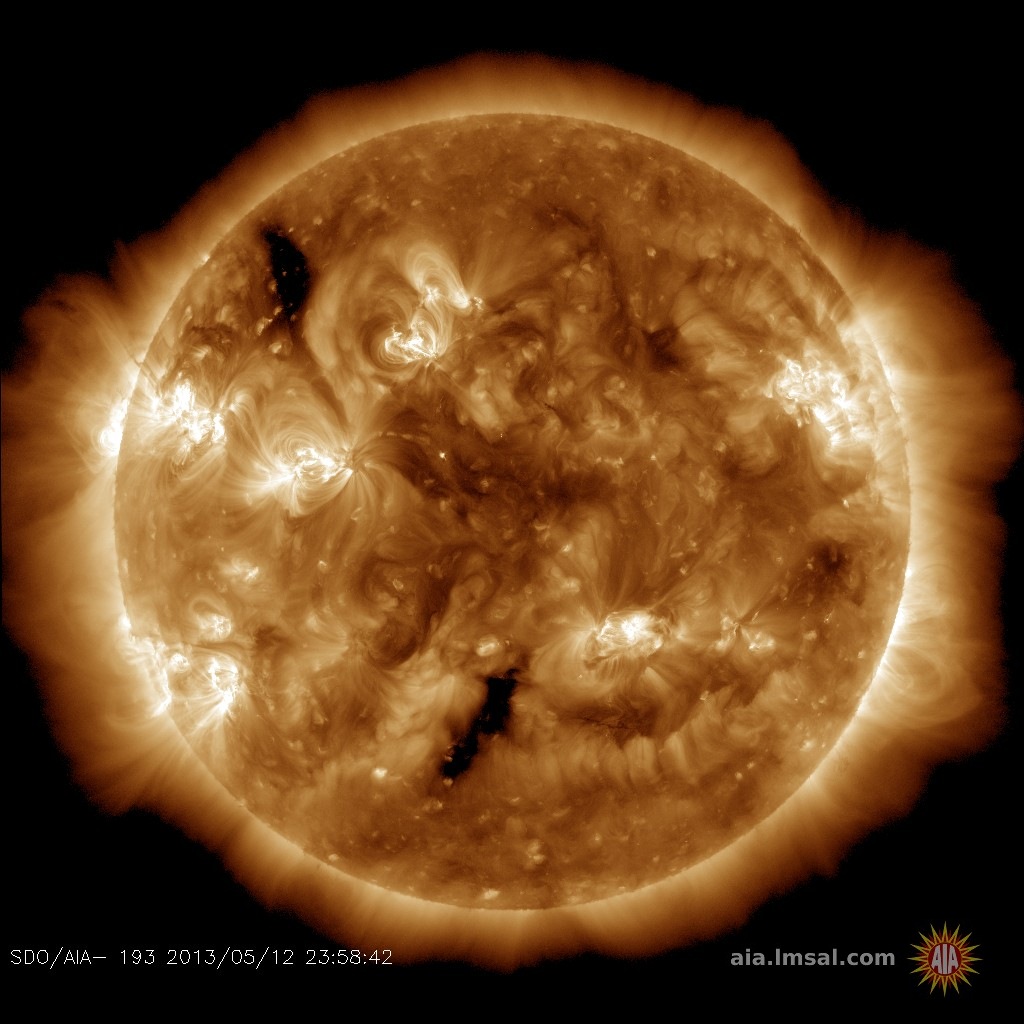
Directly under the Arctic Circle! Marianne's Arctic Xpress in Tromsø offers fjord, whale and wildlife tours by day, aurora tours by night. Book Now and get a 10% discount on combo day and night adventures. | | | NEARLY-SPOTLESS SUN: With the departure of active region AR2597, the sunspot number is dropping to zero again. This continues a year-long trend of falling sunspot numbers that heralds the approach of Solar Minimum. Weekend forecast: blank suns and no solar flares. Free: Space Weather Alerts NEW MAPS OF THE SOUTH ATLANTIC ANOMALY: Researchers have long known that one of the van Allen Radiation Belts dips down toward Earth over South America, creating a zone of high radiation called "The South Atlantic Anomaly" (SAA). Since its discovery in 1958, the SAA has been shape-shifting, growing larger and intensifying. A map published just last week in the American Geophysical Union's journal Space Weather Quarterly outlines the anomaly with new precision: 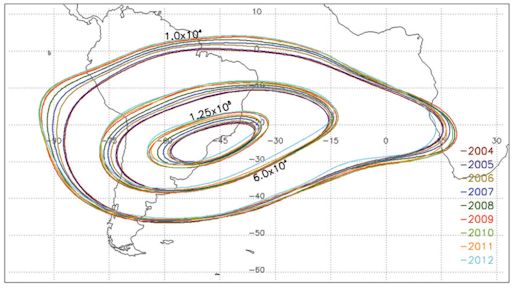
When a spacecraft in low-Earth orbit passes through the anomaly, "the radiation causes faults in spacecraft electronics and can induce false instrument readings," explains Bob Schaefer of the Johns Hopkins University Applied Physics Lab, lead author of the paper reporting the results. "We actually used these spurious signals to map out the radiation environment at an altitude of 850 km."
Specifically, they looked at pulses of noise in an ultraviolet photometer carried aboard many polar orbiting Defense Meteorological Satellite Program (DMSP) satellites. When high-energy protons in the SAA pass through these sensors, they produce spurious signals--or, in the case of this study, valuable data. By monitoring the rate of spurious UV pulses, the researchers were able to trace the outlines of the anomaly and monitor its evolution over a period of years.
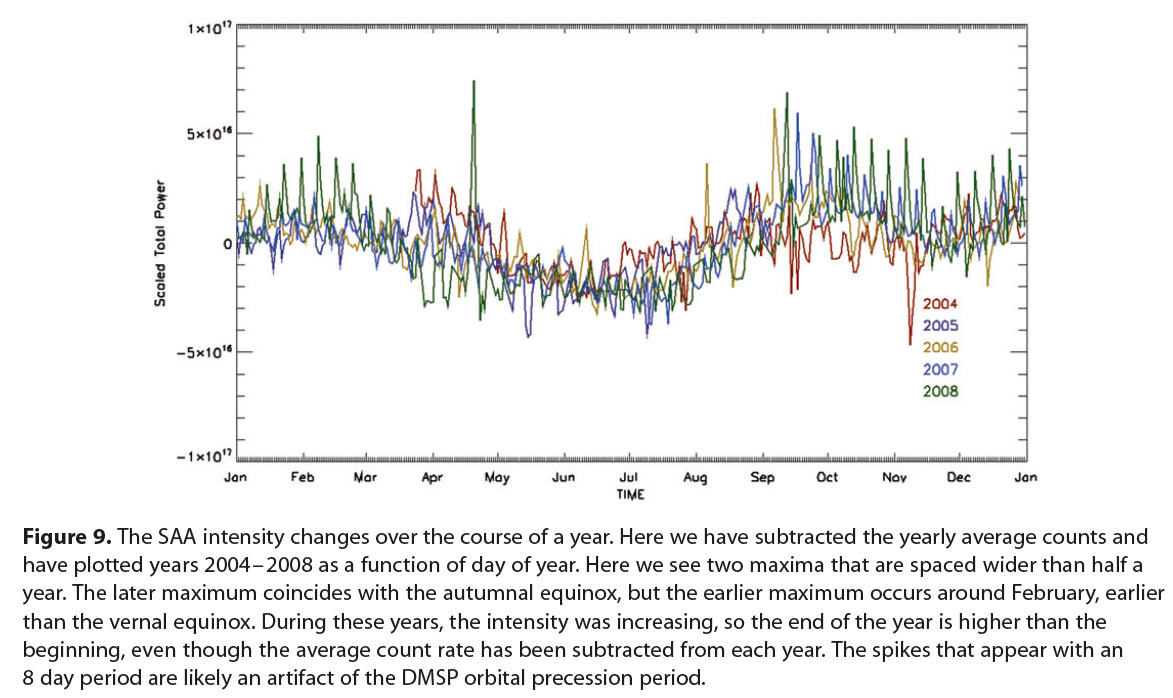
They found that the anomaly is slowly drifting north and west at rates of 0.16 deg/yr and 0.36 deg/yr, respectively. Currently, it is most intense over a broad region centered on Sao Paulo, Brazil, including much of Paraguay, Uruguay, and northern Argentina. They also detected a seasonal variation: On average, the SAA is most intense in February and again in September-October. In this plot, yearly average counts have been subtracted to reveal the double-peaked pattern: 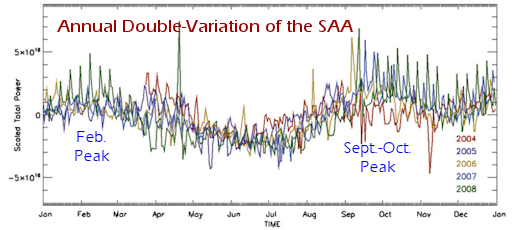
One maximum coincides with an equinox, but the other does not. The authors were not able to explain the origin of this unexpected pattern.
The solar cycle matters, too, as the data revealed a yin-yang anti-correlation with sunspots. "During years of high solar activity, the radiation intensity is lower, while during solar quiet years the radiation intensity is higher," writes Schaefer.
According to orthodox thinking, the SAA reaches down from space to within about 200 km of Earth's surface. Below that altitude, its effects should be mitigated by the shielding of Earth's atmosphere and geomagnetic field. To test this idea, Spaceweather.com and Earth to Sky Calculus have undertaken a program to map the SAA from below using weather balloons equipped with radiation sensors. Next week we will share the results of our first flight from a launch site in Chile. Stay tuned! Realtime Space Weather Photo Gallery SOLAR WIND STORM: Four days ago, Earth entered a fast-moving stream of solar wind. We're still inside. On Sept. 30th, the solar wind is clocking speeds in excess of 650 km/s (1.5 million mph) with little sign of slackening. This is putting pressure on Earth's magnetic field and sparking auroras around the poles. Ian Griffin photographed the colorful glow last night from Otago, New Zealand: 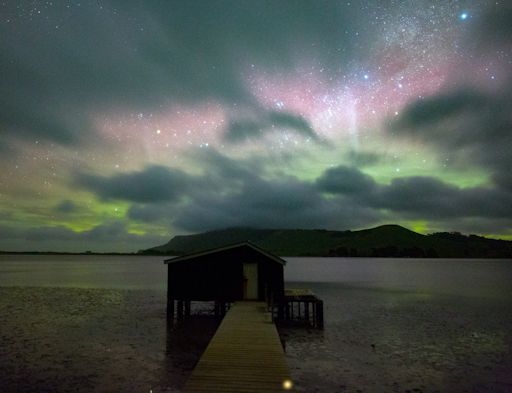
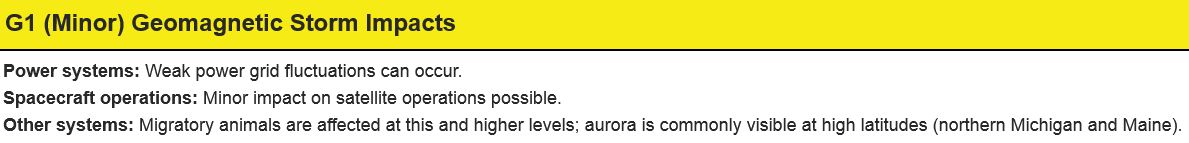
"A beautiful pastel aurora daubed the sky above Hoopers Inlet on the Otago Peninsula on Sept. 29th," says Griffin. "Despite clouds, the view was absolutely sublime." More auroras are possible tonight. NOAA forecasters estimate a 35% chance of G1-class geomagnetic storms on Sept. 30th as the solar wind continues to blow. Free: Aurora Alerts Realtime Aurora Photo Gallery
Realtime Sprite Photo Gallery
| | Cosmic Rays in the Atmosphere |
Updated: Sept. 29 2016 // Next Flight: Oct. 1, 2016
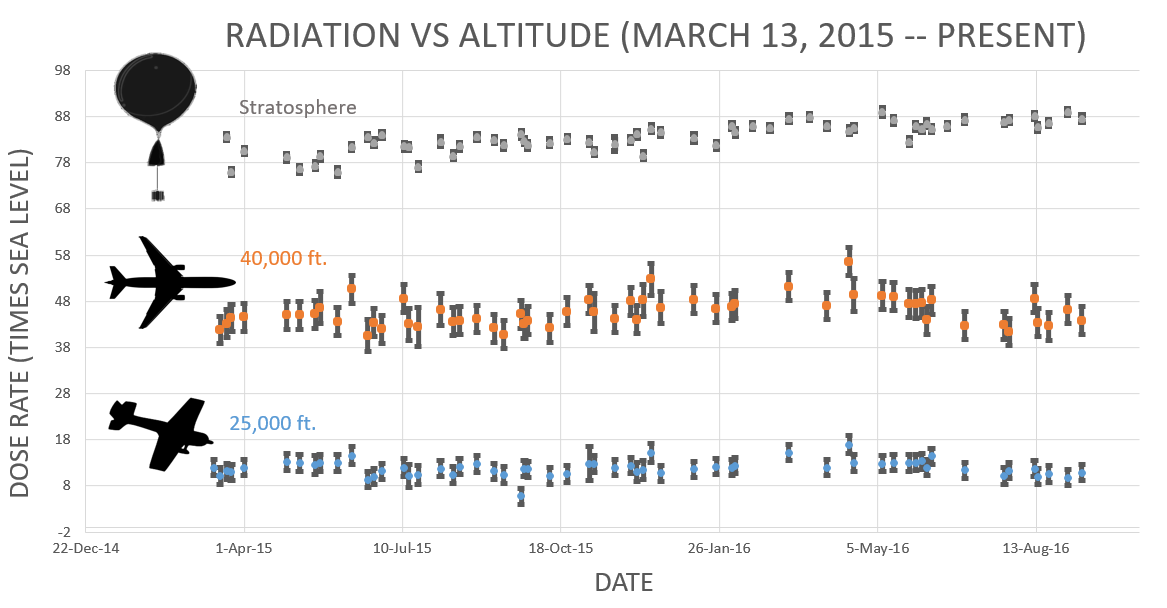
Sept. 20, 2016: Readers, thank you for your patience while we continue to develop this new section of Spaceweather.com. We've been working to streamline our data reduction, allowing us to post results from balloon flights much more rapidly, and we have developed a new data product, shown here: 
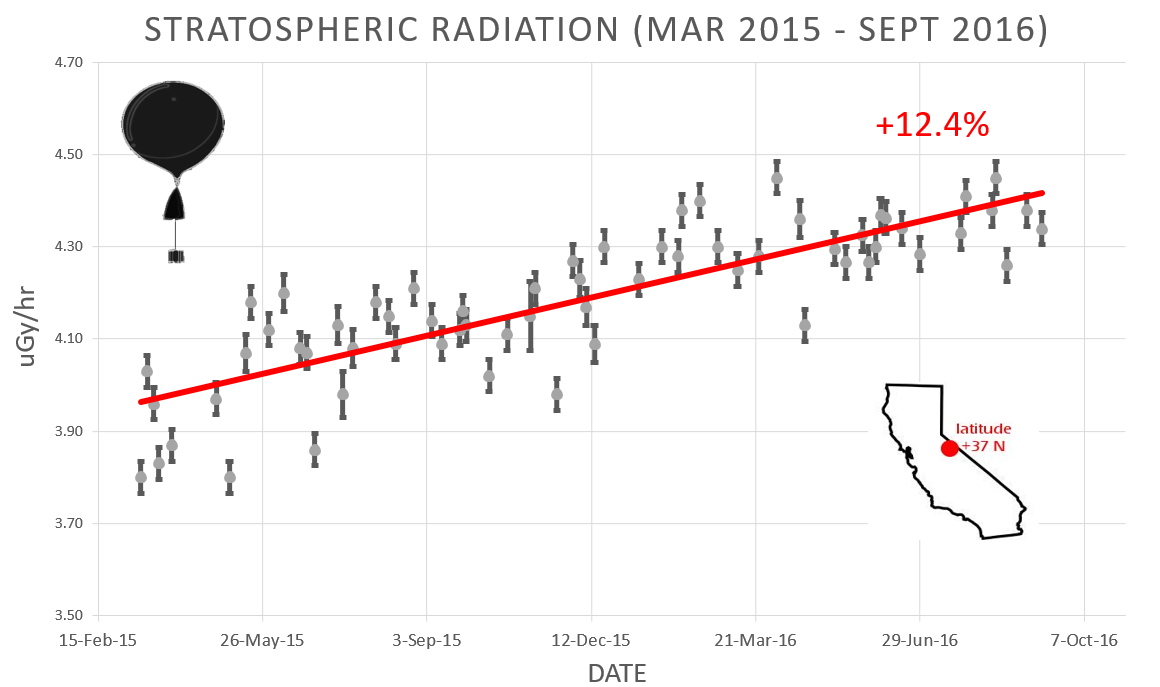
This plot displays radiation measurements not only in the stratosphere, but also at aviation altitudes. Dose rates are expessed as multiples of sea level. For instance, we see that boarding a plane that flies at 25,000 feet exposes passengers to dose rates ~10x higher than sea level. At 40,000 feet, the multiplier is closer to 50x. These measurements are made by our usual cosmic ray payload as it passes through aviation altitudes en route to the stratosphere over California. What is this all about? Approximately once a week, Spaceweather.com and the students of Earth to Sky Calculus fly space weather balloons to the stratosphere over California. These balloons are equipped with radiation sensors that detect cosmic rays, a surprisingly "down to Earth" form of space weather. Cosmic rays can seed clouds, trigger lightning, and penetrate commercial airplanes. Furthermore, there are studies ( #1, #2, #3, #4) linking cosmic rays with cardiac arrhythmias and sudden cardiac death in the general population. Our latest measurements show that cosmic rays are intensifying, with an increase of more than 12% since 2015: 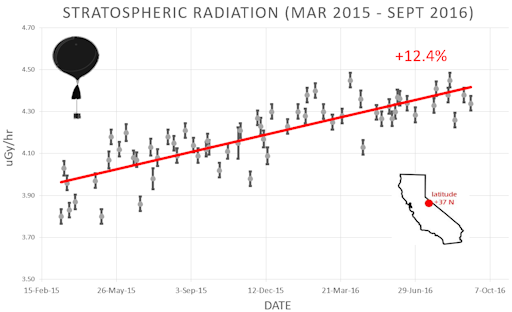
Why are cosmic rays intensifying? The main reason is the sun. Solar storm clouds such as coronal mass ejections (CMEs) sweep aside cosmic rays when they pass by Earth. During Solar Maximum, CMEs are abundant and cosmic rays are held at bay. Now, however, the solar cycle is swinging toward Solar Minimum, allowing cosmic rays to return. Another reason could be the weakening of Earth's magnetic field, which helps protect us from deep-space radiation. The radiation sensors onboard our helium balloons detect X-rays and gamma-rays in the energy range 10 keV to 20 MeV. These energies span the range of medical X-ray machines and airport security scanners. The data points in the graph above correspond to the peak of the Reneger-Pfotzer maximum, which lies about 67,000 feet above central California. When cosmic rays crash into Earth's atmosphere, they produce a spray of secondary particles that is most intense at the entrance to the stratosphere. Physicists Eric Reneger and Georg Pfotzer discovered the maximum using balloons in the 1930s and it is what we are measuring today. Every night, a network of NASA all-sky cameras scans the skies above the United States for meteoritic fireballs. Automated software maintained by NASA's Meteoroid Environment Office calculates their orbits, velocity, penetration depth in Earth's atmosphere and many other characteristics. Daily results are presented here on Spaceweather.com. On Sep. 30, 2016, the network reported 24 fireballs.
(24 sporadics)  In this diagram of the inner solar system, all of the fireball orbits intersect at a single point--Earth. The orbits are color-coded by velocity, from slow (red) to fast (blue). [Larger image] [movies] Potentially Hazardous Asteroids ( PHAs) are space rocks larger than approximately 100m that can come closer to Earth than 0.05 AU. None of the known PHAs is on a collision course with our planet, although astronomers are finding new ones all the time. On September 30, 2016 there were potentially hazardous asteroids. Notes: LD means "Lunar Distance." 1 LD = 384,401 km, the distance between Earth and the Moon. 1 LD also equals 0.00256 AU. MAG is the visual magnitude of the asteroid on the date of closest approach. | | The official U.S. government space weather bureau | | | The first place to look for information about sundogs, pillars, rainbows and related phenomena. | | | Researchers call it a "Hubble for the sun." SDO is the most advanced solar observatory ever. | | | 3D views of the sun from NASA's Solar and Terrestrial Relations Observatory | | | Realtime and archival images of the Sun from SOHO. | | | from the NOAA Space Environment Center | | | a proud supporter of science education and Spaceweather.com | | | the underlying science of space weather |  | Find homes for sale in Ocala, Orlando and Tampa with the #1 real estate company in Central Florida Local Realty Service | | Visit Need An Eitzah for all your questions and forum discussions on Jewish life. | | | These links help Spaceweather.com stay online. Thank you to our supporters! | | 


