Lights Over Lapland has a brand-new website full of exciting adventures in Abisko National Park, Sweden! Take a look at our aurora activities and book your once-in-a-lifetime trip with us today! | | |
EXPERTS PREDICT A LONG, DEEP SOLAR MINIMUM: An international panel of researchers led by NASA and NOAA has released a new prediction for the solar cycle: The current solar minimum is going to deepen, potentially reaching a century-class low in the next year or so. This will be followed by a new Solar Max in the years 2023-2026. Get the full story here.
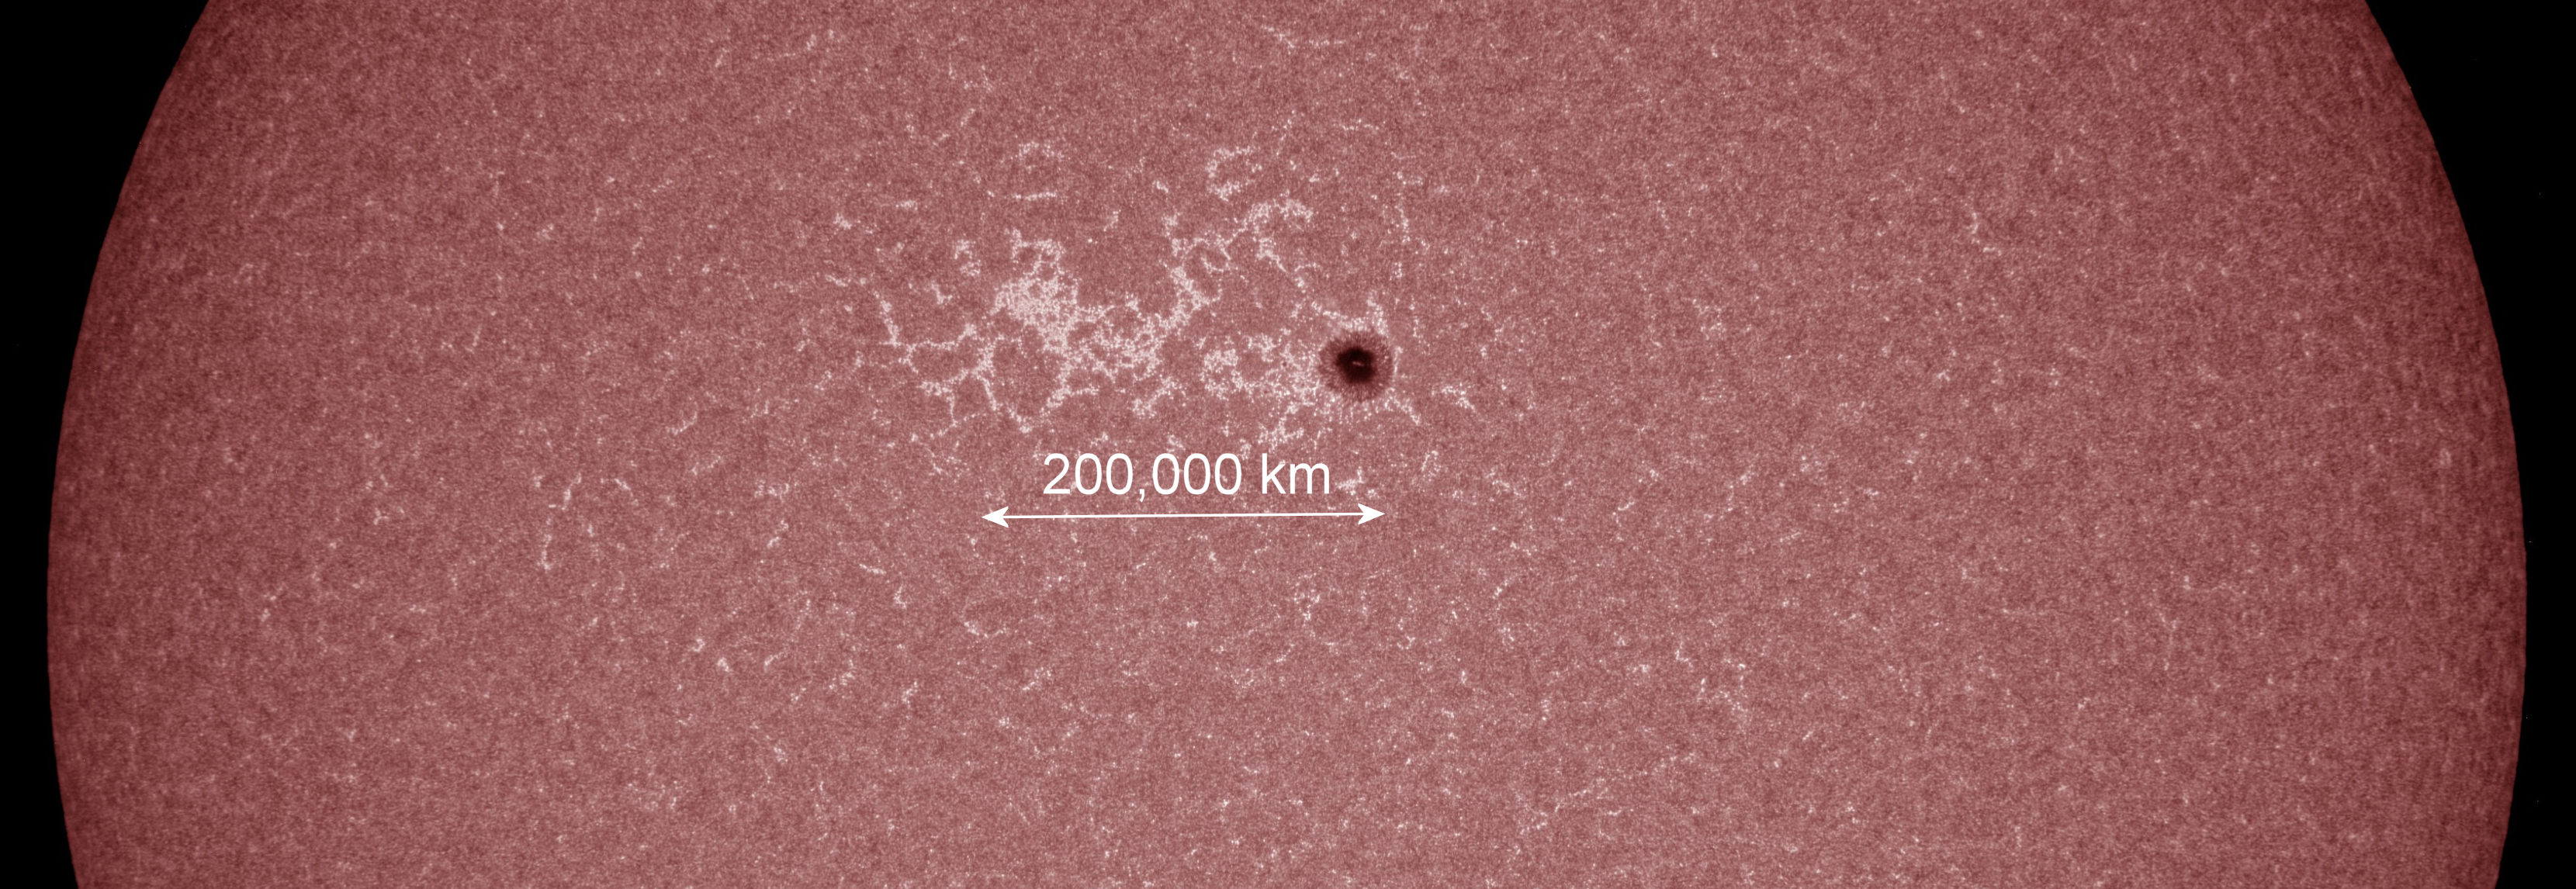
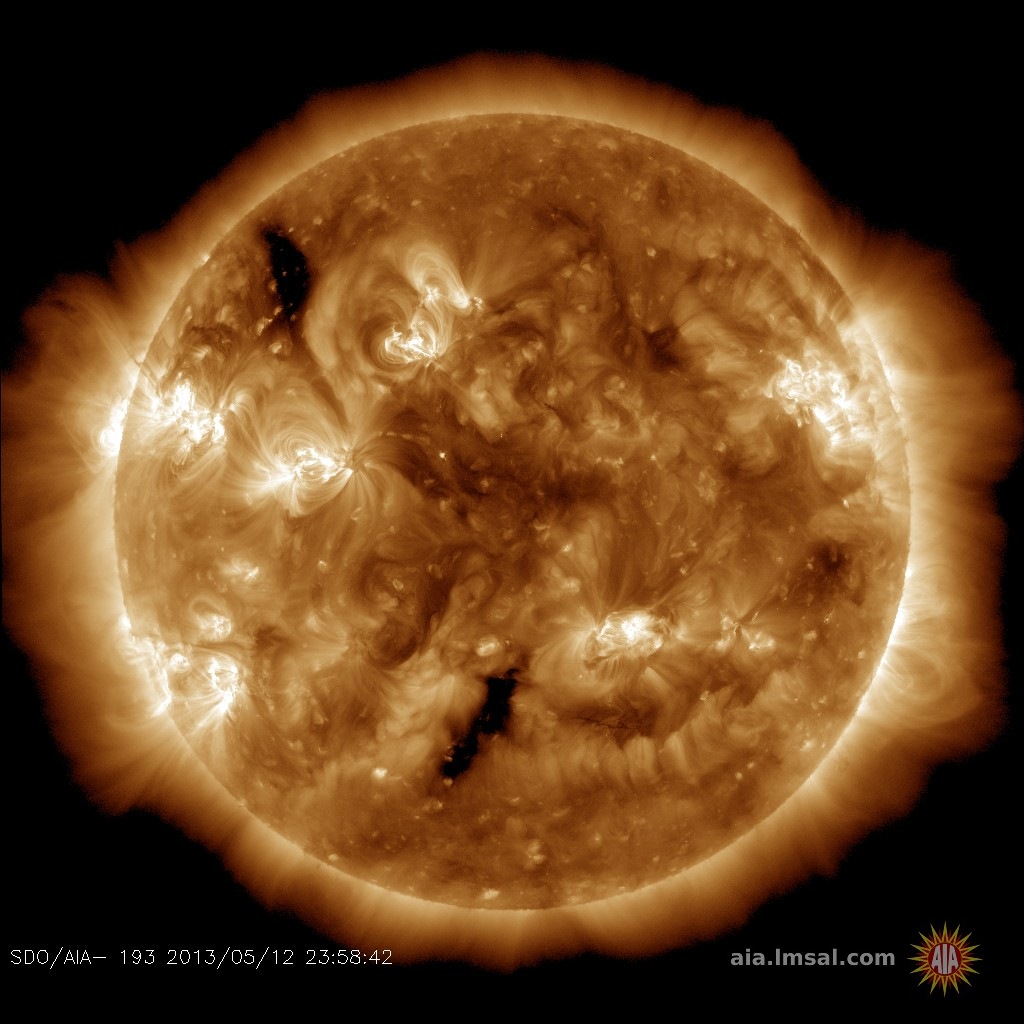
BIG SUNSPOT FACES EARTH: This weekend, one of the biggest sunspots since the solar storms of Sept. 2017 is directly facing Earth. AR2738 has a primary core three times wider than our planet and it is creating a wake of magnetic froth on the sun's surface more than 200,000 km long:
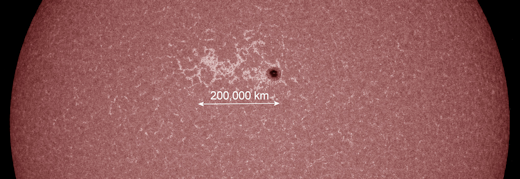
Above: An extreme ultraviolet image from NASA's Solar Dynamics Observatory
Since it first appeared one week ago, the behemoth spot has not produced any very strong solar flares. However, something interesting is happening to AR2738. It may be splitting apart.
The primary core of sunspot AR2738 is divided by a growing canyon of light--also known as a "light bridge"--measuring 20,000 km from end to end. Yesterday, amateur astronomer Martin R. Wise photographed the phenomenon from his backyard observatory in Trenton, Florida. Follow the arrow:
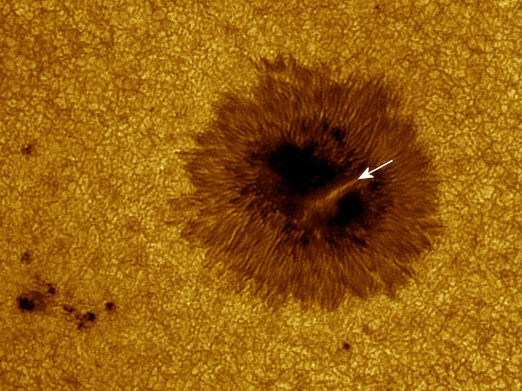
Wise's photo is remarkably detailed. The light bridge is only about 800 km wide--less than the width of Texas. His image captures not only that narrow divide, but also hundreds of Texas-sized granules on the sun's boiling surface around the sunspot.
The nature of light bridges is not fully understood. They often herald the break-up of a sunspot, with jets of plasma shooting up from the chasm as the sunspot decays. Some research suggests that magnetic fields at the base of a light bridge are busy cross-crossing and reconnecting--the same explosive process that sparks solar flares. Does this mean sunspot AR2738 will explode--or quietly fall apart? No one can say. Readers with solar telescopes are encouraged to monitor developments.
More photos: The light bridge is also visible in images from Andy Devey in southern Spain; from Francois Rouviere of Cannes, France; from Shahrin Ahmad of Kuala Lumpur, Malaysia; from Howard Eskildsen of Ocala, Florida.
Realtime Space Weather Photo Gallery
A GIFT FROM THE EDGE OF SPACE: Looking for an over-the-Moon gift? Consider this: On Jan. 4th, the students of Earth to Sky Calculus flew this 3D printed Moon globe to the stratosphere, 36.3 km (119,095 ft) above California's Sierra Nevada mountains:
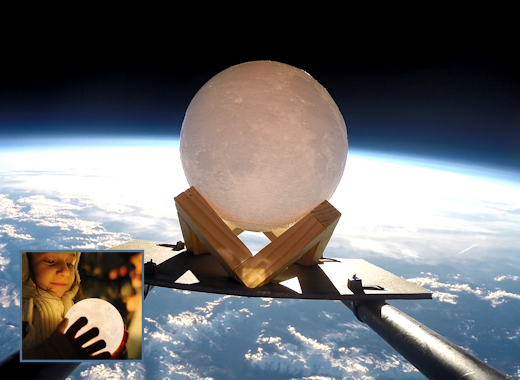
You can have it for $149.95. The students are selling these globes to support their cosmic ray ballooning program.
The surface of the sphere is an accurate topo-map of lunar terrain, tracing every major crater and mountain range. It is also a night light. A built-in USB-rechargeable battery provides up to 20 hours of romantic illumination. Each glowing orb comes with a greeting card showing the Moon in flight and telling the story of its journey to the edge of space.
Far Out Gifts: Earth to Sky Store
All sales support hands-on STEM education
LIGHT PILLARS OVERHEAD: Many of us have witnessed light pillars--columns of light reflected from ice crystals in the air. On cold days in northern cities, they form tall luminous towers over bright urban lights. But how many of us have seen light pillars directly overhead? Filipe Alves did yesterday in Lisbon, Portugal:
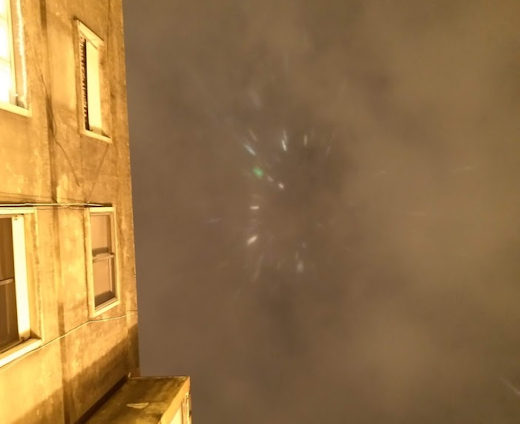
"As I was walking the streets of Lisbon, I looked up and saw several streaks of light, some white and a strong green streak, almost looked like an aurora borealis," says Alves. "I suspect it was a reflection of city lights on ice crystals in the clouds above. The position of the streaks seemed to track the city's main arteries."
"I have seen light pillars before, but this is the first time I've seen them almost directly overhead," he says. "It was amazing."
Realtime Space Weather Photo Gallery
Realtime Aurora Photo Gallery
Every night, a network of
NASA all-sky cameras scans the skies above the United States for meteoritic fireballs. Automated software maintained by NASA's Meteoroid Environment Office calculates their orbits, velocity, penetration depth in Earth's atmosphere and many other characteristics. Daily results are presented here on Spaceweather.com.
On Apr. 13, 2019, the network reported 9 fireballs.
(9 sporadics)
In this diagram of the inner solar system, all of the fireball orbits intersect at a single point--Earth. The orbits are color-coded by velocity, from slow (red) to fast (blue). [Larger image] [movies]
Potentially Hazardous Asteroids (
PHAs) are space rocks larger than approximately 100m that can come closer to Earth than 0.05 AU. None of the known PHAs is on a collision course with our planet, although astronomers are finding
new ones all the time.
On April 13, 2019 there were 1967 potentially hazardous asteroids.
 |
Recent & Upcoming Earth-asteroid encounters: | Asteroid | Date(UT) | Miss Distance | Velocity (km/s) | Diameter (m) |
| 2019 FS2 | 2019-Apr-08 | 3.2 LD | 6.2 | 12 |
| 2019 GR | 2019-Apr-08 | 11.4 LD | 5.7 | 26 |
| 2019 GC | 2019-Apr-08 | 6.2 LD | 6.6 | 17 |
| 2019 FU | 2019-Apr-09 | 5.3 LD | 14.2 | 85 |
| 2014 UR | 2019-Apr-09 | 13 LD | 4.6 | 17 |
| 2014 HD177 | 2019-Apr-10 | 6.1 LD | 14 | 102 |
| 2016 GW221 | 2019-Apr-10 | 10.4 LD | 5.3 | 39 |
| 2019 GQ | 2019-Apr-10 | 5.2 LD | 8.4 | 17 |
| 2019 GV5 | 2019-Apr-11 | 1.7 LD | 3.9 | 5 |
| 2019 GE1 | 2019-Apr-11 | 3.9 LD | 6.5 | 13 |
| 2019 GY5 | 2019-Apr-11 | 5.9 LD | 27.3 | 26 |
| 2019 FB3 | 2019-Apr-12 | 11.9 LD | 14.2 | 45 |
| 2019 GC4 | 2019-Apr-12 | 5.1 LD | 33.5 | 37 |
| 2019 GL4 | 2019-Apr-12 | 14.4 LD | 13.2 | 85 |
| 2019 GQ1 | 2019-Apr-12 | 13.4 LD | 12.7 | 40 |
| 2019 GN | 2019-Apr-13 | 1.7 LD | 11.9 | 14 |
| 2019 GO4 | 2019-Apr-13 | 5 LD | 23.5 | 31 |
| 2019 FO1 | 2019-Apr-13 | 14.4 LD | 9.7 | 28 |
| 2019 FH1 | 2019-Apr-13 | 18 LD | 3.8 | 31 |
| 2019 GN4 | 2019-Apr-13 | 7.4 LD | 18.4 | 40 |
| 2019 GC6 | 2019-Apr-18 | 0.6 LD | 5.6 | 17 |
| 2012 XO134 | 2019-Apr-18 | 14.8 LD | 11 | 56 |
| 2019 FN2 | 2019-Apr-18 | 4.1 LD | 7.7 | 66 |
| 522684 | 2019-Apr-19 | 19 LD | 11.5 | 214 |
| 2019 GZ3 | 2019-Apr-20 | 10.1 LD | 14.2 | 23 |
| 2019 GM | 2019-Apr-21 | 19.4 LD | 10.3 | 34 |
| 2019 FV2 | 2019-Apr-22 | 15.6 LD | 2.3 | 33 |
| 2019 GM4 | 2019-Apr-23 | 9.1 LD | 8.4 | 72 |
| 2019 GF1 | 2019-Apr-27 | 4.7 LD | 1.9 | 11 |
| 2019 GX5 | 2019-Apr-28 | 7.2 LD | 10.7 | 27 |
| 2018 KK1 | 2019-May-05 | 13.9 LD | 13.9 | 71 |
| 2017 RC | 2019-May-09 | 14.5 LD | 10.6 | 9 |
| 2008 HS3 | 2019-May-09 | 14.6 LD | 5.3 | 162 |
| 2018 VX8 | 2019-May-12 | 6.2 LD | 15.5 | 118 |
| 2019 GT1 | 2019-May-17 | 6.1 LD | 3.9 | 36 |
| 2012 KT12 | 2019-May-18 | 3.3 LD | 3.9 | 20 |
| 2015 KQ18 | 2019-May-25 | 10.7 LD | 13.1 | 30 |
| 66391 | 2019-May-25 | 13.5 LD | 21.5 | 1780 |
| 2003 LH | 2019-May-28 | 15.6 LD | 7.4 | 32 |
| 2011 HP | 2019-May-30 | 12.3 LD | 8.4 | 135 |
| 2014 MF18 | 2019-Jun-06 | 8.8 LD | 3 | 22 |
Notes: LD means "Lunar Distance." 1 LD = 384,401 km, the distance between Earth and the Moon. 1 LD also equals 0.00256 AU. MAG is the visual magnitude of the asteroid on the date of closest approach. | | Cosmic Rays in the Atmosphere |
SOMETHING NEW! We have developed a new predictive model of aviation radiation. It's called E-RAD--short for Empirical RADiation model. We are constantly flying radiation sensors onboard airplanes over the US and and around the world, so far collecting more than 22,000 gps-tagged radiation measurements. Using this unique dataset, we can predict the dosage on any flight over the USA with an error no worse than 15%.
E-RAD lets us do something new: Every day we monitor approximately 1400 flights criss-crossing the 10 busiest routes in the continental USA. Typically, this includes more than 80,000 passengers per day. E-RAD calculates the radiation exposure for every single flight.
The Hot Flights Table is a daily summary of these calculations. It shows the 5 charter flights with the highest dose rates; the 5 commercial flights with the highest dose rates; 5 commercial flights with near-average dose rates; and the 5 commercial flights with the lowest dose rates. Passengers typically experience dose rates that are 20 to 70 times higher than natural radiation at sea level.
To measure radiation on airplanes, we use the same sensors we fly to the stratosphere onboard Earth to Sky Calculus cosmic ray balloons: neutron bubble chambers and X-ray/gamma-ray Geiger tubes sensitive to energies between 10 keV and 20 MeV. These energies span the range of medical X-ray machines and airport security scanners.
Column definitions: (1) The flight number; (2) The maximum dose rate during the flight, expressed in units of natural radiation at sea level; (3) The maximum altitude of the plane in feet above sea level; (4) Departure city; (5) Arrival city; (6) Duration of the flight.
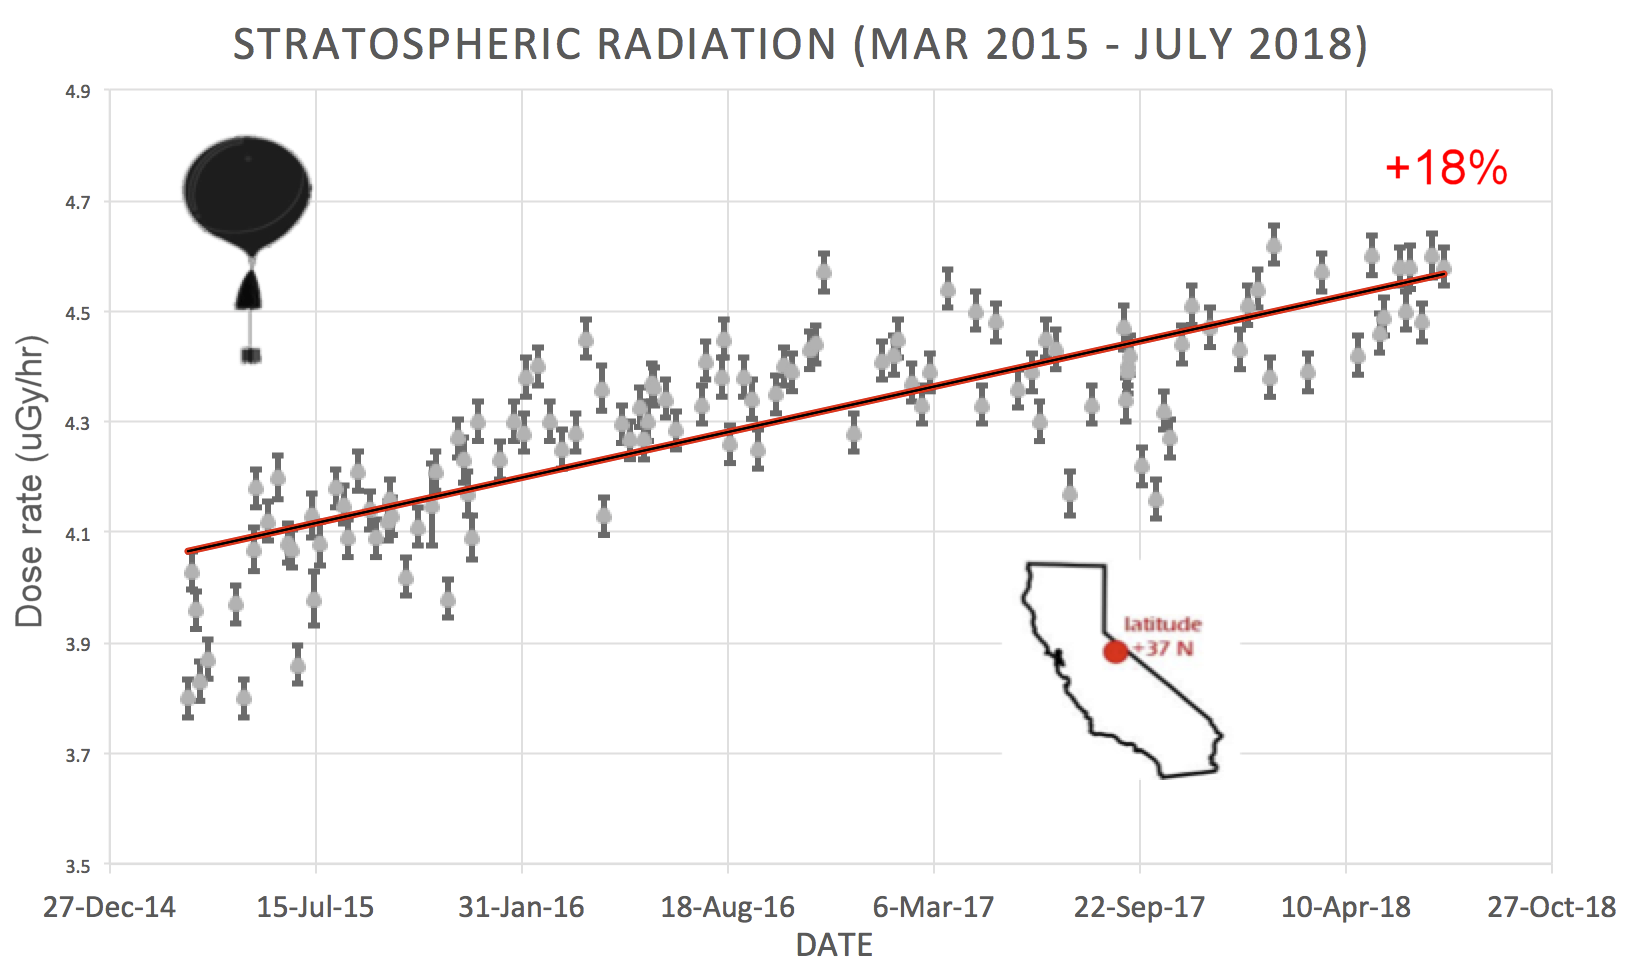
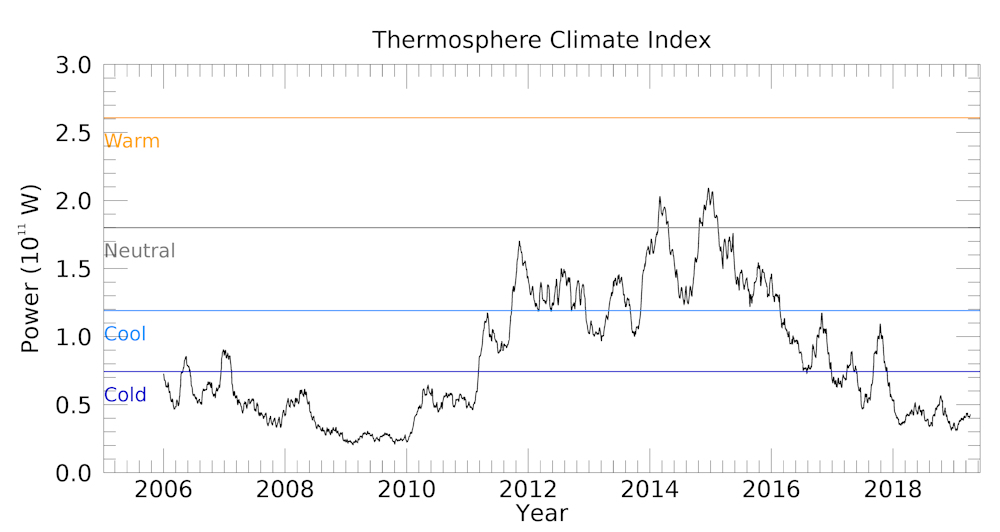
SPACE WEATHER BALLOON DATA: Approximately once a week, Spaceweather.com and the students of Earth to Sky Calculus fly space weather balloons to the stratosphere over California. These balloons are equipped with radiation sensors that detect cosmic rays, a surprisingly "down to Earth" form of space weather. Cosmic rays can seed clouds, trigger lightning, and penetrate commercial airplanes. Furthermore, there are studies ( #1, #2, #3, #4) linking cosmic rays with cardiac arrhythmias and sudden cardiac death in the general population. Our latest measurements show that cosmic rays are intensifying, with an increase of more than 18% since 2015:

The data points in the graph above correspond to the peak of the Reneger-Pfotzer maximum, which lies about 67,000 feet above central California. When cosmic rays crash into Earth's atmosphere, they produce a spray of secondary particles that is most intense at the entrance to the stratosphere. Physicists Eric Reneger and Georg Pfotzer discovered the maximum using balloons in the 1930s and it is what we are measuring today.
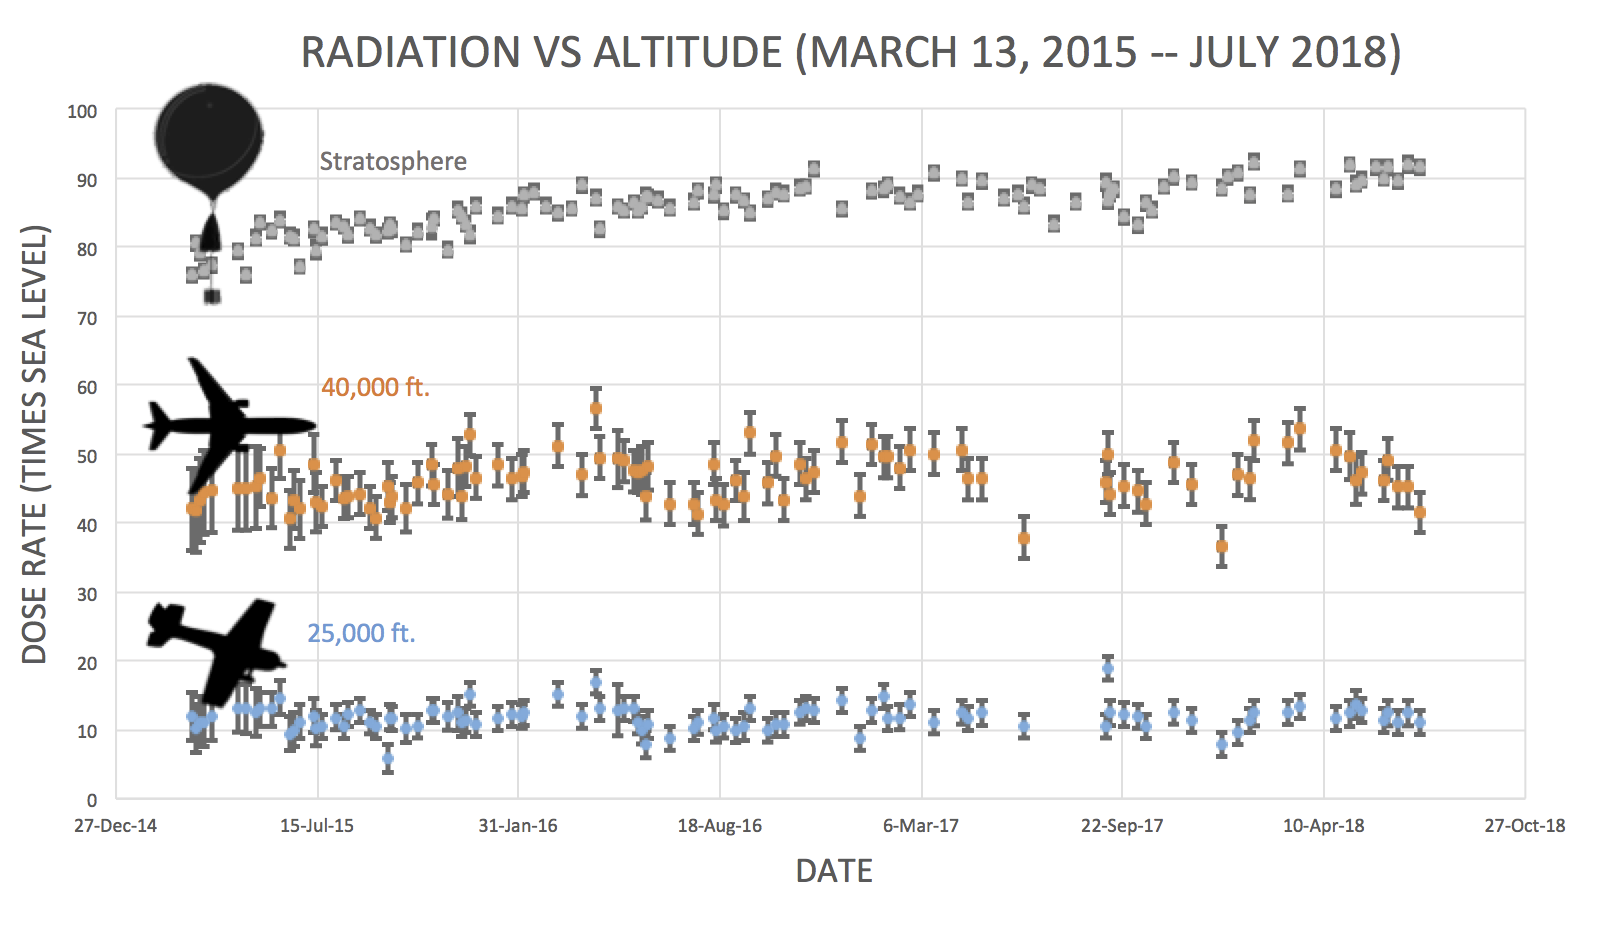
En route to the stratosphere, our sensors also pass through aviation altitudes:

In this plot, dose rates are expessed as multiples of sea level. For instance, we see that boarding a plane that flies at 25,000 feet exposes passengers to dose rates ~10x higher than sea level. At 40,000 feet, the multiplier is closer to 50x.
The radiation sensors onboard our helium balloons detect X-rays and gamma-rays in the energy range 10 keV to 20 MeV. These energies span the range of medical X-ray machines and airport security scanners.
Why are cosmic rays intensifying? The main reason is the sun. Solar storm clouds such as coronal mass ejections (CMEs) sweep aside cosmic rays when they pass by Earth. During Solar Maximum, CMEs are abundant and cosmic rays are held at bay. Now, however, the solar cycle is swinging toward Solar Minimum, allowing cosmic rays to return. Another reason could be the weakening of Earth's magnetic field, which helps protect us from deep-space radiation.
| | The official U.S. government space weather bureau |
| | The first place to look for information about sundogs, pillars, rainbows and related phenomena. |
| | Researchers call it a "Hubble for the sun." SDO is the most advanced solar observatory ever. |
| | 3D views of the sun from NASA's Solar and Terrestrial Relations Observatory |
| | Realtime and archival images of the Sun from SOHO. |
| | from the NOAA Space Environment Center |
| | fun to read, but should be taken with a grain of salt! Forecasts looking ahead more than a few days are often wrong. |
| | from the NOAA Space Environment Center |
| | the underlying science of space weather |
 | To find reviews of new online casino sites in the UK try The Casino DB where there are hundreds of online casino reviews complete with bonuses and ratings. Looking for a new online casino? Try Casimpo the new site dedicated to making online casino simple and easy for all. |
| | These links help Spaceweather.com stay online. Thank you to our supporters! |
| | | | | | |


