 |
| |

SPACE WEATHER
NOAA Forecasts |
|
Updated at: 2026 Jul 08 2200 UTC
FLARE |
0-24
hr |
24-48
hr |
CLASS M |
40
% |
40
% |
CLASS X |
10
% |
10
% |
 Geomagnetic Storms:
Probabilities for significant
disturbances in Earth's magnetic field are given for three activity levels: active, minor
storm, severe
storm
Updated at: 2026 Jul 08 2200 UTC
Mid-latitudes
|
0-24
hr |
24-48
hr |
ACTIVE |
30
% |
30
% |
MINOR |
05
% |
05
% |
SEVERE |
01
% |
01
% |
High latitudes
|
0-24
hr |
24-48
hr |
ACTIVE |
15
% |
15
% |
MINOR |
20
% |
20
% |
SEVERE |
25
% |
25
% |
|
|
|
 |
|
|
|
| |
|
|
|
| |
This is an AI Free Zone: AI is everywhere -- except here. Spaceweather.com is written by Dr. Tony Phillips, a carbon-based lifeform with 30 yrs of forecasting experience. If you find a mistake, rest assured it was made by a real human being.
|
|
|
AN OUTBREAK OF NOCTILUCENT CLOUDS: Last night, observers in Europe and North America reported seeing bright night-shining (noctilucent) clouds--"the best of the season so far," says John C. McConnell of Northern Ireland. These clouds are made of frosted meteor smoke. They form naturally in summer months, and now is prime time to see them. [photo gallery]
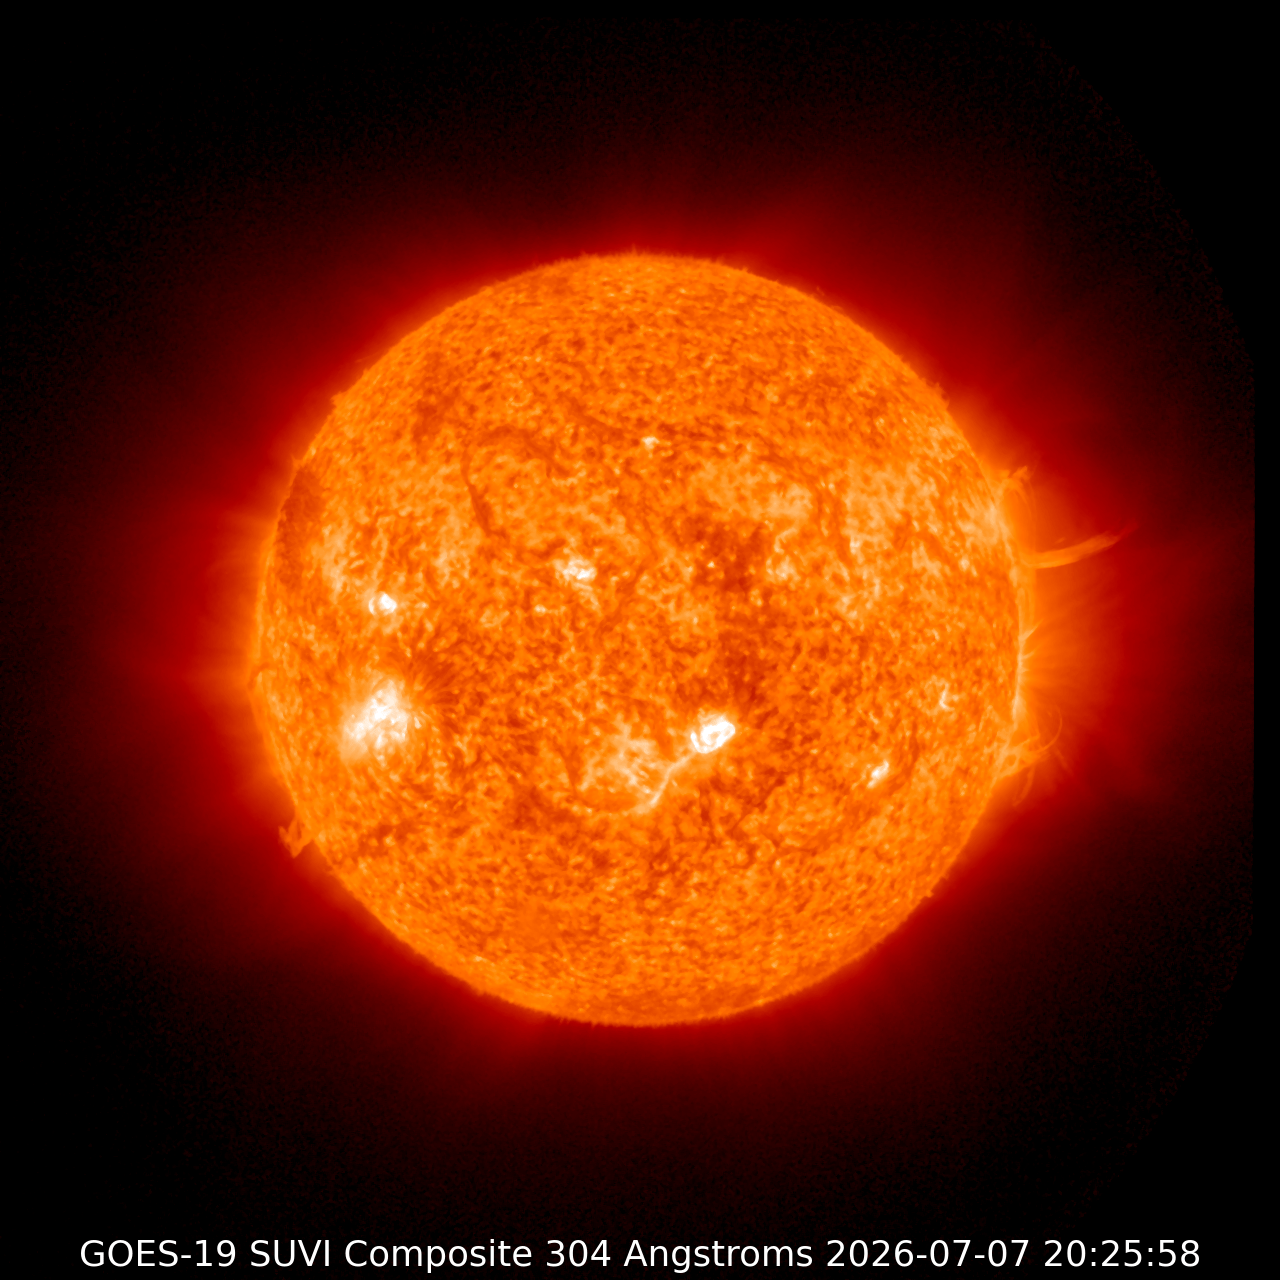
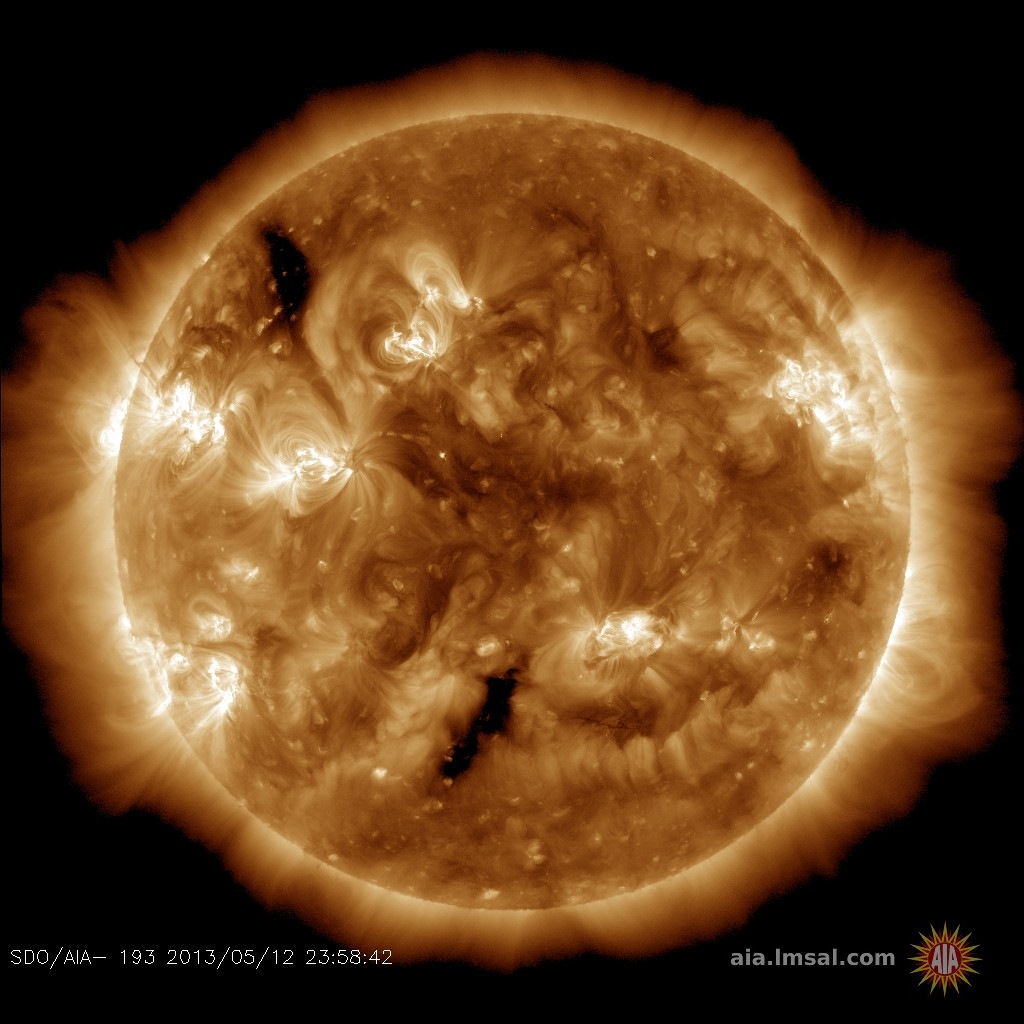
BIG SOLAR ACTIVITY: On July 7th, two sides of the sun exploded almost simultaneously. This movie from NOAA's GOES-19 satellite shows what happened:
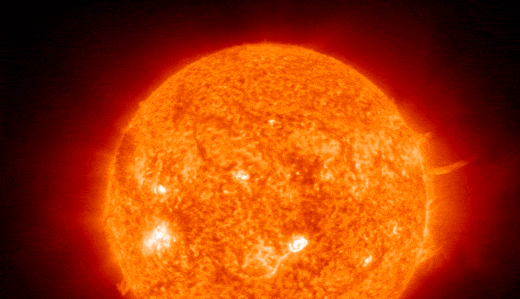
Plumes of hot plasma flew away from opposing hemispheres within the same 2 hours. Coincidence? Maybe not. NASA has seen this happen before. Magnetic instabilities can quickly ripple across the entire sun, destablizing widely-separated regions. In 2010, an entire hemisphere erupted.
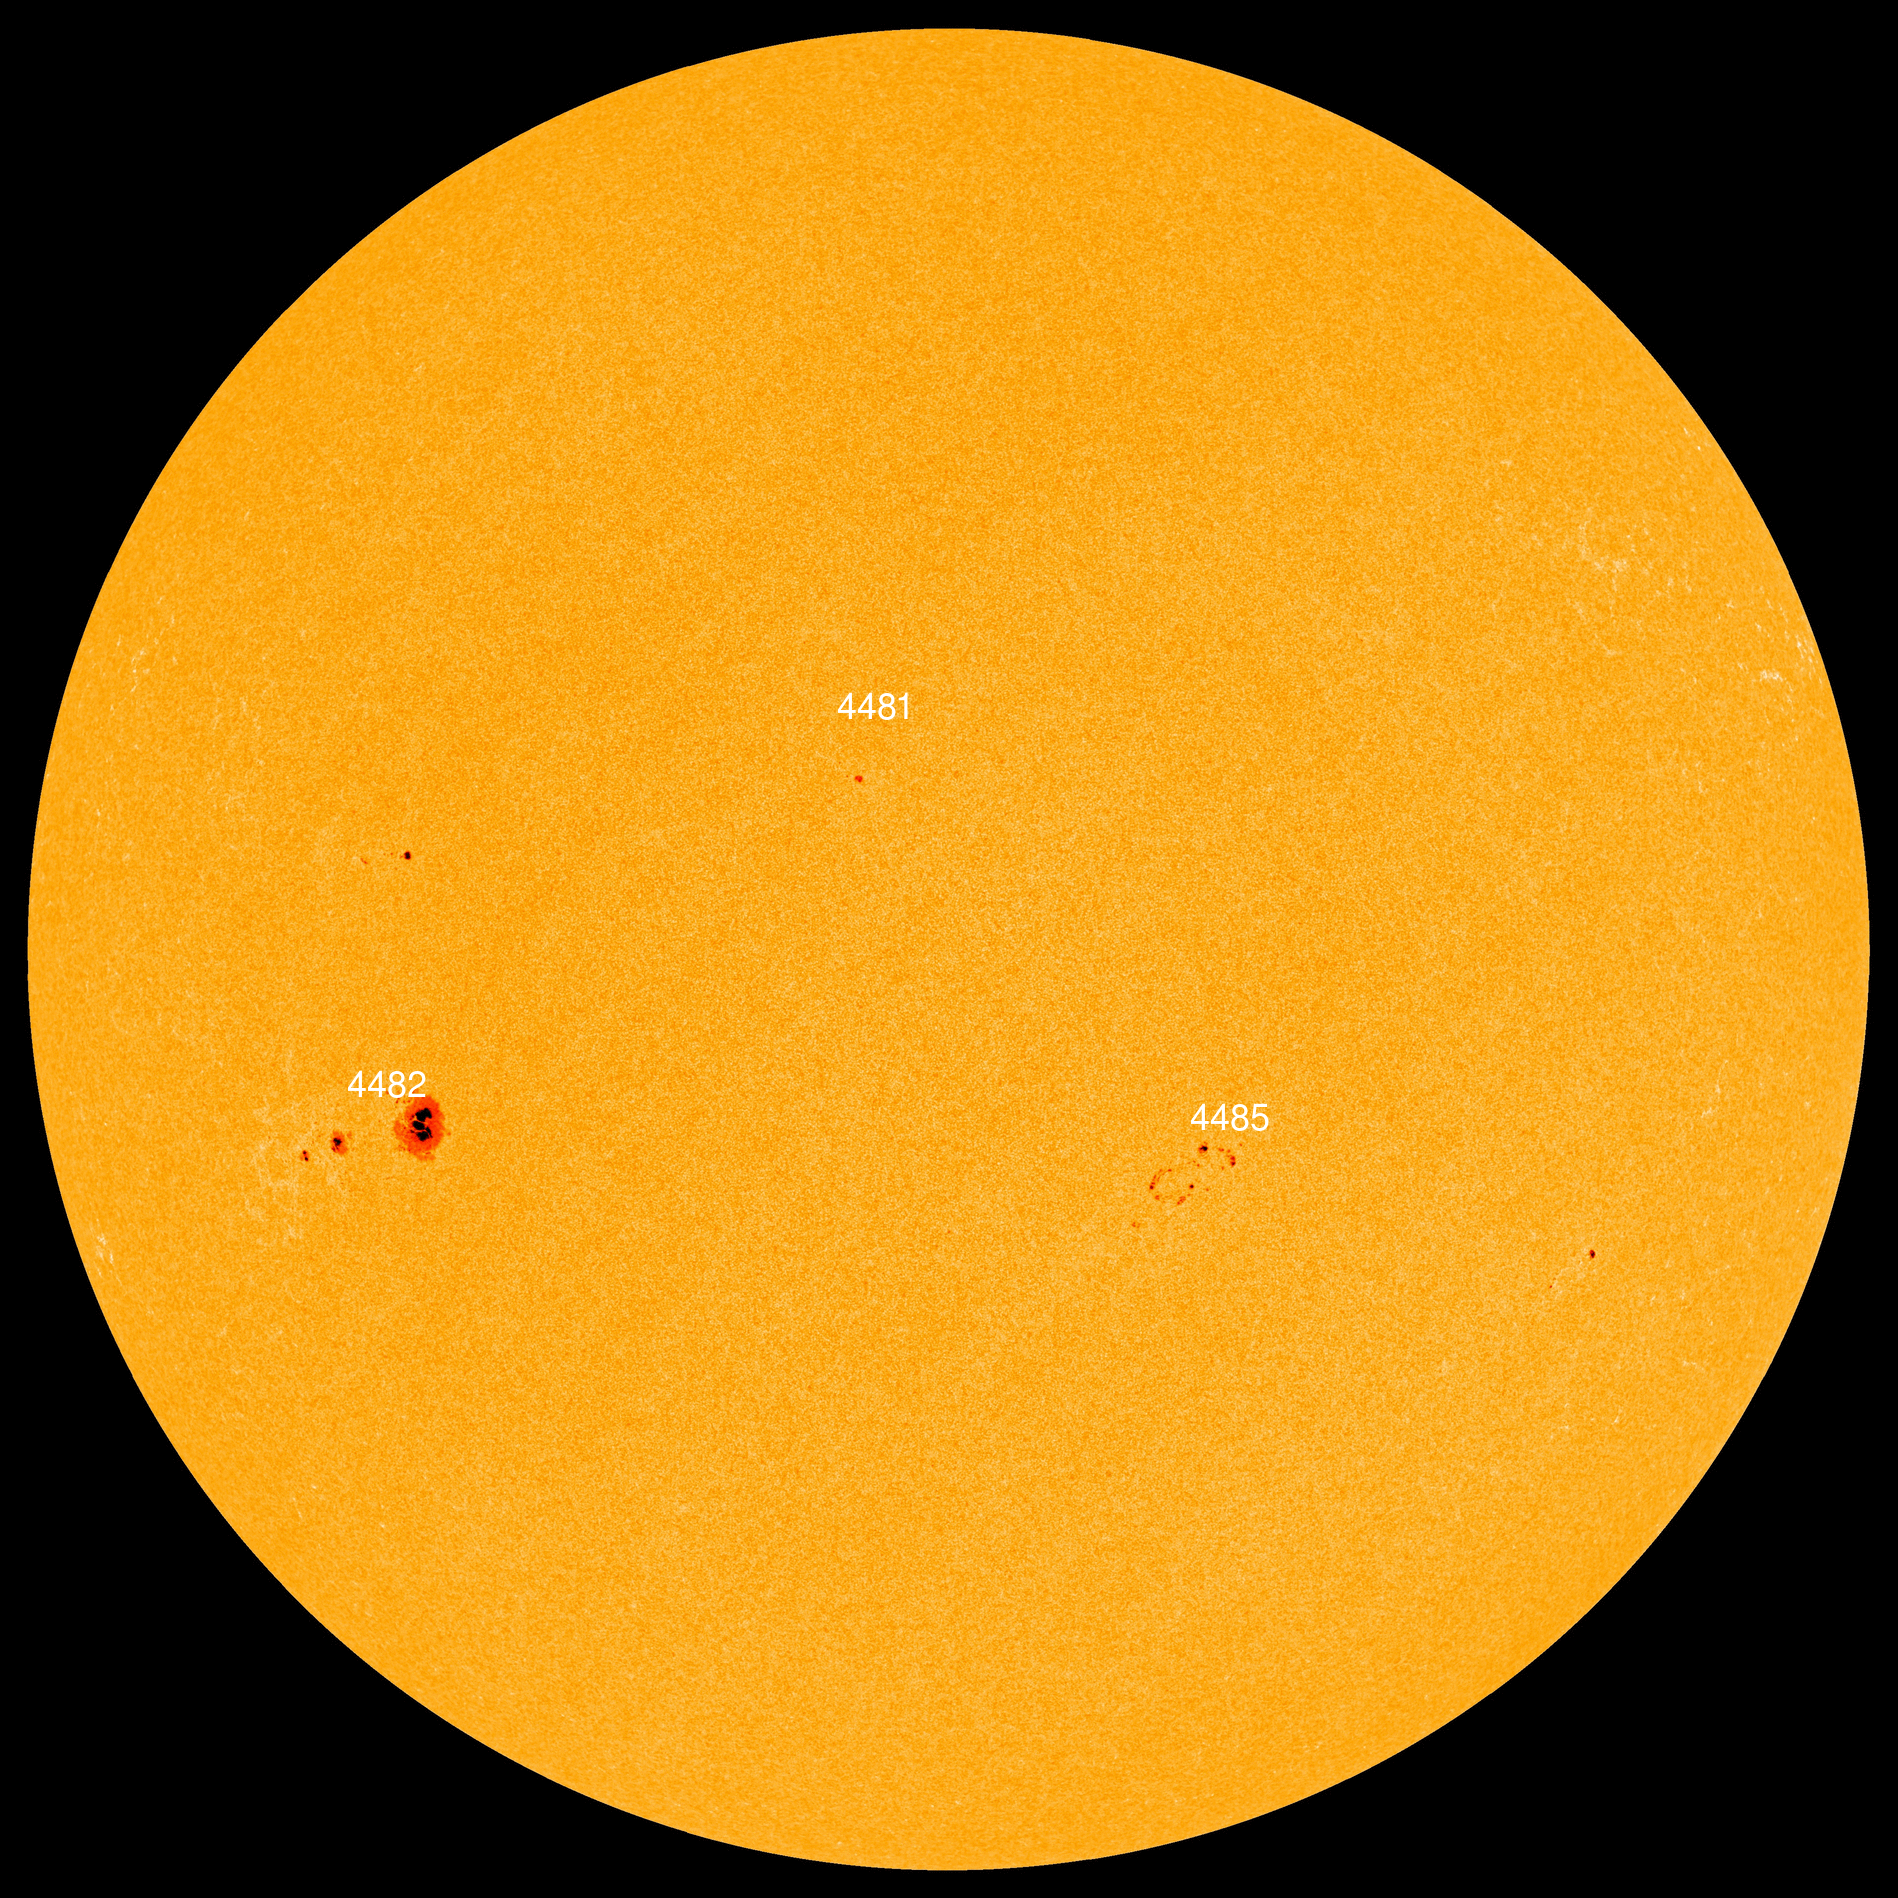
This event, in combination with recent flares from sunspot 4482, suggest that the sun is in a heightened state of activity. Stay tuned. Solar flare Alerts: SMS Text
Realtime Space Weather Photo Gallery
Free: Space Weather Newsletter
STEVE VISITS IDAHO: During 4th of July weekend, auroras blanketed the USA during a strong geomagnetic storm. Upon closer inspection, not all the lights were auroras. "We also saw STEVE," reports David Egan of Driggs Idaho, who took a family photo with the phenomenon:
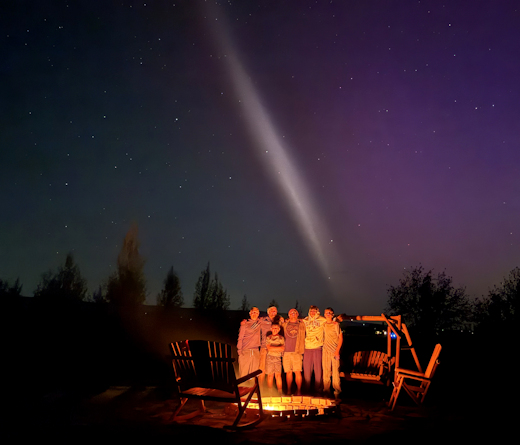
STEVE is a recent discovery. It looks like an aurora, but it is not. The purple glow is caused by hot (3000°C) ribbons of gas flowing through Earth’s magnetosphere at speeds exceeding 6 km/s (13,000 mph). It appears during many geomagnetic storms alongside actual auroras. Indeed, Egan's family saw those, too.
Browse the realtime aurora gallery for more scenes from the holiday weekend.
Realtime Aurora Photo Gallery
Free: Spaceweather.com Newsletter
THE METEOR CRATER PENDANT: Have you heard of Moissanite? It's a very rare mineral discovered by 19th-century chemist Henri Moissan in Arizona's Meteor Crater. At first, he thought it was diamond, but later realized it was even more rare. It's a diamond lookalike that, until the 1950s, was found naturally only in meteorites.
On Aug. 2, 2025, the students of Earth to Sky Calculus launched this Moissanite pendant to the stratosphere onboard a cosmic ray research balloon:
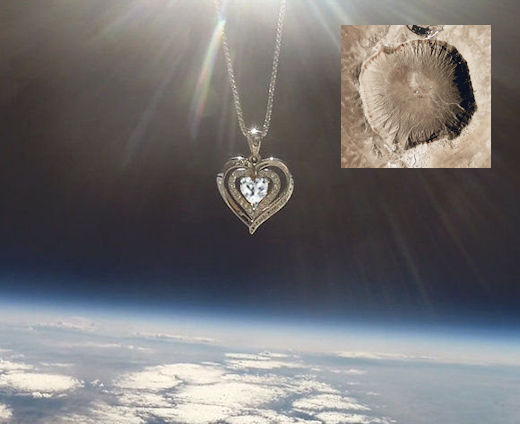
You can have it for $169.95. Engraved with the words "I love you always and forever," the sterling silver frame bends around the Moissanite in a heart-shaped curve--all highlighted by glittering 5A cubic zirconia nuggets.
The students are selling space pendants to pay the helium bill for their cosmic ray ballooning program. Each one comes with a greeting card showing the jewelry in flight and telling the story of its trip to the stratosphere and back again.
Far Out Gifts: Earth to Sky Store
All sales support hands-on STEM education
Realtime Aurora Photo Gallery
Free: Spaceweather.com Newsletter
Realtime Space Weather Photo Gallery
Free: Space Weather Newsletter
Every night, a network
of NASA
all-sky cameras scans the skies above the United
States for meteoritic fireballs. Automated software
maintained by NASA's Meteoroid Environment Office
calculates their orbits, velocity, penetration depth
in Earth's atmosphere and many other characteristics.
Daily results are presented here on Spaceweather.com.
On July 8, 2026, the network reported 14 fireballs.
(13 sporadics, 1 phi Piscid)
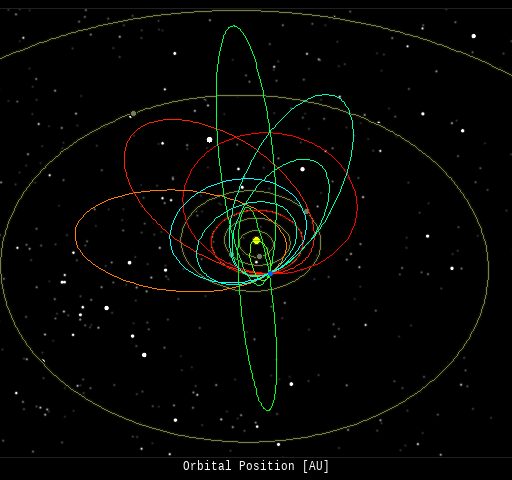
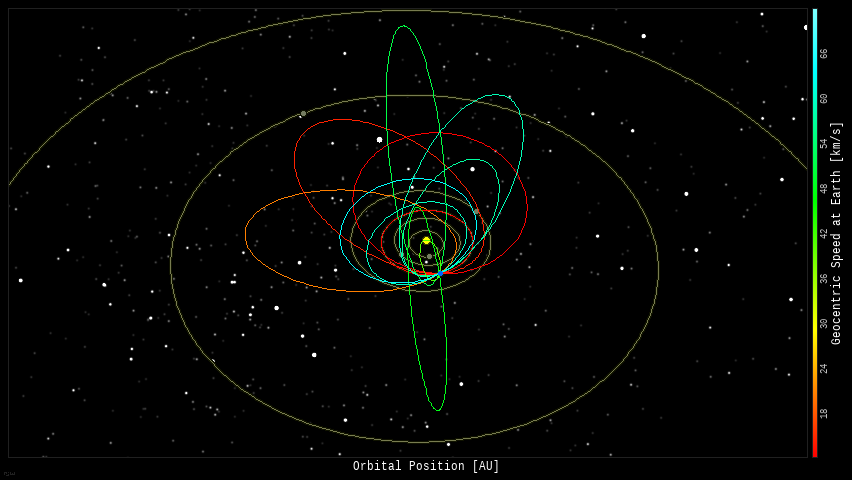
In this diagram of the inner solar system, all of the fireball orbits intersect at a single point--Earth. The orbits are color-coded by velocity, from slow (red) to fast (blue).
[Larger image] [movies]
Potentially Hazardous Asteroids ( PHAs)
are space rocks larger than approximately 100m that
can come closer to Earth than 0.05 AU. None of the
known PHAs is on a collision course with our planet,
although astronomers are finding new
ones all the time.
On July 9, 2026 there were 2349 potentially hazardous asteroids.
 |
Recent
& Upcoming Earth-asteroid encounters:
| Asteroid |
Date(UT) |
Miss Distance |
Velocity (km/s) |
Diameter (m) |
| 2026 NL |
2026-Jul-03 |
9.7 LD |
4.8 |
43 |
| 523808 |
2026-Jul-04 |
9.1 LD |
16.8 |
479 |
| 2026 ND |
2026-Jul-04 |
16.4 LD |
7.9 |
27 |
| 2026 MP3 |
2026-Jul-05 |
10.9 LD |
18.1 |
46 |
| 2023 YO1 |
2026-Jul-05 |
6.5 LD |
2.7 |
23 |
| 2026 NP |
2026-Jul-06 |
0.2 LD |
13 |
13 |
| 2026 NS |
2026-Jul-06 |
2.6 LD |
9.6 |
17 |
| 2026 NA |
2026-Jul-07 |
9.9 LD |
9.8 |
43 |
| 2026 NC |
2026-Jul-07 |
3.9 LD |
14.2 |
23 |
| 2026 NN |
2026-Jul-08 |
6.5 LD |
12.8 |
17 |
| 2026 MO1 |
2026-Jul-08 |
5.9 LD |
9.4 |
33 |
| 2026 MQ1 |
2026-Jul-10 |
11.9 LD |
10.4 |
47 |
| 2026 NH |
2026-Jul-10 |
5.4 LD |
13.3 |
26 |
| 2007 AA2 |
2026-Jul-11 |
17.8 LD |
7.2 |
43 |
| 2026 MQ3 |
2026-Jul-16 |
12.5 LD |
8.6 |
144 |
| 2025 PN7 |
2026-Jul-17 |
11.6 LD |
2.6 |
19 |
| 2026 NF |
2026-Jul-18 |
10.8 LD |
8.5 |
23 |
| 2026 NO |
2026-Jul-18 |
11 LD |
15.4 |
67 |
| 2025 MB90 |
2026-Jul-19 |
5 LD |
9.6 |
54 |
| 2020 OM |
2026-Jul-21 |
9.1 LD |
9.5 |
15 |
| 2026 KU3 |
2026-Jul-24 |
7.7 LD |
8.6 |
80 |
| 2020 UR1 |
2026-Jul-25 |
18.8 LD |
7.6 |
28 |
| 2015 BF |
2026-Jul-26 |
17.3 LD |
12.5 |
17 |
| 2025 OW |
2026-Jul-30 |
16.1 LD |
20.1 |
70 |
| 2024 RM10 |
2026-Aug-05 |
13.6 LD |
7.5 |
24 |
| 173561 |
2026-Aug-09 |
13.1 LD |
16.2 |
756 |
| 2019 NY2 |
2026-Aug-10 |
6.6 LD |
9.6 |
195 |
| 2016 BV14 |
2026-Aug-10 |
19.1 LD |
21.1 |
162 |
| 2013 QC11 |
2026-Aug-13 |
14.5 LD |
19 |
172 |
| 2025 AL2 |
2026-Aug-16 |
2.8 LD |
12.5 |
100 |
| 2025 DU7 |
2026-Aug-19 |
8.7 LD |
2.9 |
5 |
| 2025 FY11 |
2026-Aug-20 |
19.2 LD |
3.5 |
6 |
| 2023 RL |
2026-Aug-25 |
12.9 LD |
4.8 |
7 |
| 523609 |
2026-Aug-27 |
18.5 LD |
22.7 |
441 |
| 2025 QM9 |
2026-Aug-28 |
15.2 LD |
11.1 |
20 |
| 221455 |
2026-Aug-28 |
9.4 LD |
19 |
443 |
| 2017 BP31 |
2026-Aug-28 |
11.2 LD |
20.5 |
382 |
| 2007 EK |
2026-Aug-30 |
10.9 LD |
9.1 |
5 |
| 2017 RH16 |
2026-Aug-31 |
8.7 LD |
12.1 |
21 |
| 2025 CL3 |
2026-Sep-01 |
9.6 LD |
13.5 |
30 |
| 2018 RD2 |
2026-Sep-01 |
19.5 LD |
9.6 |
14 |
| 2025 QV5 |
2026-Sep-02 |
14.2 LD |
7.3 |
12 |
Notes: LD means
"Lunar Distance." 1 LD = 384,401 km, the distance
between Earth and the Moon. 1 LD also equals 0.00256
AU.
| |
Cosmic Rays in the Atmosphere |
SPACE WEATHER BALLOON DATA: Almost once a week, Spaceweather.com and the students of Earth to Sky Calculus fly space weather balloons to the stratosphere over California. These balloons are equipped with sensors that detect secondary cosmic rays, a form of radiation from space that can penetrate all the way down to Earth's surface. Our monitoring program has been underway without interruption for 10 years, resulting in a unique dataset of in situ atmospheric measurements.
Latest results (Nov. 2024): Atmospheric radiation is sharply decreasing in 2024. Our latest measurements in November registered a 10-year low:
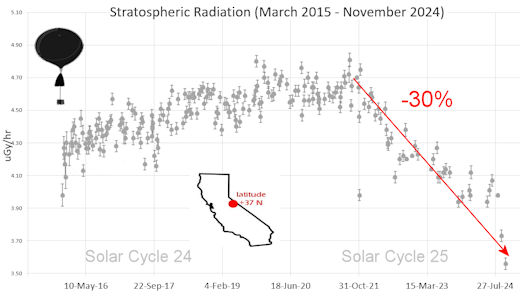
What's going on? Ironically, the radiation drop is caused by increasing solar activity. Solar Cycle 25 has roared to life faster than forecasters expected. The sun's strengthening and increasingly tangled magnetic field repels cosmic rays from deep space. In addition, solar coronal mass ejections (CMEs) sweep aside cosmic rays, causing sharp reductions called "Forbush Decreases." The two effects blend together to bring daily radiation levels down.
.Who cares? Cosmic rays are a surprisingly "down to Earth" form of space weather. They can alter the chemistry of the atmosphere, trigger lightning, and penetrate commercial airplanes. According to a study from the Harvard T.H. Chan school of public health, crews of aircraft have higher rates of cancer than the general population. The researchers listed cosmic rays, irregular sleep habits, and chemical contaminants as leading risk factors. A number of controversial studies (#1, #2, #3, #4) go even further, linking cosmic rays with cardiac arrhythmias and sudden cardiac death.
Technical notes: The radiation sensors onboard our helium balloons detect X-rays and gamma-rays in the energy range 10 keV to 20 MeV. These energies span the range of medical X-ray machines and airport security scanners.
Data points in the graph labeled "Stratospheric Radiation" correspond to the peak of the Regener-Pfotzer maximum, which lies about 67,000 feet above central California. When cosmic rays crash into Earth's atmosphere, they produce a spray of secondary particles that is most intense at the entrance to the stratosphere. Physicists Eric Regener and Georg Pfotzer discovered the maximum using balloons in the 1930s and it is what we are measuring today.
| |
The
official U.S. government space weather bureau |
| |
The
first place to look for information about sundogs,
pillars, rainbows and related phenomena. |
| |
Researchers
call it a "Hubble for the sun." SDO
is the most advanced solar observatory ever. |
| |
3D
views of the sun from NASA's Solar and Terrestrial
Relations Observatory |
| |
Realtime
and archival images of the Sun from SOHO. |
| |
information about sunspots based on the latest NOAA/USAF Active Region Summary |
| |
current counts of failed and deployed Starlink satellites from Jonathan's Space Page. See also, all satellite statistics. |
| |
Authoritative predictions of space junk and satellite re-entries |
| |
from
the NOAA Space Environment Center |
| |
fun to read, but should be taken with a grain of salt! Forecasts looking ahead more than a few days are often wrong. |
| |
from the NOAA Space Environment Center |
| |
the
underlying science of space weather |
 |
Got a chipped or cracked windshield that prevents you from seeing space weather events while driving? Get windshield replacement from SR Windows & Glass with free mobile auto glass service anywhere in the Phoenix area. |
| |
These links help Spaceweather.com stay online. Thank you to our supporters! |
|
|
| |
|
|
|
|
 |
|
|

|
©2021 Spaceweather.com. All rights reserved. This site is penned daily by Dr. Tony Phillips. |


