 | | | Switch to: Europe, USA, New Zealand, Antarctica Credit: NOAA/Ovation  Planetary K-index Planetary K-index
Now: Kp= 1 quiet
24-hr max: Kp= 4 unsettled
explanation | more data
Interplanetary Mag. Field
Btotal: 5.5 nT
Bz: -0.9 nT south
more data: ACE, DSCOVR
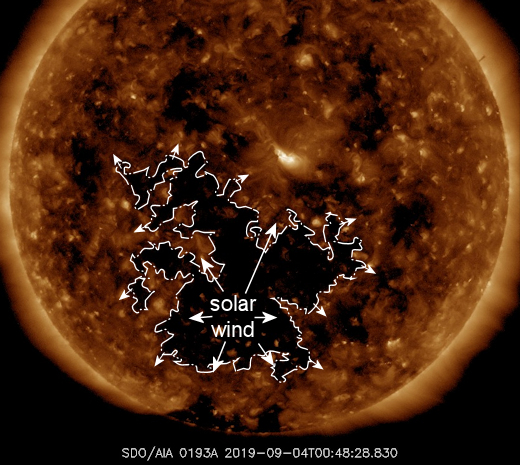
Updated: Today at 2351 UT Coronal Holes: 06 Sep 19 
Solar wind flowing from this southern coronal hole could reach Earth on Sept. 7-8. Credit: SDO/AIA
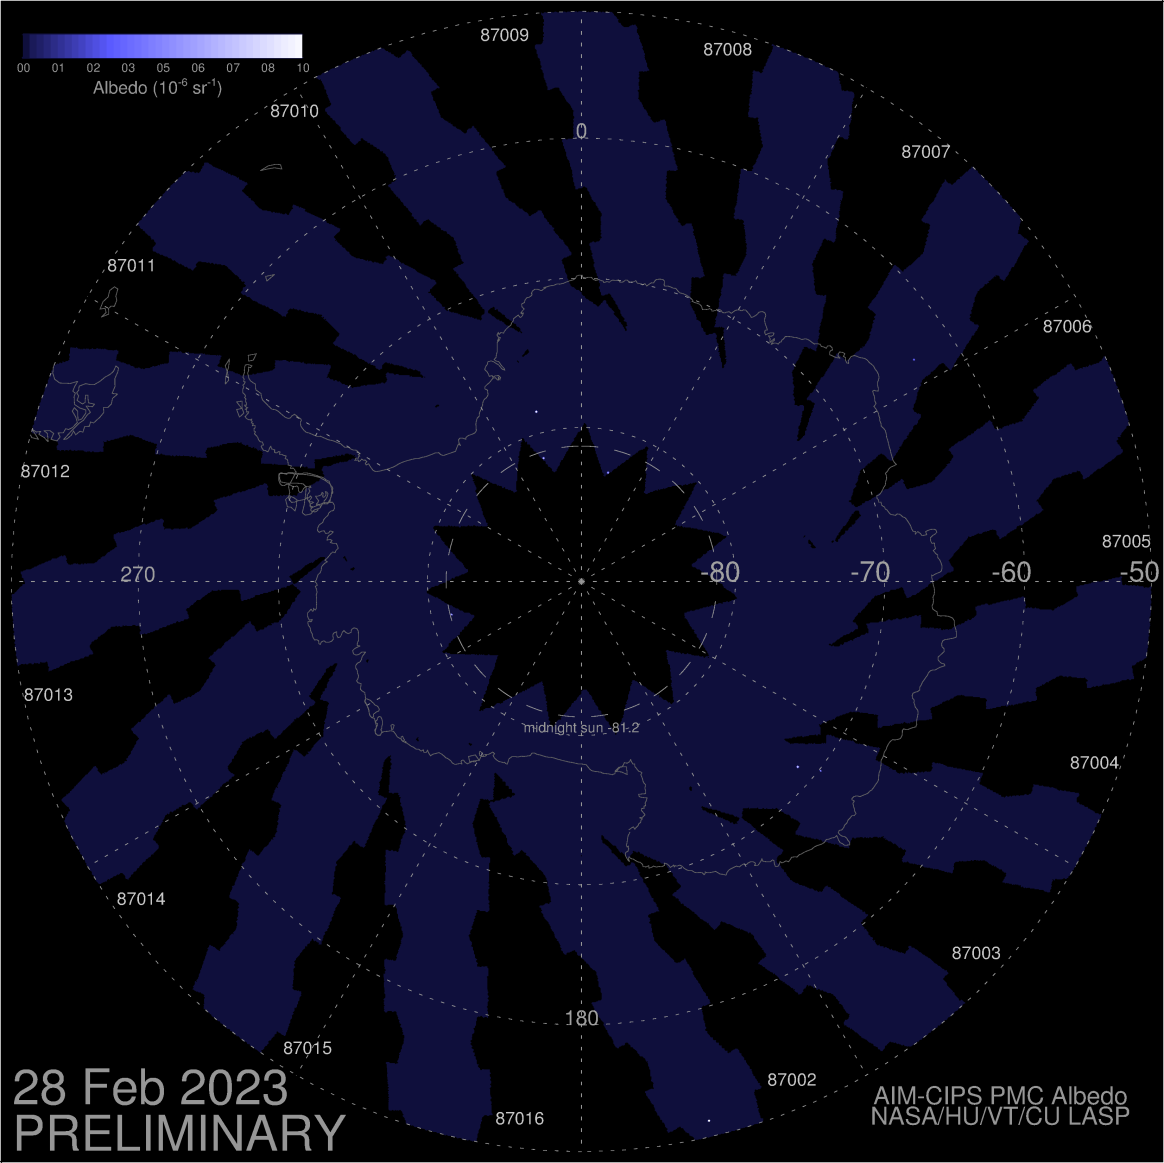
 Noctilucent Clouds The northern season for noctilucent clouds is about to end. NASA's AIM spacecraft is still showing a small number of electric-blue clouds around the Arctic Circle. Switch view: Europe, USA, Asia, Polar Updated at: 09-03-2019 13:55:02 Noctilucent Clouds The northern season for noctilucent clouds is about to end. NASA's AIM spacecraft is still showing a small number of electric-blue clouds around the Arctic Circle. Switch view: Europe, USA, Asia, Polar Updated at: 09-03-2019 13:55:02 SPACE WEATHER
NOAA Forecasts | | Updated at: 2019 Sep 06 2200 UTC FLARE | 0-24 hr | 24-48 hr | CLASS M | 01 % | 01 % | CLASS X | 01 % | 01 % | Geomagnetic Storms:
Probabilities for significant disturbances in Earth's magnetic field are given for three activity levels: active, minor storm, severe storm Updated at: 2019 Sep 06 2200 UTC Mid-latitudes | 0-24 hr | 24-48 hr | ACTIVE | 10 % | 10 % | MINOR | 01 % | 01 % | SEVERE | 01 % | 01 % | High latitudes | 0-24 hr | 24-48 hr | ACTIVE | 20 % | 20 % | MINOR | 25 % | 25 % | SEVERE | 15 % | 15 % | | | |  | | | | | | | | | | | Special Offer: SAVE 600nok per person. Book a combination aurora borealis chase and scenic day tour during the months of September, October or November 2019 for the special price of 1800 kr. Check Marianne's webpage for details! | | | ARCTIC AURORA WATCH: A southern hole in the sun's atmosphere is spewing a stream of solar wind into space. The gaseous material could graze our planet's magnetic field on Sept. 7th or 8th, causing minor geomagnetic unrest and auroras around the Arctic Circle. At this time of year, auroras can mix with polar twilight to form uniquely beautiful photo-ops, so even minor unrest is worth watching. Aurora alerts: SMS Text THE RETURN OF STEVE: Sky watchers are still sorting out all the things they saw during last weekend's Labor Day geomagnetic storm. Upon further review, not every light in the sky was the aurora borealis. There was also STEVE: 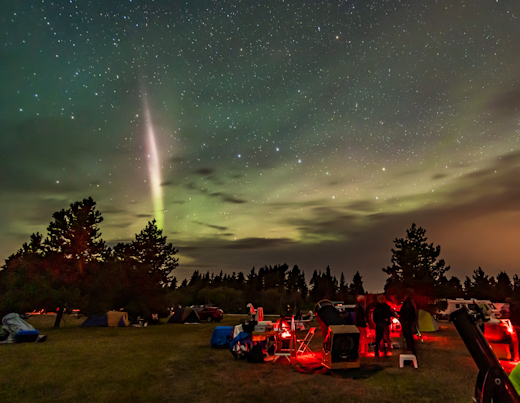
"Look at the mauve-colored plume. That's STEVE," says Alan Dyer, who took the picture at the Saskatchewan Summer Star Party on Aug. 31st. "We saw STEVE two nights in a row from our area in western Canada."
STEVE (Strong Thermal Emission Velocity Enhancement) looks like an aurora, but it is not. The phenomenon is caused by hot (3000°C) ribbons of gas flowing through Earth's magnetosphere at speeds exceeding 6 km/s (13,000 mph). These ribbons appear during some geomagnetic storms, revealing themselves by their soft purple glow.
Earlier this year, researchers led by Toshi Nishimura of Boston University published an important paper about STEVE. Using data from NASA's THEMIS spacecraft, they located STEVE's power source: Magnetic explosions called 'substorms' more than 22,000 km above Earth's surface hurl streams of hot plasma toward Earth. When the material reaches an altitude ~250 km above Earth's surface, it begins to emit a mauve light.
There's more. THEMIS data showed that the same explosions can spray energetic electrons toward Earth. These electrons move even deeper into the atmosphere, all the way down to 100 km, where they ignite a form of green auroras called "the picket fence." Indeed, many sky watchers saw the picket fence beneath STEVE over Labor Day weekend: 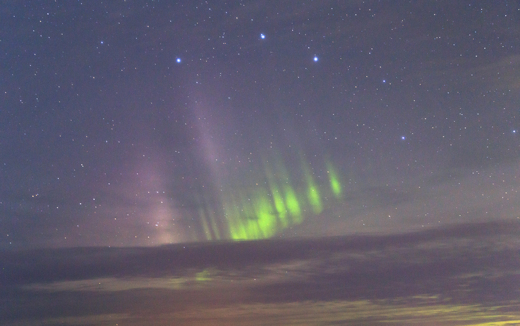
"STEVE and the green pickets were quite strong underneath the handle of the Big Dipper," says Philip Granrud, who took the picture from Kalispell, Montana, on Sept. 1st. "It was beautiful!" Nishimura's study showed that STEVE and the green pickets are inextricably connected. "They are two different manifestations of a single magnetic explosion high above Earth," explains Nishimura. "The picket fence is an aurora. STEVE is not. Nevertheless, they are linked."
The colors of the display are only partially understood. Picket fences are green because of oxygen, which emits green photons when it is pummeled by energetic electrons. The purple color of STEVE ... is still a mystery. "We are looking at this more closely in a follow-up study," says Nishimura. "We suspect that nitrogen is involved, but we are not yet certain."
Ready for more? Good news. The season for STEVE is now. Studies show that STEVE tends to occur more frequently during spring and fall than summer and winter. The onset of northern autumn, only weeks away, seems to lure the arc out of summer hiding. Aurora alerts: SMS Text A sharable version of this story is available here. Realtime STEVE Photo Gallery
Free: Spaceweather.com Newsletter THE ANTARES PENDANT: Are you looking for a far-out gift? Consider the Antares Pendant. On Aug. 19, 2019, the students of Earth to Sky Calculus launched a cosmic ray balloon to the edge of space, 104,002 ft high. This ruby-red crystal necklace went along for the ride:
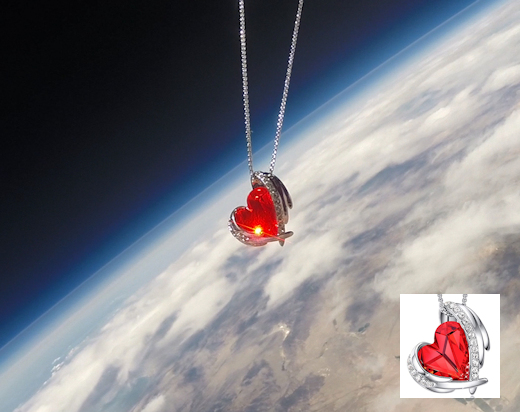
You can have it for $179.95. The students are selling these white gold-plated pendants to support their cosmic ray ballooning program. The glittering Swarovski crystal has a deep ruby hue inspired by the red-supergiant star Antares in Scorpio. Each one comes with greeting card showing the pendant in flight and telling the story of its journey to the edge of space and back again. Far Out Gifts: Earth to Sky Store
All sales support hands-on STEM education A HORSESHOE VORTEX CLOUD: Talk about a lucky shot. Yesterday in Finland, Matti Helin looked up and saw one of the rarest of all clouds spinning right next to a rainbow. "I couldn't believe my eyes," says Helin. "It was a gorgeous horseshoe vortex!" 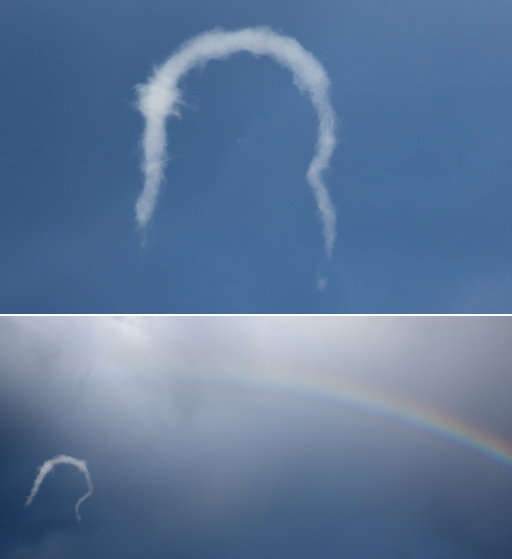
"I was already a bit late for work when I saw the vortex," says Helin. "Taking these pictures made me even later." These unusual clouds form when a small cumulus cloud drifts over a column of rising warm air. The rising air rolls the cumulus cloud into a spinning vortex. When the ends of the vortex droop, as happened over Finland, the vortex turns into a "horseshoe."
"It was alive for about five minutes," says Helin. "I was very lucky indeed." Realtime Space Weather Photo Gallery
Free: Spaceweather.com Newsletter
Realtime Aurora Photo Gallery
Free: Spaceweather.com Newsletter
Every night, a network of NASA all-sky cameras scans the skies above the United States for meteoritic fireballs. Automated software maintained by NASA's Meteoroid Environment Office calculates their orbits, velocity, penetration depth in Earth's atmosphere and many other characteristics. Daily results are presented here on Spaceweather.com. On Sep. 6, 2019, the network reported 19 fireballs.
(14 sporadics, 2 September epsilon Perseids, 2 Northern iota Aquariids, 1 alpha Aurigid)  In this diagram of the inner solar system, all of the fireball orbits intersect at a single point--Earth. The orbits are color-coded by velocity, from slow (red) to fast (blue). [Larger image] [movies] Potentially Hazardous Asteroids ( PHAs) are space rocks larger than approximately 100m that can come closer to Earth than 0.05 AU. None of the known PHAs is on a collision course with our planet, although astronomers are finding new ones all the time. On September 6, 2019 there were 2015 potentially hazardous asteroids.
 | Recent & Upcoming Earth-asteroid encounters: | Asteroid | Date(UT) | Miss Distance | Velocity (km/s) | Diameter (m) | | 2019 RL | 2019-Sep-01 | 19.8 LD | 12.7 | 35 | | 2019 QA5 | 2019-Sep-02 | 5.7 LD | 13.5 | 21 | | 2019 RE1 | 2019-Sep-02 | 3.8 LD | 7.4 | 6 | | 2019 RQ | 2019-Sep-02 | 0.3 LD | 13.2 | 3 | | 2019 QX1 | 2019-Sep-02 | 18.9 LD | 16.8 | 30 | | 2019 OF2 | 2019-Sep-03 | 18.3 LD | 10.7 | 53 | | 2018 DE1 | 2019-Sep-03 | 12.7 LD | 6.6 | 28 | | 2019 QX3 | 2019-Sep-04 | 11.2 LD | 17.8 | 32 | | 2019 RZ | 2019-Sep-04 | 12.4 LD | 15.9 | 28 | | 2019 RF1 | 2019-Sep-04 | 3.5 LD | 6 | 6 | | 2019 QE1 | 2019-Sep-05 | 13.2 LD | 6.6 | 34 | | 2019 RM1 | 2019-Sep-05 | 8.2 LD | 7.6 | 10 | | 2019 RD1 | 2019-Sep-06 | 6.1 LD | 7.1 | 15 | | 2019 GT3 | 2019-Sep-06 | 19.5 LD | 13.6 | 221 | | 2019 RA | 2019-Sep-07 | 4.5 LD | 5.7 | 29 | | 2019 RC1 | 2019-Sep-07 | 0.5 LD | 20.3 | 6 | | 2019 QZ | 2019-Sep-08 | 15.7 LD | 4.3 | 21 | | 2019 QZ3 | 2019-Sep-09 | 9.7 LD | 7.5 | 41 | | 2019 QY4 | 2019-Sep-10 | 2.5 LD | 7.8 | 9 | | 2019 RH | 2019-Sep-10 | 7 LD | 16.8 | 22 | | 2019 RJ1 | 2019-Sep-12 | 10.8 LD | 10.4 | 15 | | 2010 RM82 | 2019-Sep-13 | 18.2 LD | 14.6 | 23 | | 2013 CV83 | 2019-Sep-13 | 16.1 LD | 13.1 | 62 | | 504800 | 2019-Sep-14 | 13.9 LD | 14.4 | 155 | | 2019 RT | 2019-Sep-14 | 13.8 LD | 16.7 | 48 | | 467317 | 2019-Sep-14 | 13.9 LD | 6.4 | 389 | | 2019 JF1 | 2019-Sep-16 | 11.2 LD | 4.3 | 62 | | 2018 FU1 | 2019-Sep-16 | 18.4 LD | 4.7 | 16 | | 2019 RC | 2019-Sep-16 | 17.5 LD | 15.1 | 162 | | 2017 SL16 | 2019-Sep-21 | 7.9 LD | 6.5 | 25 | | 2017 SM21 | 2019-Sep-21 | 11.5 LD | 9.6 | 20 | | 2019 QZ1 | 2019-Sep-22 | 12.5 LD | 8.2 | 77 | | 523934 | 2019-Sep-24 | 10.9 LD | 22.3 | 257 | | 2019 QY3 | 2019-Sep-26 | 13.9 LD | 8.4 | 41 | | 2017 KP27 | 2019-Sep-26 | 6.2 LD | 4.8 | 25 | | 2006 QV89 | 2019-Sep-27 | 18.1 LD | 4.1 | 31 | | 2018 FK5 | 2019-Oct-01 | 13.3 LD | 10.5 | 8 | | 2018 LG4 | 2019-Oct-02 | 13.8 LD | 8.1 | 12 | | 2017 TJ4 | 2019-Oct-05 | 13.5 LD | 8.9 | 32 | | 2019 RK | 2019-Oct-08 | 16.8 LD | 3 | 32 | | 162082 | 2019-Oct-25 | 16.2 LD | 11.2 | 589 | | 2017 TG5 | 2019-Oct-25 | 14.4 LD | 11.9 | 34 | | 2015 JD1 | 2019-Nov-03 | 12.9 LD | 11.9 | 269 | Notes: LD means "Lunar Distance." 1 LD = 384,401 km, the distance between Earth and the Moon. 1 LD also equals 0.00256 AU. MAG is the visual magnitude of the asteroid on the date of closest approach. | | Cosmic Rays in the Atmosphere | SOMETHING NEW! We have developed a new predictive model of aviation radiation. It's called E-RAD--short for Empirical RADiation model. We are constantly flying radiation sensors onboard airplanes over the US and and around the world, so far collecting more than 22,000 gps-tagged radiation measurements. Using this unique dataset, we can predict the dosage on any flight over the USA with an error no worse than 15%. E-RAD lets us do something new: Every day we monitor approximately 1400 flights criss-crossing the 10 busiest routes in the continental USA. Typically, this includes more than 80,000 passengers per day. E-RAD calculates the radiation exposure for every single flight. The Hot Flights Table is a daily summary of these calculations. It shows the 5 charter flights with the highest dose rates; the 5 commercial flights with the highest dose rates; 5 commercial flights with near-average dose rates; and the 5 commercial flights with the lowest dose rates. Passengers typically experience dose rates that are 20 to 70 times higher than natural radiation at sea level. To measure radiation on airplanes, we use the same sensors we fly to the stratosphere onboard Earth to Sky Calculus cosmic ray balloons: neutron bubble chambers and X-ray/gamma-ray Geiger tubes sensitive to energies between 10 keV and 20 MeV. These energies span the range of medical X-ray machines and airport security scanners. Column definitions: (1) The flight number; (2) The maximum dose rate during the flight, expressed in units of natural radiation at sea level; (3) The maximum altitude of the plane in feet above sea level; (4) Departure city; (5) Arrival city; (6) Duration of the flight. SPACE WEATHER BALLOON DATA: Approximately once a week, Spaceweather.com and the students of Earth to Sky Calculus fly space weather balloons to the stratosphere over California. These balloons are equipped with radiation sensors that detect cosmic rays, a surprisingly "down to Earth" form of space weather. Cosmic rays can seed clouds, trigger lightning, and penetrate commercial airplanes. Furthermore, there are studies ( #1, #2, #3, #4) linking cosmic rays with cardiac arrhythmias and sudden cardiac death in the general population. Our latest measurements show that cosmic rays are intensifying, with an increase of more than 18% since 2015: 
The data points in the graph above correspond to the peak of the Reneger-Pfotzer maximum, which lies about 67,000 feet above central California. When cosmic rays crash into Earth's atmosphere, they produce a spray of secondary particles that is most intense at the entrance to the stratosphere. Physicists Eric Reneger and Georg Pfotzer discovered the maximum using balloons in the 1930s and it is what we are measuring today. En route to the stratosphere, our sensors also pass through aviation altitudes: 
In this plot, dose rates are expessed as multiples of sea level. For instance, we see that boarding a plane that flies at 25,000 feet exposes passengers to dose rates ~10x higher than sea level. At 40,000 feet, the multiplier is closer to 50x. The radiation sensors onboard our helium balloons detect X-rays and gamma-rays in the energy range 10 keV to 20 MeV. These energies span the range of medical X-ray machines and airport security scanners. Why are cosmic rays intensifying? The main reason is the sun. Solar storm clouds such as coronal mass ejections (CMEs) sweep aside cosmic rays when they pass by Earth. During Solar Maximum, CMEs are abundant and cosmic rays are held at bay. Now, however, the solar cycle is swinging toward Solar Minimum, allowing cosmic rays to return. Another reason could be the weakening of Earth's magnetic field, which helps protect us from deep-space radiation. | | The official U.S. government space weather bureau | | | The first place to look for information about sundogs, pillars, rainbows and related phenomena. | | | Researchers call it a "Hubble for the sun." SDO is the most advanced solar observatory ever. | | | 3D views of the sun from NASA's Solar and Terrestrial Relations Observatory | | | Realtime and archival images of the Sun from SOHO. | | | from the NOAA Space Environment Center | | | fun to read, but should be taken with a grain of salt! Forecasts looking ahead more than a few days are often wrong. | | | from the NOAA Space Environment Center | | | the underlying science of space weather |  | To find reviews of new online casino sites in the UK try The Casino DB where there are hundreds of online casino reviews complete with bonuses and ratings. Looking for a new online casino? Try Casimpo the new site dedicated to making online casino simple and easy for all. | | | These links help Spaceweather.com stay online. Thank you to our supporters! | | | | | | | | |  | | |  | ©2018 Spaceweather.com. All rights reserved. This site is penned daily by Dr. Tony Phillips. | |


