On October 23rd there will be a partial eclipse of the Sun. Got clouds? No problem. The event will be broadcast live on the web by the Coca-Cola Science Center. | | |
QUIET SUN: Solar activity is low, and the quiet is likely to continue. Not one of the eight sunspot groups on the disk of the sun has the type of unstable magnetic field that poses a threat for strong eruptions. NOAA forecasters estimate a scant 5% chance of M-flares on Oct. 6th. Solar flare alerts: text, voice
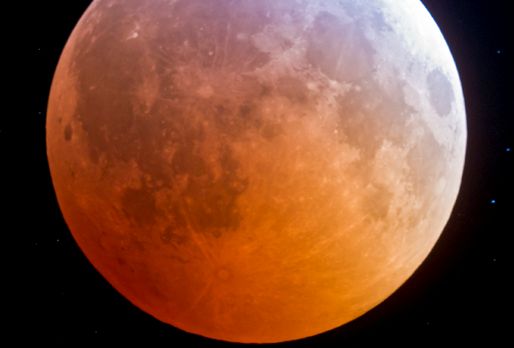
DON'T MISS THE LUNAR ECLIPSE: On Wednesday morning, Oct. 8th, there will be a total lunar eclipse. Observers across the Pacific side of Earth can see the normally-pale full Moon turn a beautiful shade of red as it passes through the sunset-colored shadow of our planet. The Moon first dips into Earth's shadow at approximately 9:15 UT (2:15 a.m. PDT), kicking off the partial phase of the eclipse. Totality, when the Moon is fully immersed, begins at 10:25 UT (3:25 a.m. PDT) and lasts for nearly an hour. During that time, the Moon will look something like this:

Alan Dyer took the picture during a similar eclipse over Gleichen, Alberta, on Dec. 21, 2010. "The coppery Moon framed by the bright stars of winter was a wonderful sight," he says.
Because the Moon is in shadow during an eclipse, it should be dark, right? Obviously not. A quick trip to the Moon explains the bright red color: Imagine yourself standing on a dusty lunar plain looking up at the sky. Overhead hangs Earth, nightside down, completely hiding the sun behind it. The eclipse is underway.
You might expect Earth seen in this way to be utterly dark, but it's not. The rim of the planet is on fire! As you scan your eye around Earth's circumference, you're seeing every sunrise and every sunset in the world, all of them, all at once. This incredible light beams into the heart of Earth's shadow, filling it with a coppery glow and transforming the Moon into a great red orb.
Oct. 8th: Don't miss it! Eclipse resources: NASA video, animated eclipse, live webcast.
Realtime Eclipse Photo Gallery
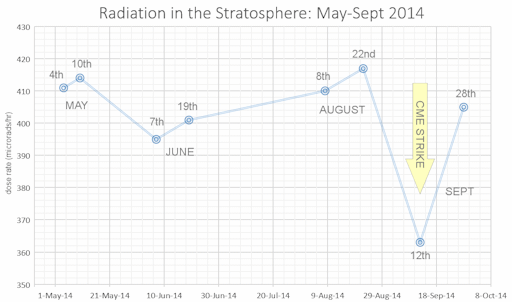
THE "FORBUSH REBOUND": Radiation levels in the stratosphere are back to normal, according to a Space Weather Buoy that has just returned from the stratosphere. This rebound follows a mid-September dip caused by one of the strongest solar storms in years.
The story begins three weeks ago. On Sept. 12th a CME hit Earth head-on, sparking a G3-class geomagnetic storm. Using a helium balloon, the students of Earth to Sky Calculus launched a radiation sensor into the storm, expecting to measure an increase in energetic particles. Instead of more, however, they measured less. The CME had swept away many of the cosmic rays around Earth and so radiation levels in the stratosphere dropped. The CME was long gone on Sept. 28th when they repeated the experiment and found radiation levels returning to pre-storm values:

The drop in radiation is called a "Forbush Decrease" after the 20th century physicist Scott Forbush who first described it. That would make the bounce-back a "Forbush Rebound." According to the data, the rebound took less than two weeks and possibly only a few days. The next time a CME hits, the students plan to launch balloons with a faster cadence to better measure the stratosphere's response time.
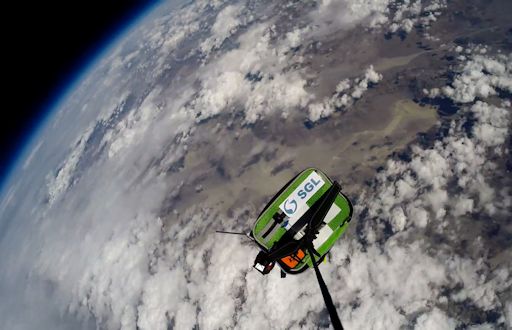
Pictured below is the group's Space Weather Buoy--an insulated capsule containing an X-ray/gamma-ray detector (10 keV - 20 MeV), multiple video cameras, GPS trackers, and other sensors. The payload was 108,700 feet above the Death Valley National Park when an overhead camera took this selfie:

In collaboration with Spaceweather.com, the students of Earth to Sky Calculus have been launching these buoys on a regular basis to study the effect of solar activity on Earth's upper atmosphere. Since Oct. 2013, they have flown the radiation sensor 17 times, providing a unique baseline of high-altitude radiation measurements for the current solar cycle. Soon they will release their analysis of an entire year's worth of measurements.
HEY, THANKS! The students wish to thank Sander Geophysics Ltd (SGL) for sponsoring this flight. Note their logo in the upper right corner of the payload. SGL's generous contribution of $500 paid for the helium and other supplies necessary to get this research off the ground. Readers, if you would like to sponsor an upcoming flight and see your logo at the edge of space, please contact Dr. Tony Phillips to make arrangements.
Realtime Space Weather Photo Gallery
Realtime Aurora Photo Gallery
Realtime Comet Photo Gallery
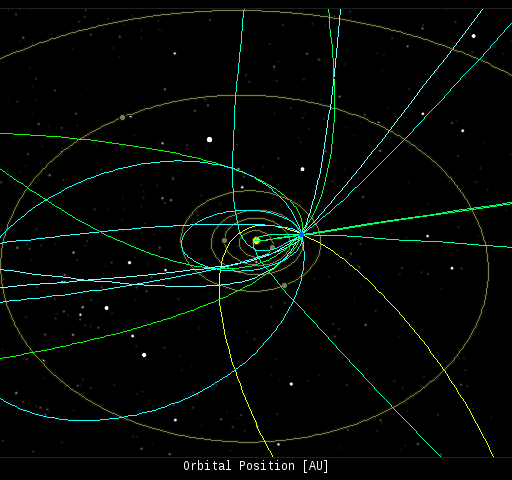
Every night, a network of NASA all-sky cameras scans the skies above the United States for meteoritic fireballs. Automated software maintained by NASA's Meteoroid Environment Office calculates their orbits, velocity, penetration depth in Earth's atmosphere and many other characteristics. Daily results are presented here on Spaceweather.com.
On Oct. 6, 2014, the network reported 13 fireballs.
(13 sporadics)

In this diagram of the inner solar system, all of the fireball orbits intersect at a single point--Earth. The orbits are color-coded by velocity, from slow (red) to fast (blue). [Larger image] [movies]
Potentially Hazardous Asteroids (
PHAs) are space rocks larger than approximately 100m that can come closer to Earth than 0.05 AU. None of the known PHAs is on a collision course with our planet, although astronomers are finding
new ones all the time.
On October 6, 2014 there were potentially hazardous asteroids.
Notes: LD means "Lunar Distance." 1 LD = 384,401 km, the distance between Earth and the Moon. 1 LD also equals 0.00256 AU. MAG is the visual magnitude of the asteroid on the date of closest approach. | | The official U.S. government space weather bureau |
| | The first place to look for information about sundogs, pillars, rainbows and related phenomena. |
| | Researchers call it a "Hubble for the sun." SDO is the most advanced solar observatory ever. |
| | 3D views of the sun from NASA's Solar and Terrestrial Relations Observatory |
| | Realtime and archival images of the Sun from SOHO. |
| | from the NOAA Space Environment Center |
| | the underlying science of space weather |

