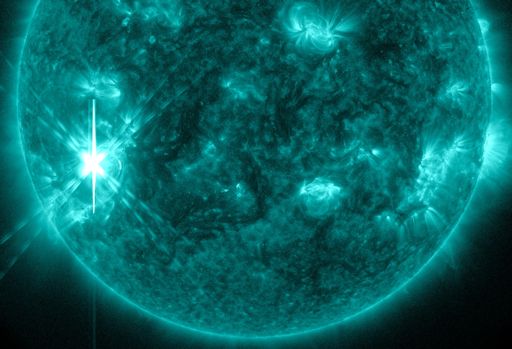
When is the best time to see auroras? Where is the best place to go? And how do you photograph them? These questions and more are answered in a new book, Northern Lights - a Guide, by Pal Brekke & Fredrik Broms. | | | SUNSET PLANETS: When the sun goes down tonight, step outside and look southwest. Venus and the crescent Moon are having a get-together, less than 10o apart. Try to catch them before the sky fades to black. A Moon-Venus pair surrounded by twilight-blue is one of the prettiest sights in the heavens. [sky map] [photo gallery] SOLAR FLARE CAUSES RARE 'MAGNETIC CROCHET': On Nov. 5th at 22:12 UT, the magnetic canopy of sunspot AR1890 erupted, producing a brief but intense X3-class solar flare. NASA's Solar Dynamics Observatory recorded the extreme ultraviolet flash: 
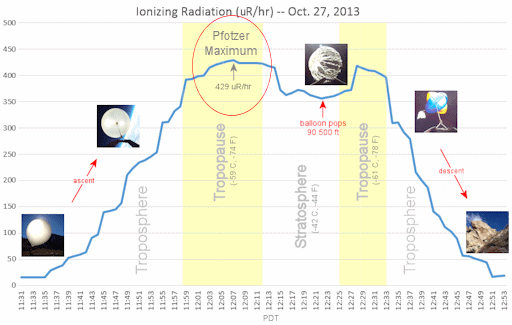
Radiation from the flare caused a surge in the ionization of Earth's upper atmosphere--and this led to a rare magnetic crochet. Alexander Avtanski observed the effect using a homemade magnetometer in San Jose, California. A magnetic crochet is a disturbance in Earth's magnetic field caused by electrical currents flowing in air 60 km to 100 km above our heads. Unlike geomagnetic disturbances that arrive with CMEs days after a flare, a magnetic crochet occurs while the flare is in progress. They tend to occur during fast impulsive flares like this one. More eruptions are in the offing. NOAA forecasters estimate a 45% chance of M-class solar flares and a 10% chance of X-flares on Nov. 6th. Solar flare alerts: text, voice. Realtime Space Weather Photo Gallery RE-DISCOVERING THE PFOTZER MAXIMUM: On Oct. 27th, when the students of Earth to Sky Calculus launched a pair of radiation sensors to the stratosphere onboard a helium balloon, they didn't know what to expect. This just in: They have re-discovered the Pfotzer Maximum. Most people have never heard of it. The Pfotzer Maximum is a layer of peak radiation about 20 km above Earth's surface. Take a look at this data plot from the team's space weather balloon and keep reading below for more information: 
The plot shows a complete profile of ionizing radiation between 2.7 km and 27 km above Earth's surface. Data from their sensor counted X-rays and gamma-rays in the energy range 10.0 KeV to 20.0 MeV. A peak in radiation levels occured in the tropopause--that's the Pfotzer Maximum. When cosmic rays crash into Earth's atmosphere, they produce a spray of secondary particles. With increasing depth in the atmosphere, the primary cosmic radiation component decreases, whereas the secondary radiation component increases. This complex situation results in a maximum of the dose rate at an altitude of ~20 km, the so-called "Pfotzer maximum," named after physicist George Pfotzer who discovered the peak using balloons and Geiger tubes in the 1930s. The Earth to Sky experiment was prompted by a recent NASA report concerning the effects of space weather on aviation. Like astronauts, ordinary air travelers can be exposed to significant doses of radiation when the sun is active. Data collected by balloon-borne sensors can be used to check and improve research models of radiation percolating through Earth's atmosphere. The students are ready to fly their sensors again. A radiation storm in the week ahead is a possibility as solar activity remains high. If one erupts, they plan to revisit the Pfotzer Maximum to find out how it reacts. Stay tuned. Solar flare alerts: text, voice. Realtime Space Weather Photo Gallery
Realtime Comet ISON Photo Gallery
Realtime Aurora Photo Gallery Every night, a network of NASA all-sky cameras scans the skies above the United States for meteoritic fireballs. Automated software maintained by NASA's Meteoroid Environment Office calculates their orbits, velocity, penetration depth in Earth's atmosphere and many other characteristics. Daily results are presented here on Spaceweather.com. On Nov. 6, 2013, the network reported 14 fireballs.
(8 sporadics, 5 Northern Taurids, 1 Orionid) 
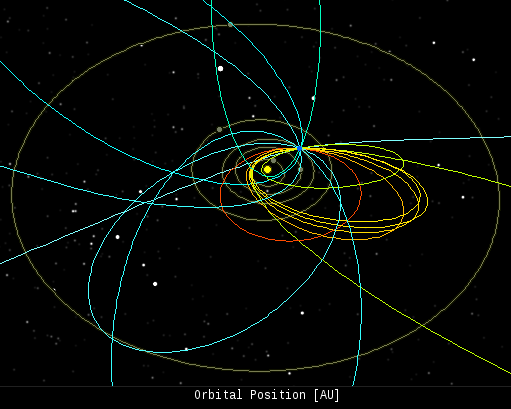
In this diagram of the inner solar system, all of the fireball orbits intersect at a single point--Earth. The orbits are color-coded by velocity, from slow (red) to fast (blue). [Larger image] [movies] Potentially Hazardous Asteroids ( PHAs) are space rocks larger than approximately 100m that can come closer to Earth than 0.05 AU. None of the known PHAs is on a collision course with our planet, although astronomers are finding new ones all the time. On November 6, 2013 there were 1437 potentially hazardous asteroids. Notes: LD means "Lunar Distance." 1 LD = 384,401 km, the distance between Earth and the Moon. 1 LD also equals 0.00256 AU. MAG is the visual magnitude of the asteroid on the date of closest approach. | | The official U.S. government space weather bureau | | | The first place to look for information about sundogs, pillars, rainbows and related phenomena. | | | Researchers call it a "Hubble for the sun." SDO is the most advanced solar observatory ever. | | | 3D views of the sun from NASA's Solar and Terrestrial Relations Observatory | | | Realtime and archival images of the Sun from SOHO. | | | from the NOAA Space Environment Center | | | the underlying science of space weather | | 
