 | | | Switch to: Europe, USA, New Zealand, Antarctica Credit: NOAA/Ovation  Planetary K-index Planetary K-index
Now: Kp= 3 quiet
24-hr max: Kp= 3 quiet
explanation | more data
Interplanetary Mag. Field
Btotal: 5.8 nT
Bz: -1.1 nT south
more data: ACE, DSCOVR
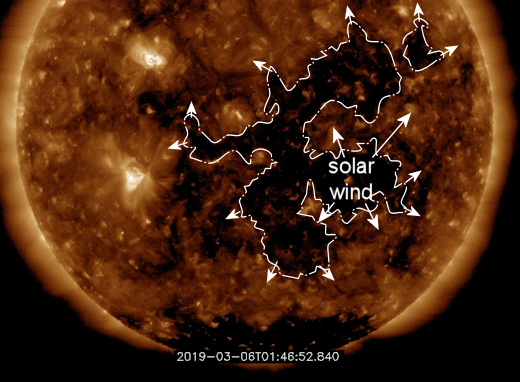
Updated: Today at 2348 UT Coronal Holes: 07 Mar 19 
Solar wind flowing from these coronal holes could reach Earth on March 7-9. Credit: SDO/AIA
 Noctilucent Clouds The southern season for noctilucent clouds (NLCs) is ending. NASA's AIM spacecraft is detecting a sharp decline in electric blue clouds at the edge of space over Antarctica. Switch view: Europe, USA, Asia, Polar Updated at: 03-02-2019 16:55:03 Noctilucent Clouds The southern season for noctilucent clouds (NLCs) is ending. NASA's AIM spacecraft is detecting a sharp decline in electric blue clouds at the edge of space over Antarctica. Switch view: Europe, USA, Asia, Polar Updated at: 03-02-2019 16:55:03 SPACE WEATHER
NOAA Forecasts | | Updated at: 2019 Mar 07 2200 UTC FLARE | 0-24 hr | 24-48 hr | CLASS M | 01 % | 01 % | CLASS X | 01 % | 01 % | Geomagnetic Storms:
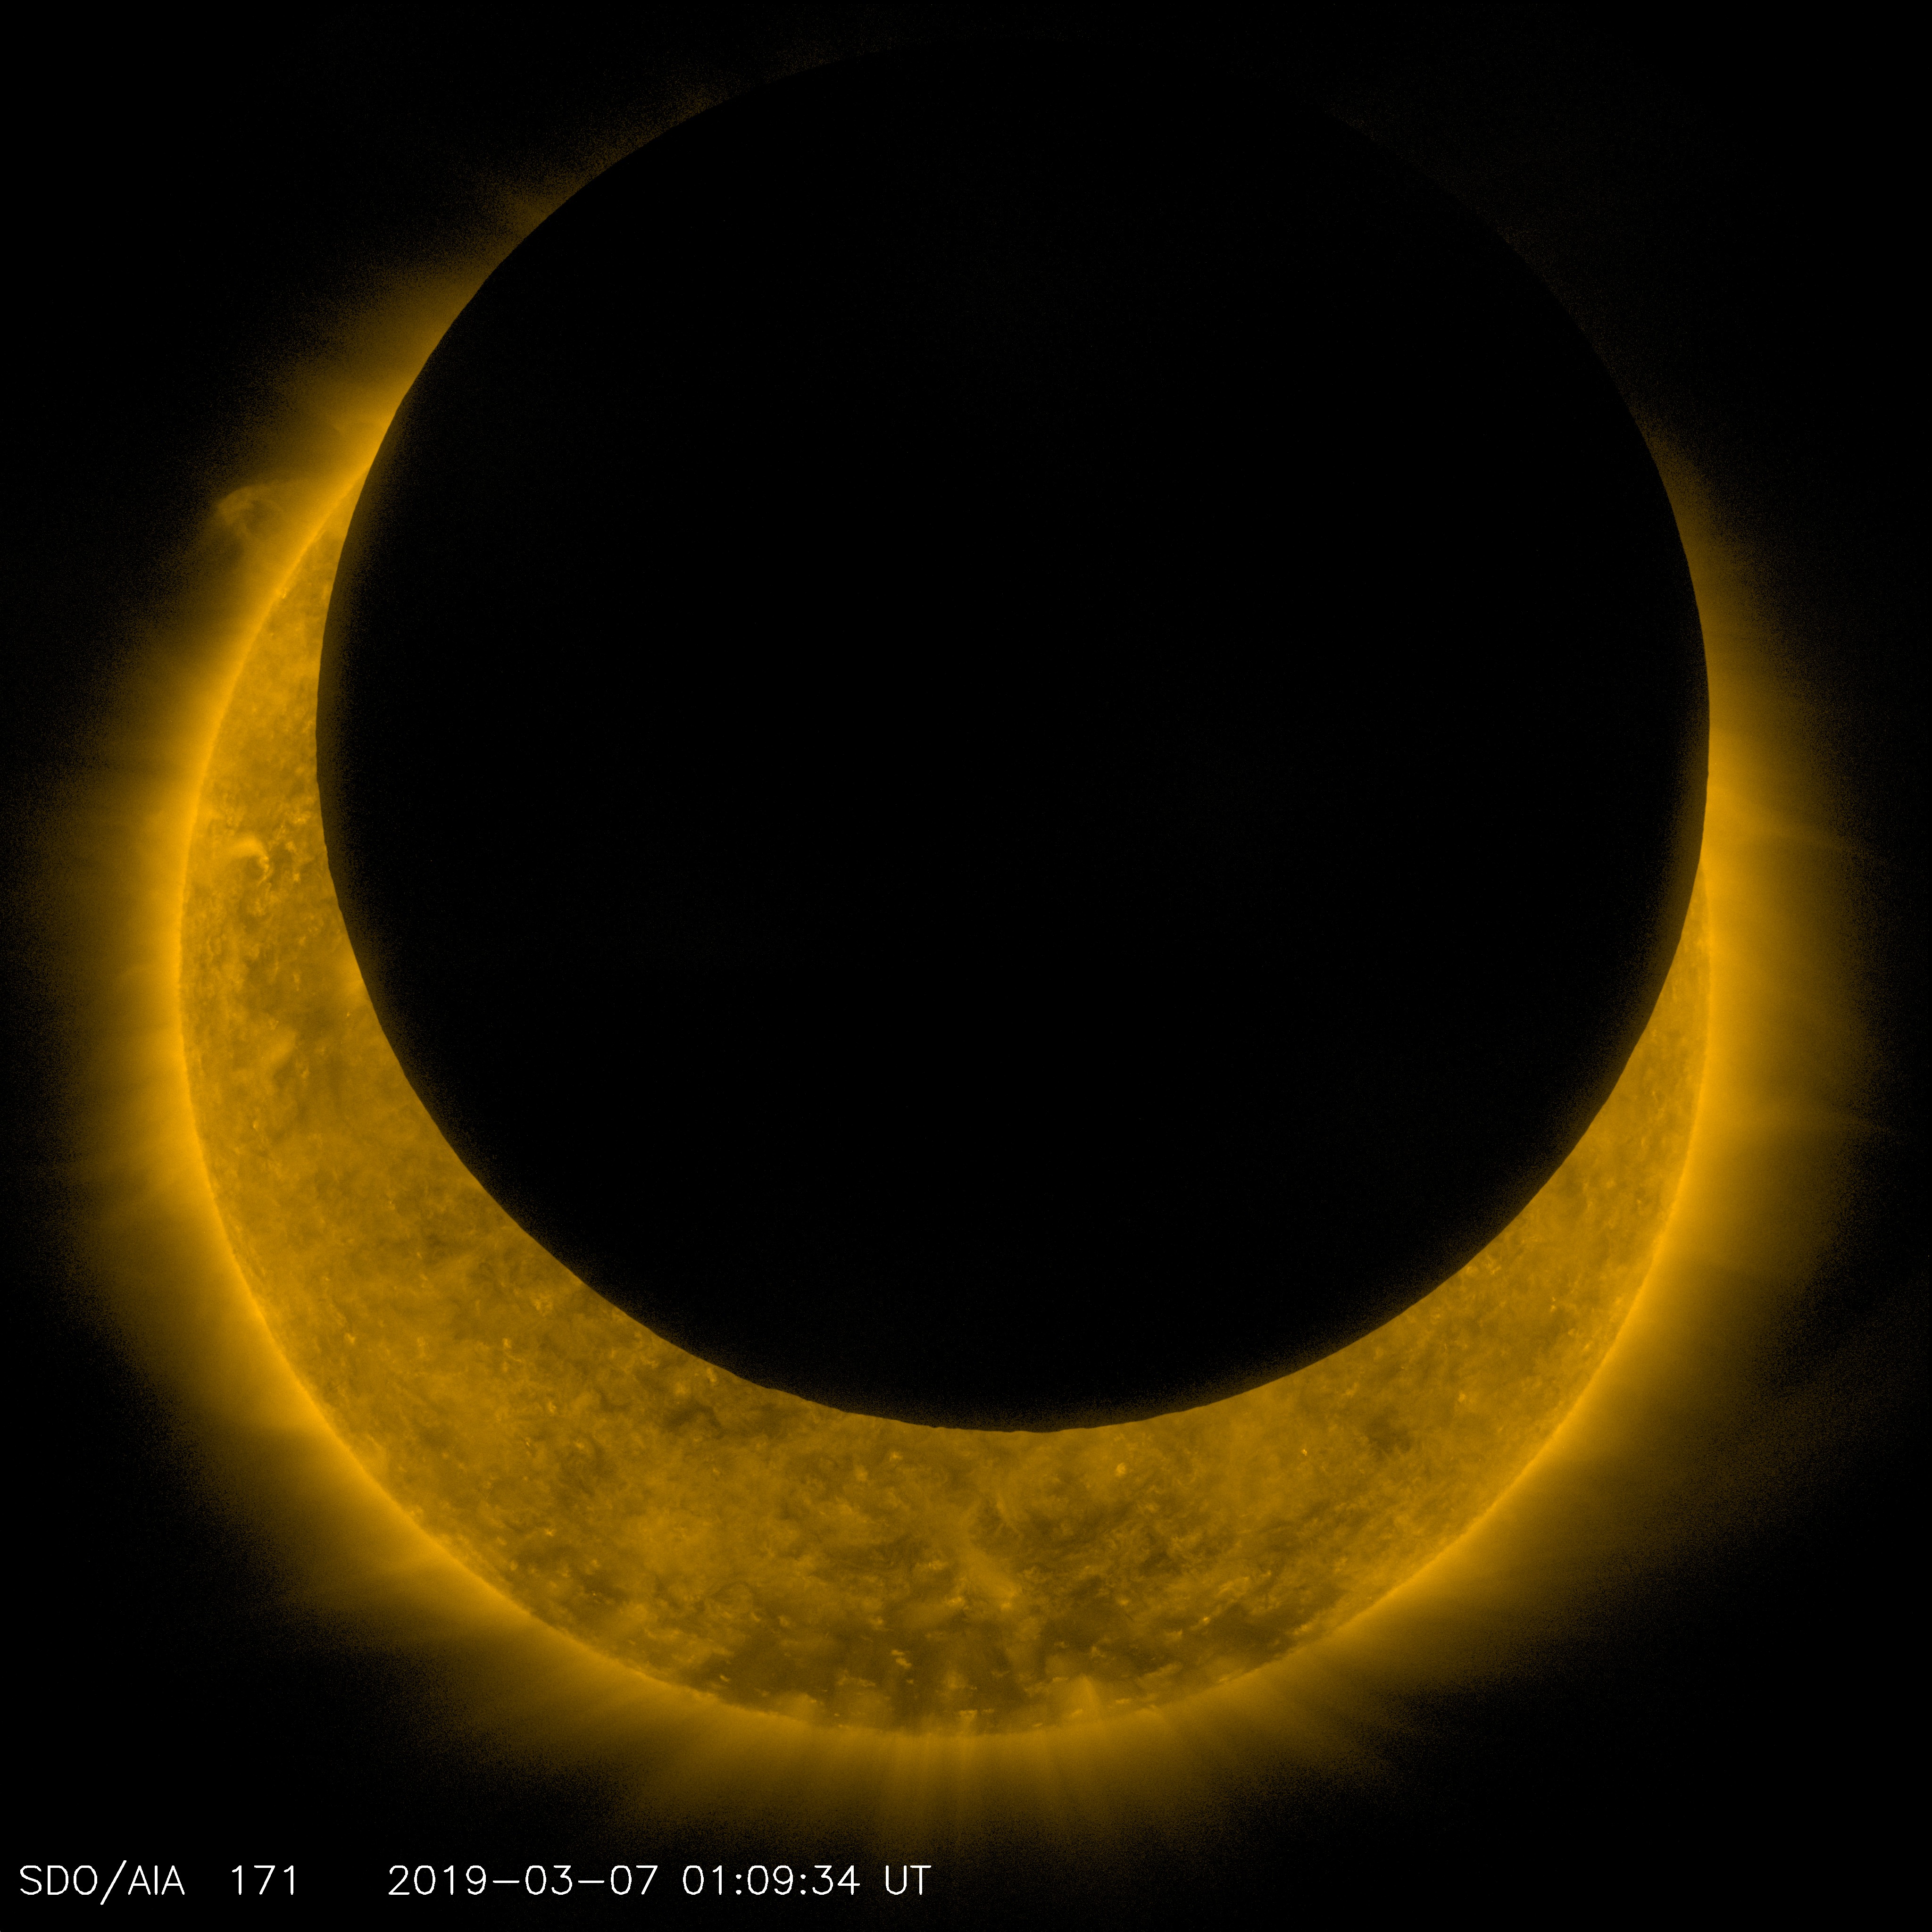
Probabilities for significant disturbances in Earth's magnetic field are given for three activity levels: active, minor storm, severe storm Updated at: 2019 Mar 07 2200 UTC Mid-latitudes | 0-24 hr | 24-48 hr | ACTIVE | 30 % | 25 % | MINOR | 10 % | 05 % | SEVERE | 01 % | 01 % | High latitudes | 0-24 hr | 24-48 hr | ACTIVE | 15 % | 20 % | MINOR | 30 % | 30 % | SEVERE | 30 % | 25 % | | | |  | | | | | | | | | | | Lights Over Lapland has a brand-new website full of exciting adventures in Abisko National Park, Sweden! Take a look at our aurora activities and book your once-in-a-lifetime trip with us today! | | | MINOR GEOMAGNETIC UNREST: For the next three days, one or more tenuous streams of solar wind could make weak connections with Earth's magnetic field. They are flowing from a patchy, shallow hole in the sun's atmosphere. Arctic auroras are possible on March 7th - 9th, intermittently waxing in brightness as the solar wind becomes occasionally geoeffective. Aurora Alerts: SMS text, email. A REALLY WEIRD SOLAR ECLIPSE: Earlier today, NASA's Solar Dynamics Observatory (SDO) observed an eclipse of the sun--a strange kind of eclipse that you can only see while orbiting Earth. The black disk of the New Moon passed in front of the sun, reversed course, and did it again: 
During the eclipse, which lasted just over 4 hours, as much as 82% of the sun was covered. Technically, that makes it an annular solar eclipse, not total. At maximum, an annulus or "ring of fire" completely surrounded the Moon. The strange "double-dip" motion of the Moon across the sun is a result of orbital mechanics. Both SDO and the Moon are orbiting Earth, but at different speeds. SDO's velocity of ~3 km/s is faster than the Moon's velocity of 1 km/s. SDO thus overtakes the Moon first in one direction, then the other, during the long eclipse. High-resolution images of the eclipse reveal that the Moon is not perfectly smooth. The little bumps and irregularities you see are lunar mountains backlit by solar plasma: 
Images like these have practical value to the SDO science team. The sharp edge of the lunar disk helps researchers measure the in-orbit characteristics of the telescope--e.g., how light diffracts around the telescope's optics and filter support grids. Once these are calibrated, it is possible to correct SDO data for instrumental effects and sharpen images of the sun even more than before. Realtime Space Weather Photo Gallery A METEORITE RETURNS TO SPACE: Meteorites usually come from space. On Feb. 23rd, the students of Earth to Sky Calculus sent one back. This rare pallasite meteorite hitched a ride onboard an Earth to Sky cosmic ray balloon, and it traveled 95,000 feet above Earth's surface: 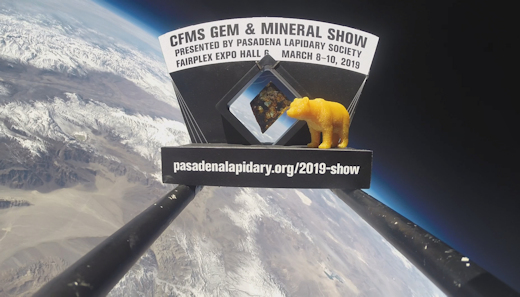
The launch was sponsored by the Pasadena Lapidary Society as part of their advertising campaign to promote the annual California Federation of Mineralogical Studies Gem and Mineral Show. If you're near Pomona, CA, On March 8th through 10th, check it out!
"The show will have kids' games, a raffle, silent auction, display cases, dealers selling gems, minerals, jewelry, meteorites and more," say the show's organizers. For further information, visit pasadenalapidary.org along with our Facebook and Twitter pages. The pallasite meteorite has been recovered from its landing site on the edge of Death Valley National Park and will be on display at the show." Readers, if you would like to sponsor a cosmic ray balloon flight of your own, you can! Items sent to the edge of space are photographed, video recorded, recovered, and returned for a down-to-Earth price of $500. Far Out Gifts: Earth to Sky Store
All sales support hands-on STEM education
Realtime Space Weather Photo Gallery
Realtime Aurora Photo Gallery
Every night, a network of NASA all-sky cameras scans the skies above the United States for meteoritic fireballs. Automated software maintained by NASA's Meteoroid Environment Office calculates their orbits, velocity, penetration depth in Earth's atmosphere and many other characteristics. Daily results are presented here on Spaceweather.com. On Mar. 7, 2019, the network reported 7 fireballs.
(7 sporadics)  In this diagram of the inner solar system, all of the fireball orbits intersect at a single point--Earth. The orbits are color-coded by velocity, from slow (red) to fast (blue). [Larger image] [movies] Potentially Hazardous Asteroids ( PHAs) are space rocks larger than approximately 100m that can come closer to Earth than 0.05 AU. None of the known PHAs is on a collision course with our planet, although astronomers are finding new ones all the time. On March 7, 2019 there were 1967 potentially hazardous asteroids.
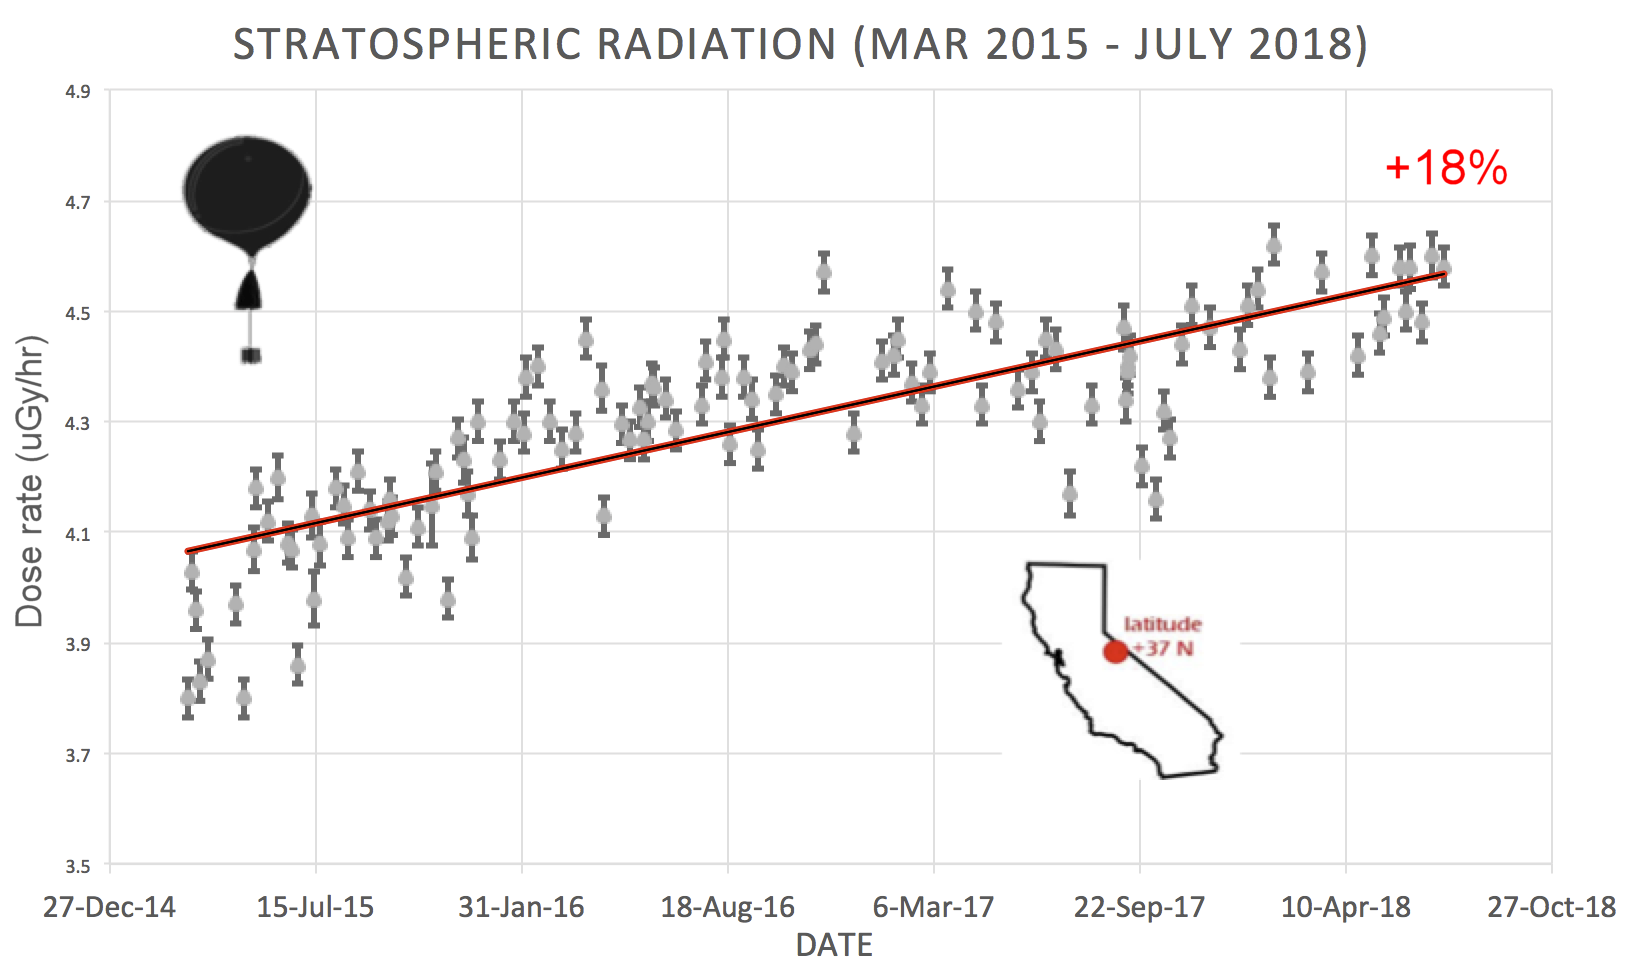
 | Recent & Upcoming Earth-asteroid encounters: | Asteroid | Date(UT) | Miss Distance | Velocity (km/s) | Diameter (m) | | 2019 EG1 | 2019-Mar-01 | 3.7 LD | 8.8 | 23 | | 2019 DO | 2019-Mar-01 | 5 LD | 12.3 | 29 | | 2019 DD | 2019-Mar-01 | 7.5 LD | 10.3 | 15 | | 2019 ED1 | 2019-Mar-01 | 1 LD | 9.6 | 12 | | 2019 DN1 | 2019-Mar-02 | 1.5 LD | 11.7 | 6 | | 2019 CT4 | 2019-Mar-02 | 6 LD | 12.1 | 47 | | 2019 DT1 | 2019-Mar-03 | 17.5 LD | 8 | 18 | | 2019 DG1 | 2019-Mar-03 | 4.8 LD | 7.2 | 16 | | 2019 DX | 2019-Mar-03 | 3.8 LD | 12.6 | 15 | | 2019 EK | 2019-Mar-03 | 7.6 LD | 11 | 20 | | 2019 DM | 2019-Mar-03 | 7 LD | 12.2 | 47 | | 2019 CX4 | 2019-Mar-04 | 18.5 LD | 6.9 | 31 | | 2019 DQ1 | 2019-Mar-04 | 11.4 LD | 7.6 | 32 | | 2019 CW | 2019-Mar-04 | 19.2 LD | 11.6 | 61 | | 2019 DB2 | 2019-Mar-04 | 8.8 LD | 8.8 | 26 | | 2015 EG | 2019-Mar-04 | 1.2 LD | 9.6 | 26 | | 2019 DC | 2019-Mar-05 | 10.9 LD | 9.2 | 21 | | 2019 DL1 | 2019-Mar-05 | 9.5 LD | 4.4 | 17 | | 2019 ET | 2019-Mar-05 | 8.6 LD | 14.9 | 44 | | 2019 EZ | 2019-Mar-06 | 2.8 LD | 13.9 | 12 | | 2019 DA1 | 2019-Mar-06 | 3.6 LD | 12.6 | 23 | | 2019 EE | 2019-Mar-07 | 7.3 LD | 12.2 | 21 | | 2019 EU | 2019-Mar-08 | 2.1 LD | 10.5 | 26 | | 2019 DN | 2019-Mar-08 | 13.5 LD | 7.3 | 121 | | 2019 EF1 | 2019-Mar-08 | 6.5 LD | 6.1 | 20 | | 2012 DF31 | 2019-Mar-09 | 9.3 LD | 15.1 | 47 | | 2019 CM4 | 2019-Mar-11 | 13.8 LD | 12.1 | 90 | | 2019 DH | 2019-Mar-11 | 7.6 LD | 10.6 | 40 | | 2019 EE1 | 2019-Mar-12 | 14.3 LD | 9.1 | 22 | | 2019 DJ1 | 2019-Mar-12 | 4.1 LD | 3.8 | 16 | | 2013 EG68 | 2019-Mar-13 | 19.3 LD | 17 | 37 | | 2012 VZ19 | 2019-Mar-13 | 7.7 LD | 8 | 27 | | 2019 ES | 2019-Mar-16 | 9 LD | 7 | 34 | | 2019 DH1 | 2019-Mar-18 | 8.6 LD | 5 | 21 | | 2019 CL2 | 2019-Mar-18 | 10.2 LD | 7.5 | 73 | | 2019 CD5 | 2019-Mar-20 | 10.1 LD | 17 | 135 | | 2019 DS | 2019-Mar-21 | 17.4 LD | 8.9 | 37 | | 2019 EN | 2019-Mar-27 | 9.7 LD | 15.2 | 221 | | 2016 GE1 | 2019-Apr-04 | 3.9 LD | 10.1 | 17 | | 2014 UR | 2019-Apr-09 | 13 LD | 4.6 | 17 | | 2016 GW221 | 2019-Apr-09 | 10.1 LD | 5.3 | 39 | | 2012 XO134 | 2019-Apr-18 | 14.8 LD | 11 | 56 | | 522684 | 2019-Apr-19 | 19 LD | 11.5 | 214 | | 2018 KK1 | 2019-May-05 | 13.9 LD | 13.9 | 71 | Notes: LD means "Lunar Distance." 1 LD = 384,401 km, the distance between Earth and the Moon. 1 LD also equals 0.00256 AU. MAG is the visual magnitude of the asteroid on the date of closest approach. | | Cosmic Rays in the Atmosphere | SOMETHING NEW! We have developed a new predictive model of aviation radiation. It's called E-RAD--short for Empirical RADiation model. We are constantly flying radiation sensors onboard airplanes over the US and and around the world, so far collecting more than 22,000 gps-tagged radiation measurements. Using this unique dataset, we can predict the dosage on any flight over the USA with an error no worse than 15%. E-RAD lets us do something new: Every day we monitor approximately 1400 flights criss-crossing the 10 busiest routes in the continental USA. Typically, this includes more than 80,000 passengers per day. E-RAD calculates the radiation exposure for every single flight. The Hot Flights Table is a daily summary of these calculations. It shows the 5 charter flights with the highest dose rates; the 5 commercial flights with the highest dose rates; 5 commercial flights with near-average dose rates; and the 5 commercial flights with the lowest dose rates. Passengers typically experience dose rates that are 20 to 70 times higher than natural radiation at sea level. To measure radiation on airplanes, we use the same sensors we fly to the stratosphere onboard Earth to Sky Calculus cosmic ray balloons: neutron bubble chambers and X-ray/gamma-ray Geiger tubes sensitive to energies between 10 keV and 20 MeV. These energies span the range of medical X-ray machines and airport security scanners. Column definitions: (1) The flight number; (2) The maximum dose rate during the flight, expressed in units of natural radiation at sea level; (3) The maximum altitude of the plane in feet above sea level; (4) Departure city; (5) Arrival city; (6) Duration of the flight. SPACE WEATHER BALLOON DATA: Approximately once a week, Spaceweather.com and the students of Earth to Sky Calculus fly space weather balloons to the stratosphere over California. These balloons are equipped with radiation sensors that detect cosmic rays, a surprisingly "down to Earth" form of space weather. Cosmic rays can seed clouds, trigger lightning, and penetrate commercial airplanes. Furthermore, there are studies ( #1, #2, #3, #4) linking cosmic rays with cardiac arrhythmias and sudden cardiac death in the general population. Our latest measurements show that cosmic rays are intensifying, with an increase of more than 18% since 2015: 
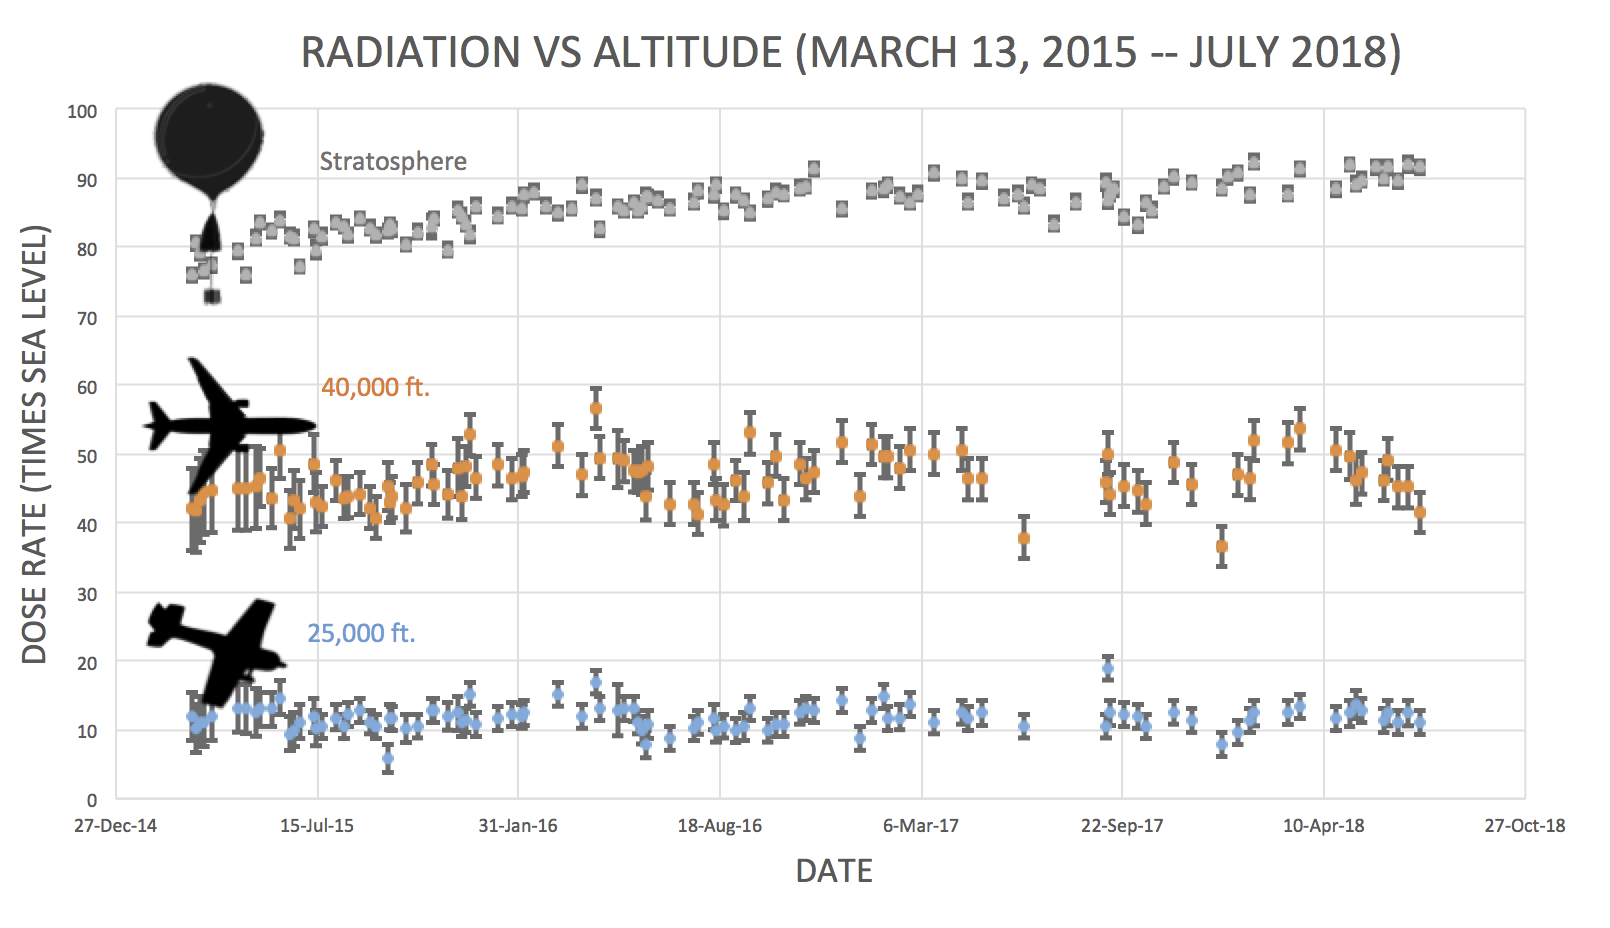
The data points in the graph above correspond to the peak of the Reneger-Pfotzer maximum, which lies about 67,000 feet above central California. When cosmic rays crash into Earth's atmosphere, they produce a spray of secondary particles that is most intense at the entrance to the stratosphere. Physicists Eric Reneger and Georg Pfotzer discovered the maximum using balloons in the 1930s and it is what we are measuring today. En route to the stratosphere, our sensors also pass through aviation altitudes: 
In this plot, dose rates are expessed as multiples of sea level. For instance, we see that boarding a plane that flies at 25,000 feet exposes passengers to dose rates ~10x higher than sea level. At 40,000 feet, the multiplier is closer to 50x. The radiation sensors onboard our helium balloons detect X-rays and gamma-rays in the energy range 10 keV to 20 MeV. These energies span the range of medical X-ray machines and airport security scanners. Why are cosmic rays intensifying? The main reason is the sun. Solar storm clouds such as coronal mass ejections (CMEs) sweep aside cosmic rays when they pass by Earth. During Solar Maximum, CMEs are abundant and cosmic rays are held at bay. Now, however, the solar cycle is swinging toward Solar Minimum, allowing cosmic rays to return. Another reason could be the weakening of Earth's magnetic field, which helps protect us from deep-space radiation. | | The official U.S. government space weather bureau | | | The first place to look for information about sundogs, pillars, rainbows and related phenomena. | | | Researchers call it a "Hubble for the sun." SDO is the most advanced solar observatory ever. | | | 3D views of the sun from NASA's Solar and Terrestrial Relations Observatory | | | Realtime and archival images of the Sun from SOHO. | | | from the NOAA Space Environment Center | | | fun to read, but should be taken with a grain of salt! Forecasts looking ahead more than a few days are often wrong. | | | from the NOAA Space Environment Center | | | the underlying science of space weather |  | To find reviews of new online casino sites in the UK try The Casino DB where there are hundreds of online casino reviews complete with bonuses and ratings. Looking for a new online casino? Try Casimpo the new site dedicated to making online casino simple and easy for all. | | | These links help Spaceweather.com stay online. Thank you to our supporters! | | | | | | | | |  | | |  | ©2018 Spaceweather.com. All rights reserved. This site is penned daily by Dr. Tony Phillips. | |


