 | | | Switch to: Europe, USA, New Zealand, Antarctica Credit: NOAA/Ovation  Planetary K-index Planetary K-index
Now: Kp= 2 quiet
24-hr max: Kp= 4 unsettled
explanation | more data
Interplanetary Mag. Field
Btotal: 8.8 nT
Bz: -3.6 nT south
more data: ACE, DSCOVR
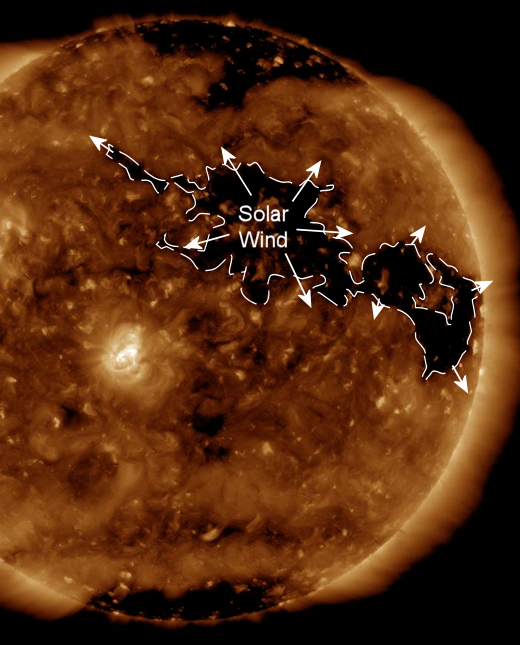
Updated: Today at 2348 UT Coronal Holes: 11 May 18 
Earth is exiting a stream of solar wind flowing from the indicated coronal hole. Credit: SDO/AIA  Noctilucent Clouds Our connection with NASA's AIM spacecraft has been restored! New images from AIM show that the southern season for noctilucent clouds (NLCs) is underway. Come back to this spot every day to see AIM's "daily daisy," which reveals the dance of electric-blue NLCs around the Antarctic Circle.. Switch view: Ross Ice Shelf, Antarctic Peninsula, East Antarctica, Polar Updated at: 02-07-2018 17:55:05 Noctilucent Clouds Our connection with NASA's AIM spacecraft has been restored! New images from AIM show that the southern season for noctilucent clouds (NLCs) is underway. Come back to this spot every day to see AIM's "daily daisy," which reveals the dance of electric-blue NLCs around the Antarctic Circle.. Switch view: Ross Ice Shelf, Antarctic Peninsula, East Antarctica, Polar Updated at: 02-07-2018 17:55:05 SPACE WEATHER
NOAA Forecasts | | Updated at: 2018 May 10 2200 UTC FLARE | 0-24 hr | 24-48 hr | CLASS M | 01 % | 01 % | CLASS X | 01 % | 01 % | Geomagnetic Storms:
Probabilities for significant disturbances in Earth's magnetic field are given for three activity levels: active, minor storm, severe storm Updated at: 2018 May 10 2200 UTC Mid-latitudes | 0-24 hr | 24-48 hr | ACTIVE | 20 % | 10 % | MINOR | 05 % | 01 % | SEVERE | 01 % | 01 % | High latitudes | 0-24 hr | 24-48 hr | ACTIVE | 20 % | 15 % | MINOR | 25 % | 15 % | SEVERE | 20 % | 10 % | | | |  | | | | | | | | | | | All-inclusive Northern Lights trips in Tromsø, Norway. Small groups, big experiences! Highly qualified guides ensure unique and unforgettable adventures with a personal touch. Visit Explore the Arctic | | | WAITING FOR THE NEXT CARRINGTON EVENT: In Sept. 1859, the sun unleashed a series of solar flares so powerful that telegraph offices caught fire and auroras were seen as far south as Cuba. Known as the Carrington Event, this iconic solar storm is a touchstone for discussions of extreme space weather. Could it happen again? In a paper published May 10th, researchers from the University of Birmingham use Extreme Value Theory to estimate the average time between "Carrington-like flares." Their best answer: ~100 years. In other words, we may be overdue for a really big storm. Read the original research here. RED AIRGLOW OVER THE ATACAMA DESERT: When the sun goes down, Chile's Atacama desert can be one of the darkest places on Earth. Last night, it was not. "I couldn't believe what I saw on the screen of my camera when I took the first image," reports photographer Yuri Beletsky, who recorded luminous bands of red rippling across the sky: 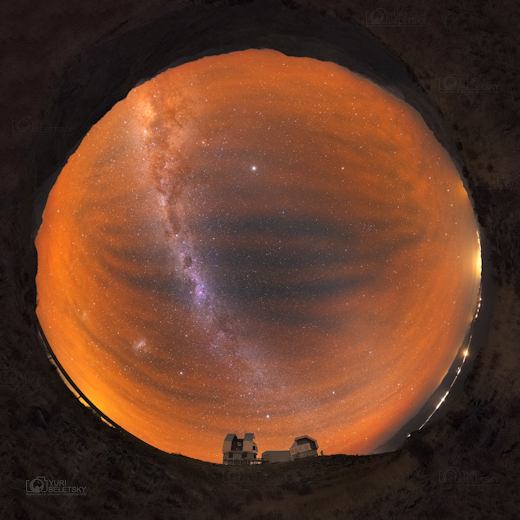
"The airglow was absolutely insane!" he says. "Parts of the Milky Way were barely visible because of the intense red glow."
Airglow is caused by a complex assortment of chemical reactions in the upper atmosphere. These reactions get started during daylight hours when the atmosphere is bathed in strong ultraviolet radiation from the sun. After sunset, the afterglow appears--usually green, but sometimes red. Beletsky is a veteran photographer of airglow, having captured it dozens of times from sites in Chile and the South Pacific. "The intensity of airglow varies, and sometimes it can be more prominent," he notes.
Last night, it was very prominent indeed. The red light came from OH radicals (chemical by-products of the daytime reactions) floating in a narrow layer 86 to 87 km above Earth's surface. Gravity waves propagating upward from the lower atmosphere impressed the thin red glow with a dramatic rippling structure.
"It seems the atmosphere is pretty active now," says Beletsky. "This is a good time to be alert for airglow." Realtime Space Weather Photo Gallery MAGNETIC UNREST: Late on May 5th, Earth entered a stream of solar wind flowing from a wide hole in the sun's atmosphere. More than 5 days later, Earth's magnetic field is still reverberating. "My magnetometer refuses to settle down," reports Stuart Green who sends these data from Preston, Lancashire, UK: 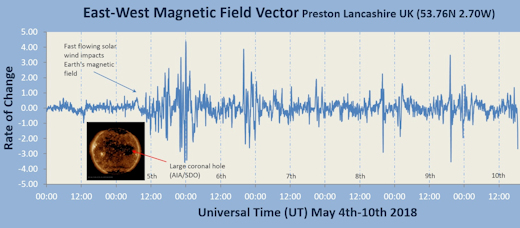
The squiggles in Green's chart represent changes in his local magnetic field caused by the buffeting of solar wind high overhead. "The sensor is buried in my garden about 0.5 meters below the surface in an East/West orientation," he explains. "This allows very sensitive measurements of magnetic declination during solar wind storms." Sustained periods of unrest on May 5th and 6th coincided with G1- and G2-class geomagnetic storm. On those dates, the strange aurora named STEVE was sighted in multiple US states. Periods of quiet returned on May 7th through 10th, but even on those days Green's instrument picked up brief but intense magnetic disturbances. Activity should subside as Earth exits the solar wind stream on May 11th and 12th.
His chart recorder will probably do this again in early June. The solar-wind-spewing coronal hole is now rotating around the sun, lighthouse style, and it will be back in full force a little less than a month from now. Stay tuned. Free: Aurora Alerts
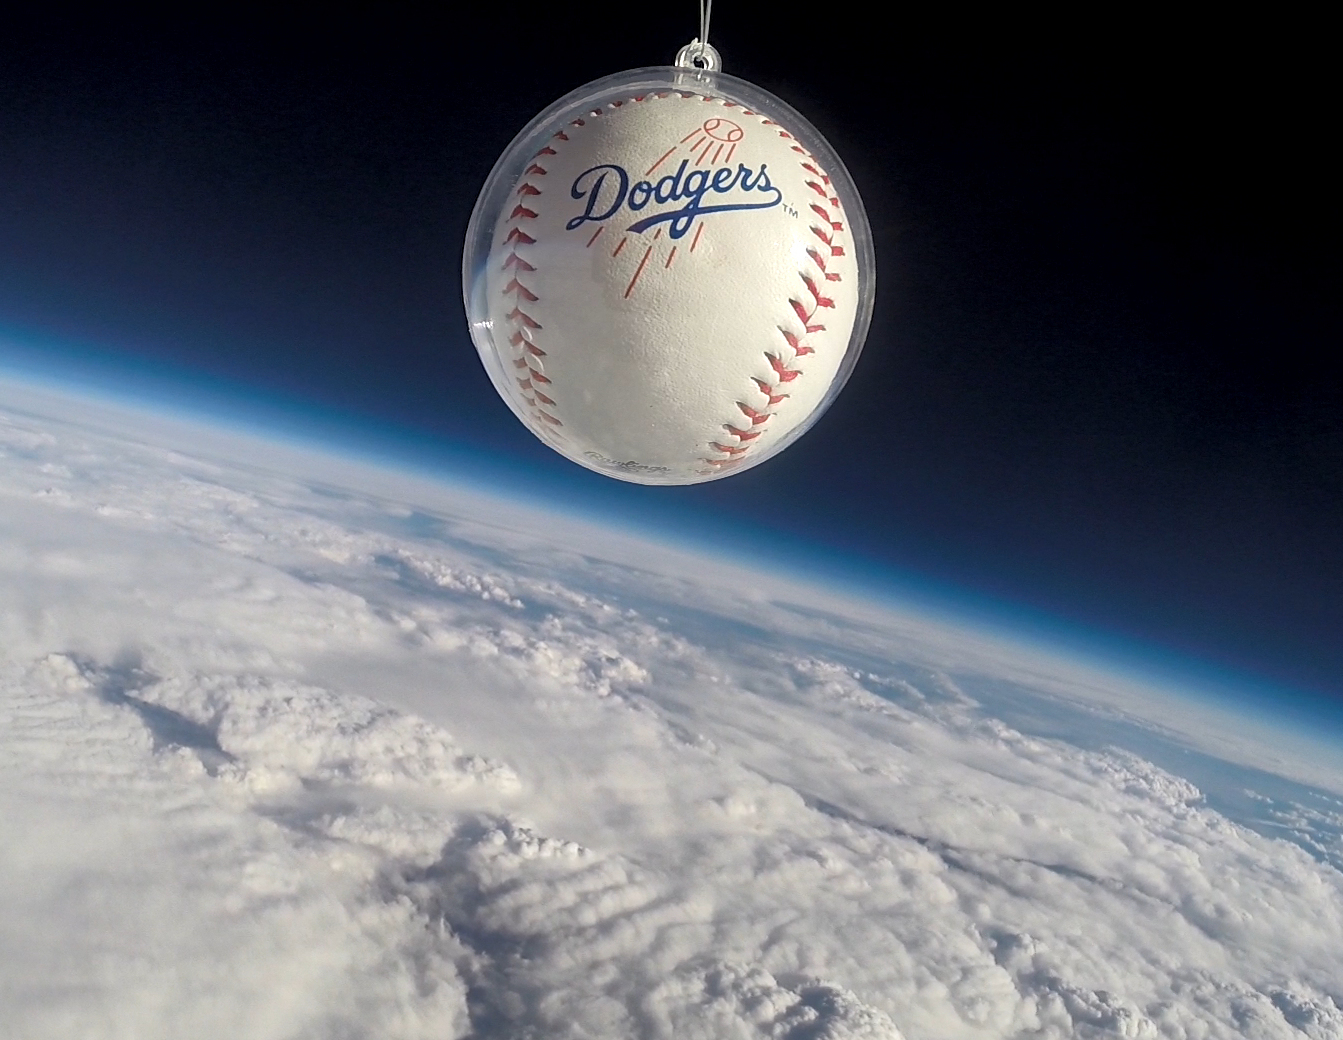
Realtime Aurora Photo Gallery SPACE BASEBALLS: Move over, Mickey Mantle. The students of Earth to Sky Calculus have set a new home run record. According to the Guinness Book of World Records, Mantle hit a 565 foot blast on April 17, 1953. Eclipsing that mark, a Dodgers ball recently launched by the students sailed 700 times farther. The baseball traveled to the stratosphere on board a cosmic ray balloon: 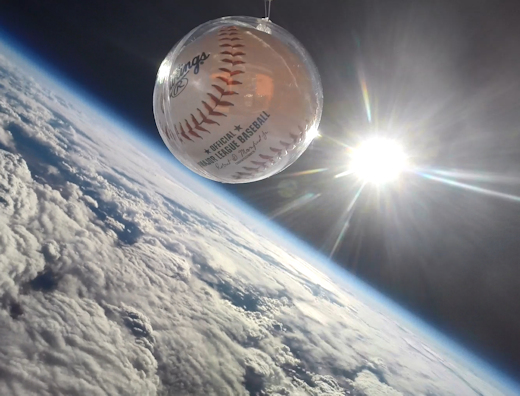
The payload carried commemorative baseballs for the following teams: Dodgers, Angels, Diamondbacks, Red Sox, Yankees, and Giants. You can have one for $139.95. During checkout, enter your preferred team in the COMMENTS section. We will send you the corresponding baseball. If your home team is not on the list, let us know and we will fly it for you on an upcoming flight.
Each baseball comes with a greeting card showing the ball in flight and telling the story of its journey to the stratosphere. They make great gifts for baseball fans, and all proceeds support STEM education. Far Out Gifts: Earth to Sky Store
All proceeds support hands-on STEM education
Every night, a network of NASA all-sky cameras scans the skies above the United States for meteoritic fireballs. Automated software maintained by NASA's Meteoroid Environment Office calculates their orbits, velocity, penetration depth in Earth's atmosphere and many other characteristics. Daily results are presented here on Spaceweather.com. On May. 11, 2018, the network reported 9 fireballs.
(7 sporadics, 1 eta Lyrid, 1 eta Aquariid)  In this diagram of the inner solar system, all of the fireball orbits intersect at a single point--Earth. The orbits are color-coded by velocity, from slow (red) to fast (blue). [Larger image] [movies] Potentially Hazardous Asteroids ( PHAs) are space rocks larger than approximately 100m that can come closer to Earth than 0.05 AU. None of the known PHAs is on a collision course with our planet, although astronomers are finding new ones all the time. On May 11, 2018 there were 1907 potentially hazardous asteroids.
 | Recent & Upcoming Earth-asteroid encounters: | Asteroid | Date(UT) | Miss Distance | Velocity (km/s) | Diameter (m) | | 2018 JD | 2018-May-06 | 3.5 LD | 8.1 | 16 | | 2018 JW | 2018-May-06 | 9 LD | 11.7 | 25 | | 2018 JB | 2018-May-06 | 5.2 LD | 8.3 | 23 | | 1999 FN19 | 2018-May-07 | 9.7 LD | 5.7 | 118 | | 2016 JQ5 | 2018-May-08 | 6.3 LD | 10.4 | 9 | | 388945 | 2018-May-09 | 6.5 LD | 9 | 295 | | 2018 JP | 2018-May-09 | 2.1 LD | 7.4 | 12 | | 2018 JJ | 2018-May-10 | 13.1 LD | 12.7 | 51 | | 2018 GR2 | 2018-May-11 | 13.4 LD | 9.8 | 111 | | 2018 JZ | 2018-May-11 | 4.3 LD | 13.2 | 13 | | 2016 HP6 | 2018-May-13 | 2.2 LD | 5.6 | 28 | | 2018 JA1 | 2018-May-13 | 4.4 LD | 5.8 | 29 | | 2018 JL1 | 2018-May-14 | 7.5 LD | 5.7 | 16 | | 2018 JY | 2018-May-14 | 8.8 LD | 10.6 | 52 | | 1999 LK1 | 2018-May-15 | 13.3 LD | 10 | 141 | | 2010 WC9 | 2018-May-15 | 0.5 LD | 12.8 | 71 | | 2018 JX | 2018-May-16 | 3.9 LD | 13 | 77 | | 2018 JC | 2018-May-17 | 17.7 LD | 9.4 | 79 | | 2018 GL1 | 2018-May-18 | 14.3 LD | 5.2 | 69 | | 2018 JG1 | 2018-May-20 | 5.3 LD | 8.3 | 43 | | 2018 JK | 2018-May-22 | 16.4 LD | 12.5 | 79 | | 68347 | 2018-May-29 | 9.5 LD | 13.3 | 389 | | 2013 LE7 | 2018-May-31 | 17.8 LD | 1.7 | 12 | | 2018 EJ4 | 2018-Jun-10 | 5.6 LD | 6.2 | 195 | | 2015 DP155 | 2018-Jun-11 | 9 LD | 4.4 | 170 | | 2017 YE5 | 2018-Jun-21 | 15.6 LD | 15.5 | 513 | | 467309 | 2018-Jun-23 | 17.9 LD | 14 | 355 | | 441987 | 2018-Jun-24 | 7.3 LD | 12.6 | 178 | Notes: LD means "Lunar Distance." 1 LD = 384,401 km, the distance between Earth and the Moon. 1 LD also equals 0.00256 AU. MAG is the visual magnitude of the asteroid on the date of closest approach. | | Cosmic Rays in the Atmosphere |
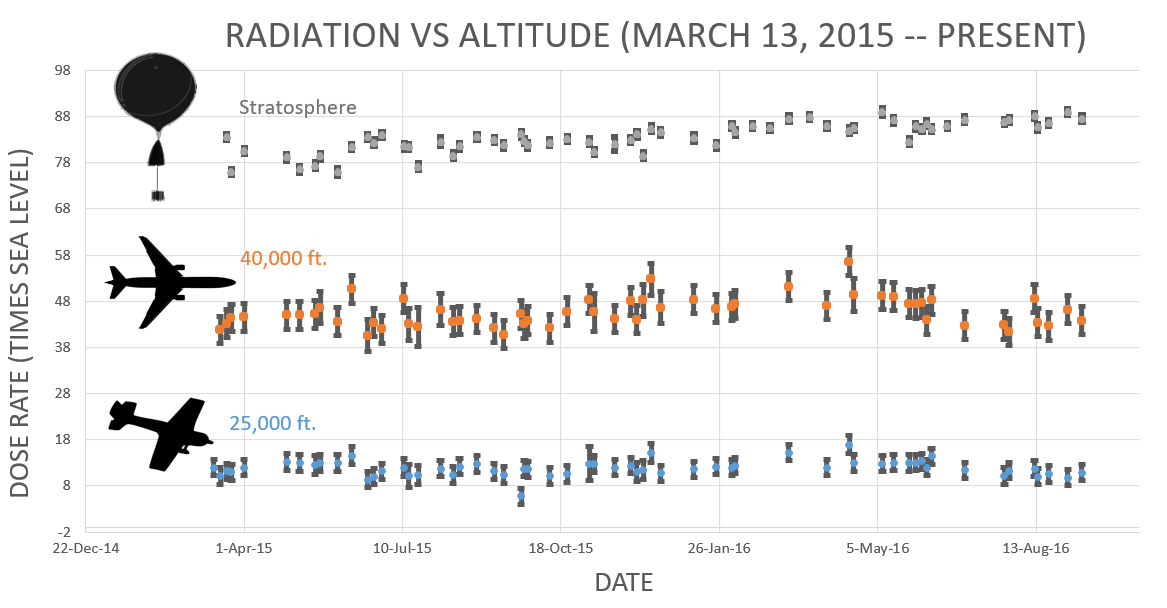
Readers, thank you for your patience while we continue to develop this new section of Spaceweather.com. We've been working to streamline our data reduction, allowing us to post results from balloon flights much more rapidly, and we have developed a new data product, shown here: 
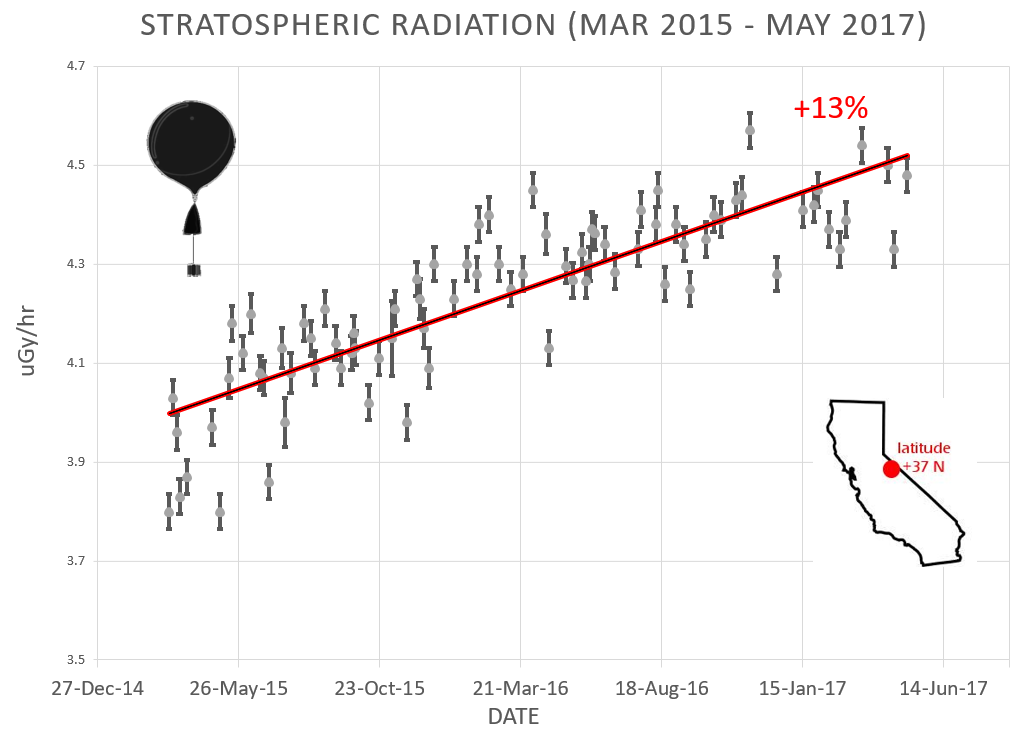
This plot displays radiation measurements not only in the stratosphere, but also at aviation altitudes. Dose rates are expessed as multiples of sea level. For instance, we see that boarding a plane that flies at 25,000 feet exposes passengers to dose rates ~10x higher than sea level. At 40,000 feet, the multiplier is closer to 50x. These measurements are made by our usual cosmic ray payload as it passes through aviation altitudes en route to the stratosphere over California. What is this all about? Approximately once a week, Spaceweather.com and the students of Earth to Sky Calculus fly space weather balloons to the stratosphere over California. These balloons are equipped with radiation sensors that detect cosmic rays, a surprisingly "down to Earth" form of space weather. Cosmic rays can seed clouds, trigger lightning, and penetrate commercial airplanes. Furthermore, there are studies ( #1, #2, #3, #4) linking cosmic rays with cardiac arrhythmias and sudden cardiac death in the general population. Our latest measurements show that cosmic rays are intensifying, with an increase of more than 13% since 2015: 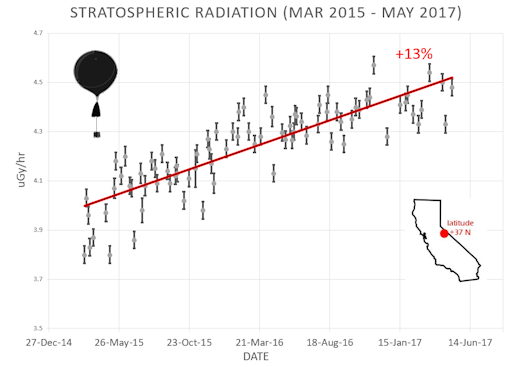
Why are cosmic rays intensifying? The main reason is the sun. Solar storm clouds such as coronal mass ejections (CMEs) sweep aside cosmic rays when they pass by Earth. During Solar Maximum, CMEs are abundant and cosmic rays are held at bay. Now, however, the solar cycle is swinging toward Solar Minimum, allowing cosmic rays to return. Another reason could be the weakening of Earth's magnetic field, which helps protect us from deep-space radiation. The radiation sensors onboard our helium balloons detect X-rays and gamma-rays in the energy range 10 keV to 20 MeV. These energies span the range of medical X-ray machines and airport security scanners. The data points in the graph above correspond to the peak of the Reneger-Pfotzer maximum, which lies about 67,000 feet above central California. When cosmic rays crash into Earth's atmosphere, they produce a spray of secondary particles that is most intense at the entrance to the stratosphere. Physicists Eric Reneger and Georg Pfotzer discovered the maximum using balloons in the 1930s and it is what we are measuring today. | | The official U.S. government space weather bureau | | | The first place to look for information about sundogs, pillars, rainbows and related phenomena. | | | Researchers call it a "Hubble for the sun." SDO is the most advanced solar observatory ever. | | | 3D views of the sun from NASA's Solar and Terrestrial Relations Observatory | | | Realtime and archival images of the Sun from SOHO. | | | from the NOAA Space Environment Center | | | fun to read, but should be taken with a grain of salt! Forecasts looking ahead more than a few days are often wrong. | | | from the NOAA Space Environment Center | | | the underlying science of space weather |  | Reviews here can help you to pick up best memory foam mattresses. | | | These links help Spaceweather.com stay online. Thank you to our supporters! | | | | | | | | |  | | |  | ©2017 Spaceweather.com. All rights reserved. This site is penned daily by Dr. Tony Phillips. | |


