Solar minimum is here - but even now strangely beautiful auroras are dancing around the poles. Deep inside the Arctic Circle, the expert guides of Aurora Holidays in Utsjoki, Finland, can help you chase them. Book now! | | |
SPACEWEATHER PHOTO GALLERY OUTAGE: Yesterday, our realtime photo gallery server experienced a catastrophic hardware failure. The gallery contains years of unique photos, preserving a record of noctilucent clouds, auroras, and many other phenomena. The good news: Most if not all of those images have been preserved. The bad news: Fixing the problem will take some days as we carefully migrate the gallery to a more capable platform, modernizing code in the process. In the meantime, if you have an image to share with readers of Spaceweather.com, please email it directly to Dr. Tony Phillips. Don't forget to include the time and location of the image + commentary about what you saw.
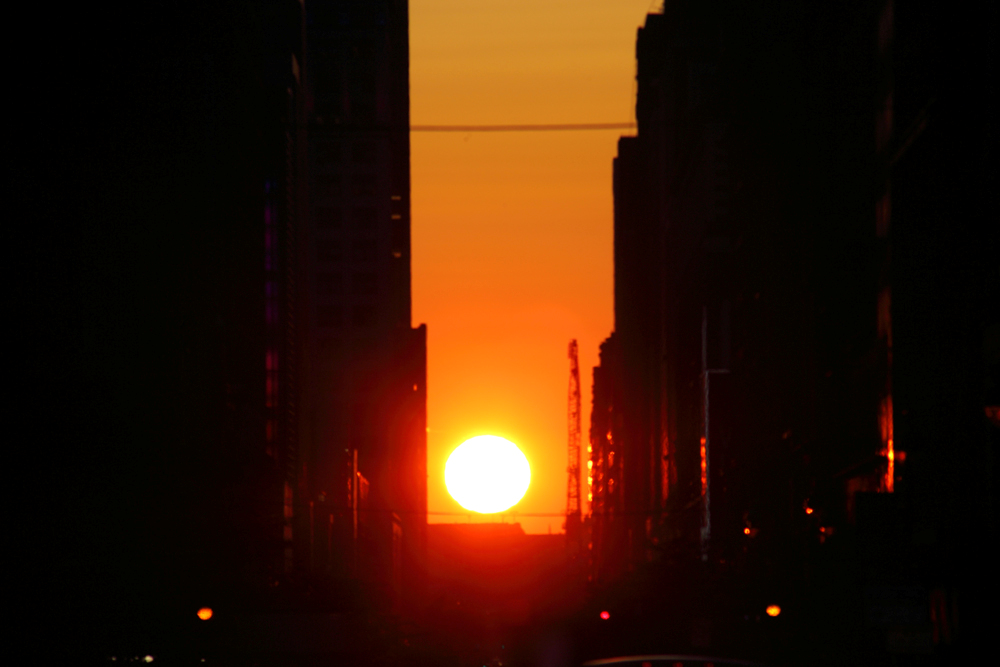
MANHATTANHENGE: Twice a year at sunset, the concrete canyons of New York City turn into an urban simulacrum of an ancient astronomical observatory. Instead of Stonehenge, New York has Manhattanhenge. "Here is a photo I took at sunset on July 12th," reports Jim Haklar.

"I was one of many people who ventured out into the middle of 34th Street during a red light to take pictures," says Haklar. "The weather was perfect."
If Manhattan streets were truly east-west, this phenomenon would occur on the dates of the equinoxes. Instead, the street grid for most of Manhattan is rotated 29° clockwise from east-west. The sun therefore beams down the streets of the borough on dates which are offset: May 29-30 and July 12-13.
It's happening again tonight. Residents of the borough should be alert for another Manhattanhenge moment on July 13th at 8:21 pm local time.
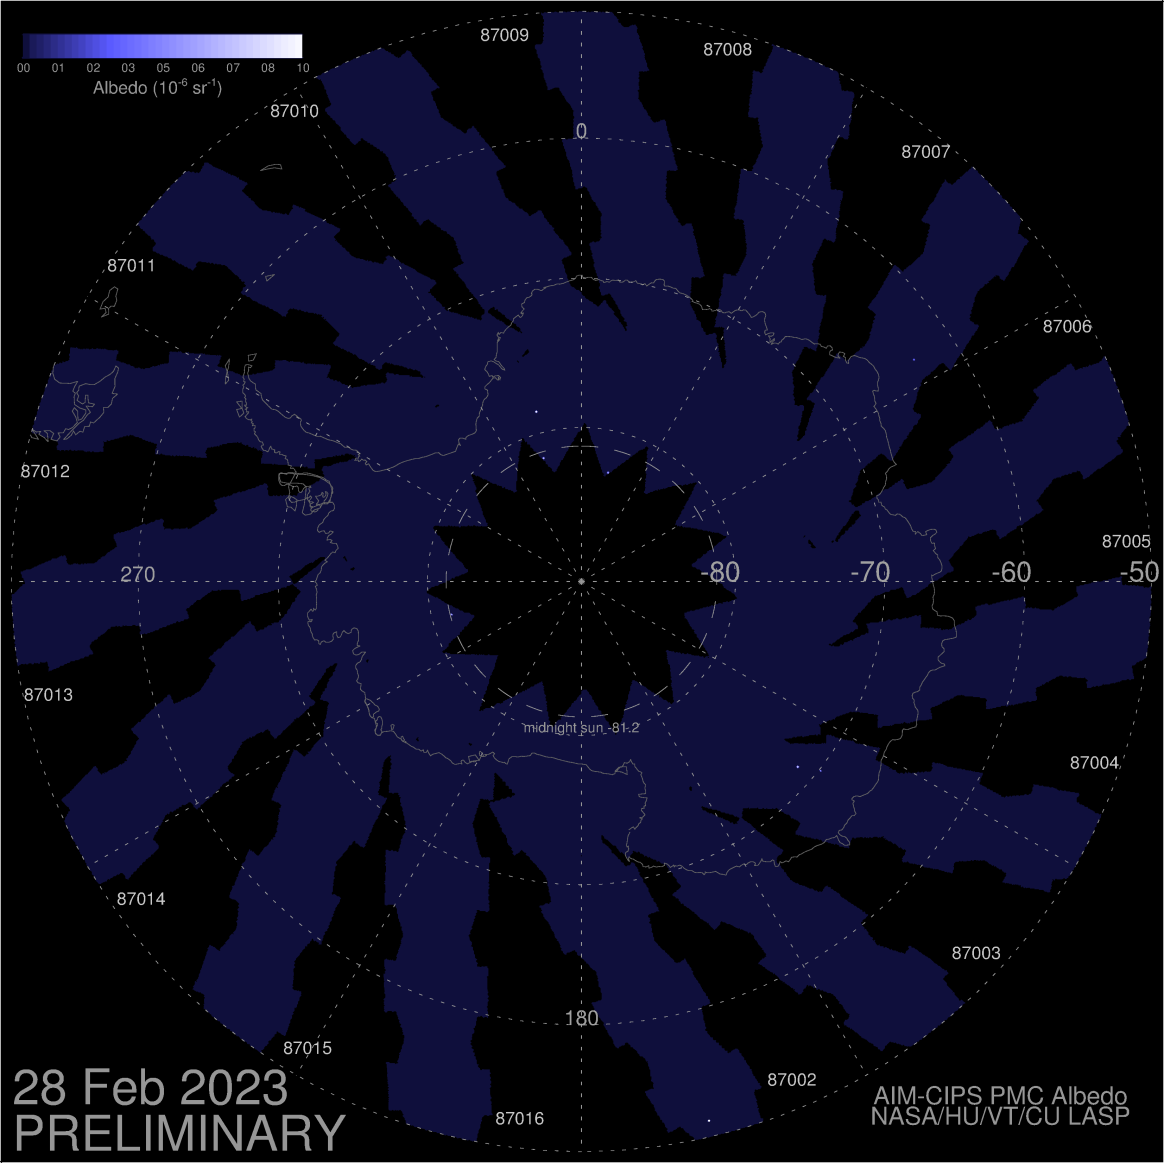
WHAT'S UP IN THE MESOSPHERE? Last month, people around the world who had never heard of noctilucent clouds (NLCs) suddenly found themselves seeing NLCs on a regular basis. The electric-blue clouds rippled to record low latitudes, with sightings as far south as New Mexico and southern California. As July unfolds, however, the clouds have subsided.
What's happening up there? Lynn Harvey of the Laboratory for Atmospheric and Space Physics at the University of Colorado has taken a look at NASA satellite data, and here are her findings:
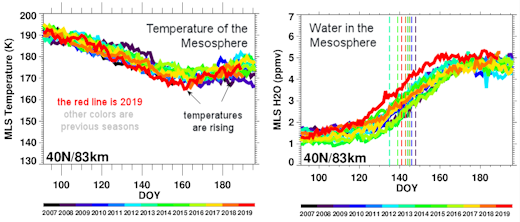
"At mid-latitudes, the mesosphere remains quite wet, but temperatures have been rising this month," says Harvey. "The rising temperatures could be suppressing the formation of NLCs."
Noctilucent clouds form when summertime wisps of water vapor rise to the edge of space, frosting specks of meteor smoke. When sunlight hits those tiny ice crystals, they glow electric-blue. Moisture boosts NLCs, but warmth destroys them. The recent uptick in temperature may be responsible for their retreat.
Although fewer people are seeing NLCs as July unfolds, the season is not over. NASA's AIM satellite continues to see a bright ring of electric-blue circling Earth's north pole, and only two days ago Bertrand Kulik witnessed a display of NLCs over Paris, France:
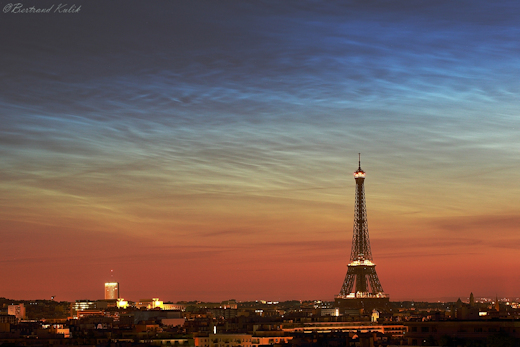
"Noctilucent clouds were visible over the Eiffel tower around 4 o'clock in the morning on July 10th," says Kulik. "It was not a strong display, but still very nice."
The northern summer season for noctilucent clouds typically continues through mid-August. Observing tips: Look west 30 to 60 minutes after sunset (or before sunrise) when the sun is just below the horizon. If you see luminous blue-white tendrils spreading across the sky, you may have spotted a noctilucent cloud.
Realtime Noctilucent Cloud Photo Gallery
Note: The photo gallery is temporarily unavailable
MILLENNIUM FALCON IN THE STRATOSPHERE: This artwork has touched space. Hand-painted by artist Dana Wilcher, a student member of Earth to Sky Calculus, "One Small Step" flew to the stratosphere on June 23, 2019, onboard a cosmic ray balloon. It shows Neil Armstrong's iconic footprint on the Moon made during the Apollo 11 mission 50 years ago:

You can have it for $99.95. The students are selling these commemorative Apollo 11 paintings to celebrate the 50th anniversary of the Moon landing and to support their cosmic ray ballooning program. Each signed 4x4inch canvas panel comes with a greeting card showing the painting in flight and telling the story of its journey to the edge of space and back. This makes a great gift for any enthusiast of space exploration.
Far Out Gifts: Earth to Sky Store
All sales support hands-on STEM education
Realtime Space Weather Photo Gallery
Free: Spaceweather.com Newsletter
Realtime Aurora Photo Gallery
Free: Spaceweather.com Newsletter
Every night, a network of
NASA all-sky cameras scans the skies above the United States for meteoritic fireballs. Automated software maintained by NASA's Meteoroid Environment Office calculates their orbits, velocity, penetration depth in Earth's atmosphere and many other characteristics. Daily results are presented here on Spaceweather.com.
On Jul. 13, 2019, the network reported 68 fireballs.
(66 sporadics, 2 July Pegasids)
In this diagram of the inner solar system, all of the fireball orbits intersect at a single point--Earth. The orbits are color-coded by velocity, from slow (red) to fast (blue). [Larger image] [movies]
Potentially Hazardous Asteroids (
PHAs) are space rocks larger than approximately 100m that can come closer to Earth than 0.05 AU. None of the known PHAs is on a collision course with our planet, although astronomers are finding
new ones all the time.
On July 13, 2019 there were 1983 potentially hazardous asteroids.
 |
Recent & Upcoming Earth-asteroid encounters: | Asteroid | Date(UT) | Miss Distance | Velocity (km/s) | Diameter (m) |
| 2019 MT2 | 2019-Jul-08 | 4.4 LD | 11 | 18 |
| 2019 MB4 | 2019-Jul-09 | 0.8 LD | 7.2 | 22 |
| 2019 NX5 | 2019-Jul-09 | 2.6 LD | 1.8 | 5 |
| 2016 NO56 | 2019-Jul-09 | 8 LD | 11.4 | 25 |
| 2019 NP5 | 2019-Jul-09 | 5.6 LD | 4.8 | 11 |
| 2019 NM4 | 2019-Jul-10 | 9 LD | 7.9 | 59 |
| 2019 NM5 | 2019-Jul-10 | 2.1 LD | 8.8 | 13 |
| 2019 NN3 | 2019-Jul-10 | 0.8 LD | 8.8 | 39 |
| 2019 NW5 | 2019-Jul-12 | 18.3 LD | 15.6 | 62 |
| 2019 KD3 | 2019-Jul-12 | 15.5 LD | 8 | 83 |
| 2016 NJ33 | 2019-Jul-12 | 15 LD | 4.5 | 32 |
| 2019 MW1 | 2019-Jul-13 | 7.8 LD | 8.5 | 45 |
| 2019 NQ5 | 2019-Jul-14 | 11.5 LD | 9.9 | 34 |
| 2019 NR3 | 2019-Jul-14 | 16.8 LD | 4.8 | 20 |
| 2019 NF1 | 2019-Jul-17 | 19.3 LD | 10 | 58 |
| 2019 NJ2 | 2019-Jul-19 | 13.4 LD | 13.5 | 38 |
| 2015 HM10 | 2019-Jul-24 | 12.2 LD | 9.5 | 68 |
| 2010 PK9 | 2019-Jul-26 | 8.2 LD | 16.5 | 155 |
| 2019 NT1 | 2019-Jul-27 | 19 LD | 3.7 | 14 |
| 2019 NN4 | 2019-Jul-29 | 6.6 LD | 3.8 | 28 |
| 2006 QQ23 | 2019-Aug-10 | 19.4 LD | 4.7 | 339 |
| 454094 | 2019-Aug-12 | 17 LD | 8.2 | 148 |
| 2018 PN22 | 2019-Aug-17 | 17.1 LD | 2.3 | 11 |
| 2016 PD1 | 2019-Aug-26 | 11.4 LD | 5.9 | 65 |
| 2002 JR100 | 2019-Aug-27 | 19.4 LD | 8.4 | 49 |
| 2018 DE1 | 2019-Sep-03 | 12.7 LD | 6.6 | 28 |
| 2019 GT3 | 2019-Sep-06 | 19.5 LD | 13.6 | 227 |
Notes: LD means "Lunar Distance." 1 LD = 384,401 km, the distance between Earth and the Moon. 1 LD also equals 0.00256 AU. MAG is the visual magnitude of the asteroid on the date of closest approach. | | Cosmic Rays in the Atmosphere |
SOMETHING NEW! We have developed a new predictive model of aviation radiation. It's called E-RAD--short for Empirical RADiation model. We are constantly flying radiation sensors onboard airplanes over the US and and around the world, so far collecting more than 22,000 gps-tagged radiation measurements. Using this unique dataset, we can predict the dosage on any flight over the USA with an error no worse than 15%.
E-RAD lets us do something new: Every day we monitor approximately 1400 flights criss-crossing the 10 busiest routes in the continental USA. Typically, this includes more than 80,000 passengers per day. E-RAD calculates the radiation exposure for every single flight.
The Hot Flights Table is a daily summary of these calculations. It shows the 5 charter flights with the highest dose rates; the 5 commercial flights with the highest dose rates; 5 commercial flights with near-average dose rates; and the 5 commercial flights with the lowest dose rates. Passengers typically experience dose rates that are 20 to 70 times higher than natural radiation at sea level.
To measure radiation on airplanes, we use the same sensors we fly to the stratosphere onboard Earth to Sky Calculus cosmic ray balloons: neutron bubble chambers and X-ray/gamma-ray Geiger tubes sensitive to energies between 10 keV and 20 MeV. These energies span the range of medical X-ray machines and airport security scanners.
Column definitions: (1) The flight number; (2) The maximum dose rate during the flight, expressed in units of natural radiation at sea level; (3) The maximum altitude of the plane in feet above sea level; (4) Departure city; (5) Arrival city; (6) Duration of the flight.
SPACE WEATHER BALLOON DATA: Approximately once a week, Spaceweather.com and the students of Earth to Sky Calculus fly space weather balloons to the stratosphere over California. These balloons are equipped with radiation sensors that detect cosmic rays, a surprisingly "down to Earth" form of space weather. Cosmic rays can seed clouds, trigger lightning, and penetrate commercial airplanes. Furthermore, there are studies ( #1, #2, #3, #4) linking cosmic rays with cardiac arrhythmias and sudden cardiac death in the general population. Our latest measurements show that cosmic rays are intensifying, with an increase of more than 18% since 2015:

The data points in the graph above correspond to the peak of the Reneger-Pfotzer maximum, which lies about 67,000 feet above central California. When cosmic rays crash into Earth's atmosphere, they produce a spray of secondary particles that is most intense at the entrance to the stratosphere. Physicists Eric Reneger and Georg Pfotzer discovered the maximum using balloons in the 1930s and it is what we are measuring today.
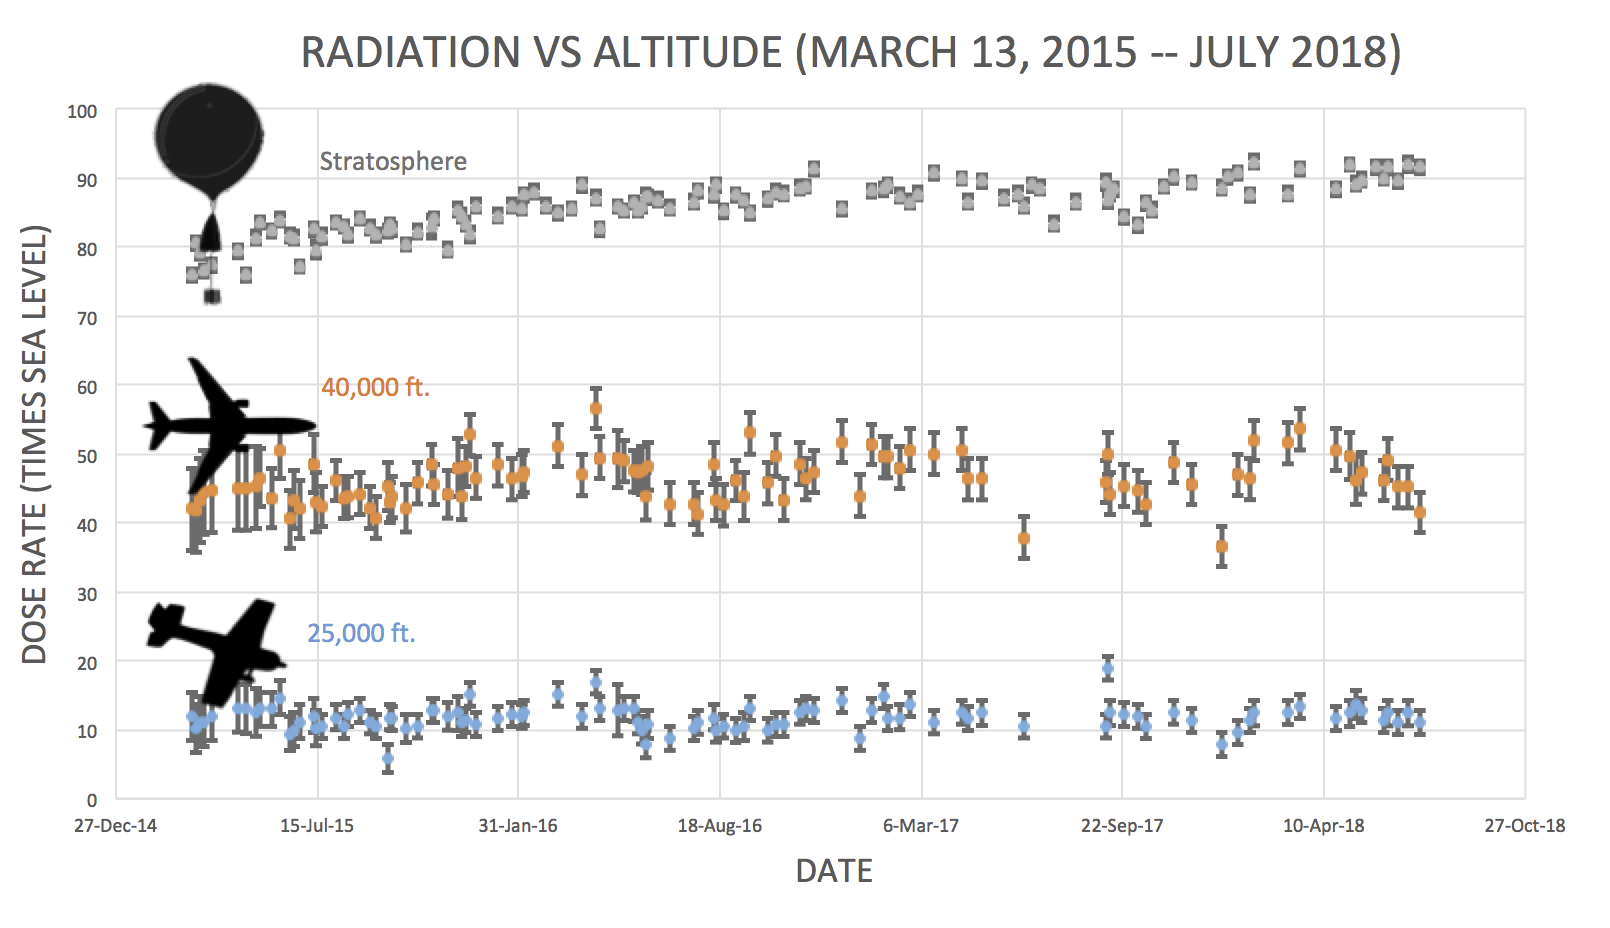
En route to the stratosphere, our sensors also pass through aviation altitudes:

In this plot, dose rates are expessed as multiples of sea level. For instance, we see that boarding a plane that flies at 25,000 feet exposes passengers to dose rates ~10x higher than sea level. At 40,000 feet, the multiplier is closer to 50x.
The radiation sensors onboard our helium balloons detect X-rays and gamma-rays in the energy range 10 keV to 20 MeV. These energies span the range of medical X-ray machines and airport security scanners.
Why are cosmic rays intensifying? The main reason is the sun. Solar storm clouds such as coronal mass ejections (CMEs) sweep aside cosmic rays when they pass by Earth. During Solar Maximum, CMEs are abundant and cosmic rays are held at bay. Now, however, the solar cycle is swinging toward Solar Minimum, allowing cosmic rays to return. Another reason could be the weakening of Earth's magnetic field, which helps protect us from deep-space radiation.
| | The official U.S. government space weather bureau |
| | The first place to look for information about sundogs, pillars, rainbows and related phenomena. |
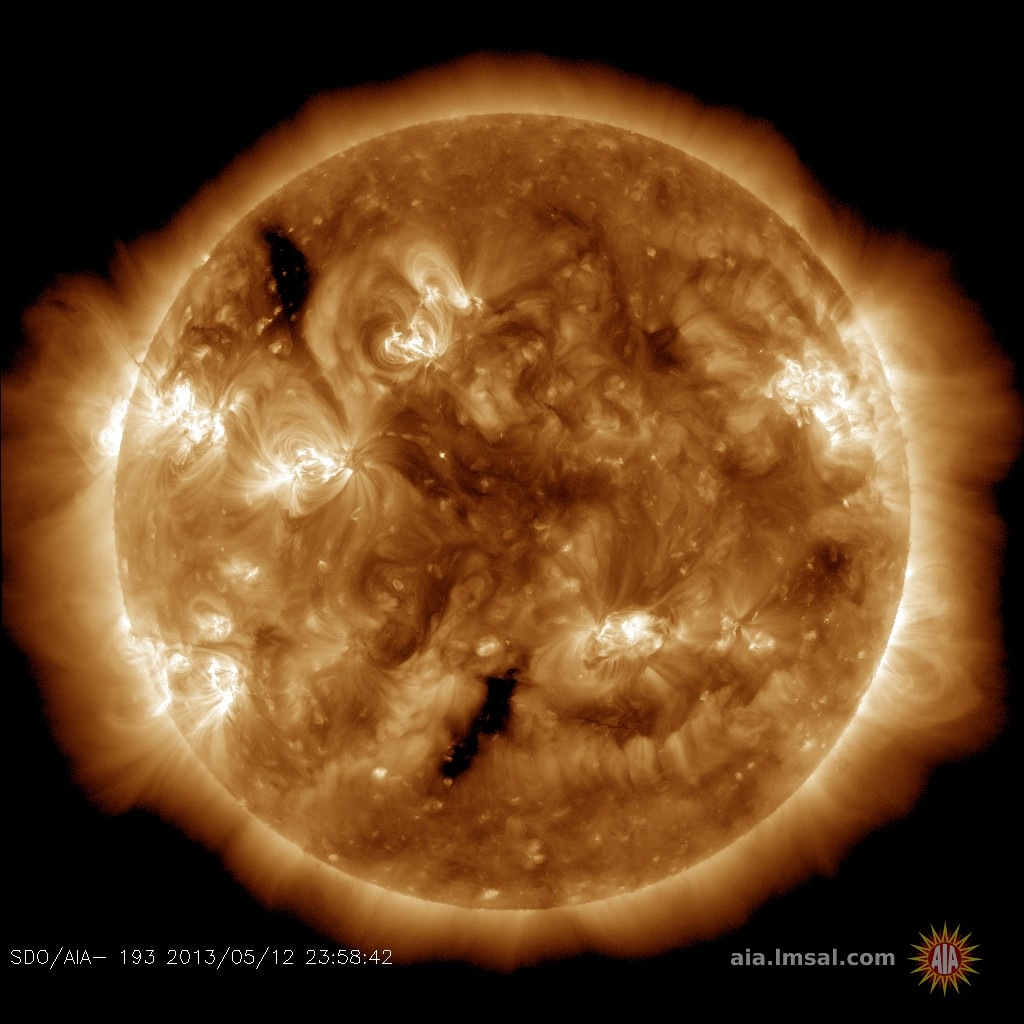
| | Researchers call it a "Hubble for the sun." SDO is the most advanced solar observatory ever. |
| | 3D views of the sun from NASA's Solar and Terrestrial Relations Observatory |
| | Realtime and archival images of the Sun from SOHO. |
| | from the NOAA Space Environment Center |
| | fun to read, but should be taken with a grain of salt! Forecasts looking ahead more than a few days are often wrong. |
| | from the NOAA Space Environment Center |
| | the underlying science of space weather |
 | To find reviews of new online casino sites in the UK try The Casino DB where there are hundreds of online casino reviews complete with bonuses and ratings. Looking for a new online casino? Try Casimpo the new site dedicated to making online casino simple and easy for all. |
| | These links help Spaceweather.com stay online. Thank you to our supporters! |
| | | | | | |


