Marianne's Heaven On Earth Aurora Chaser Tours Chasethelighttours.co.uk invites you to join them in their quest to find and photograph the Aurora Borealis. Experience the winter wonderland in the Tromsø Area. | | | (ALMOST NO) CHANCE OF FLARES: Solar activity is very low. There are only two sunspot groups on the Earthside of the sun, and neither one has the type of unstable magnetic field that harbors energy for strong explosions. NOAA forecasters say the odds of an M- or X-class flare today is no more than 1%. Solar flare alerts: text or voice CME ARRIVES, SPARKS AURORAS: A coronal mass ejection (CME) swept past Earth during the late hours of Nov. 18th, and when the CME's flank hit Earth's magnetic field it sparked a bright display of Arctic auroras. Runólfur Hauksson witnessed the outburst over Hornafjörður, Iceland: 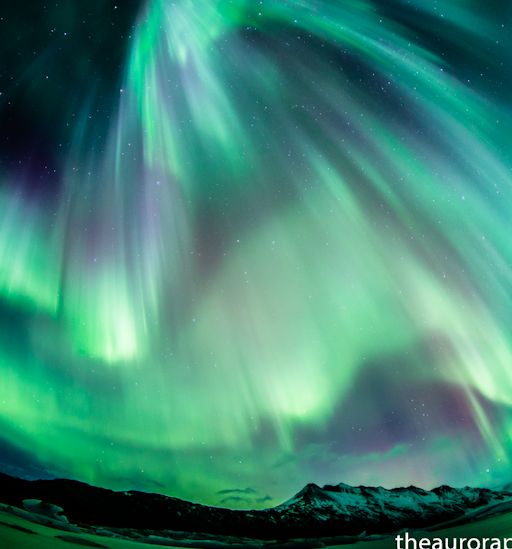
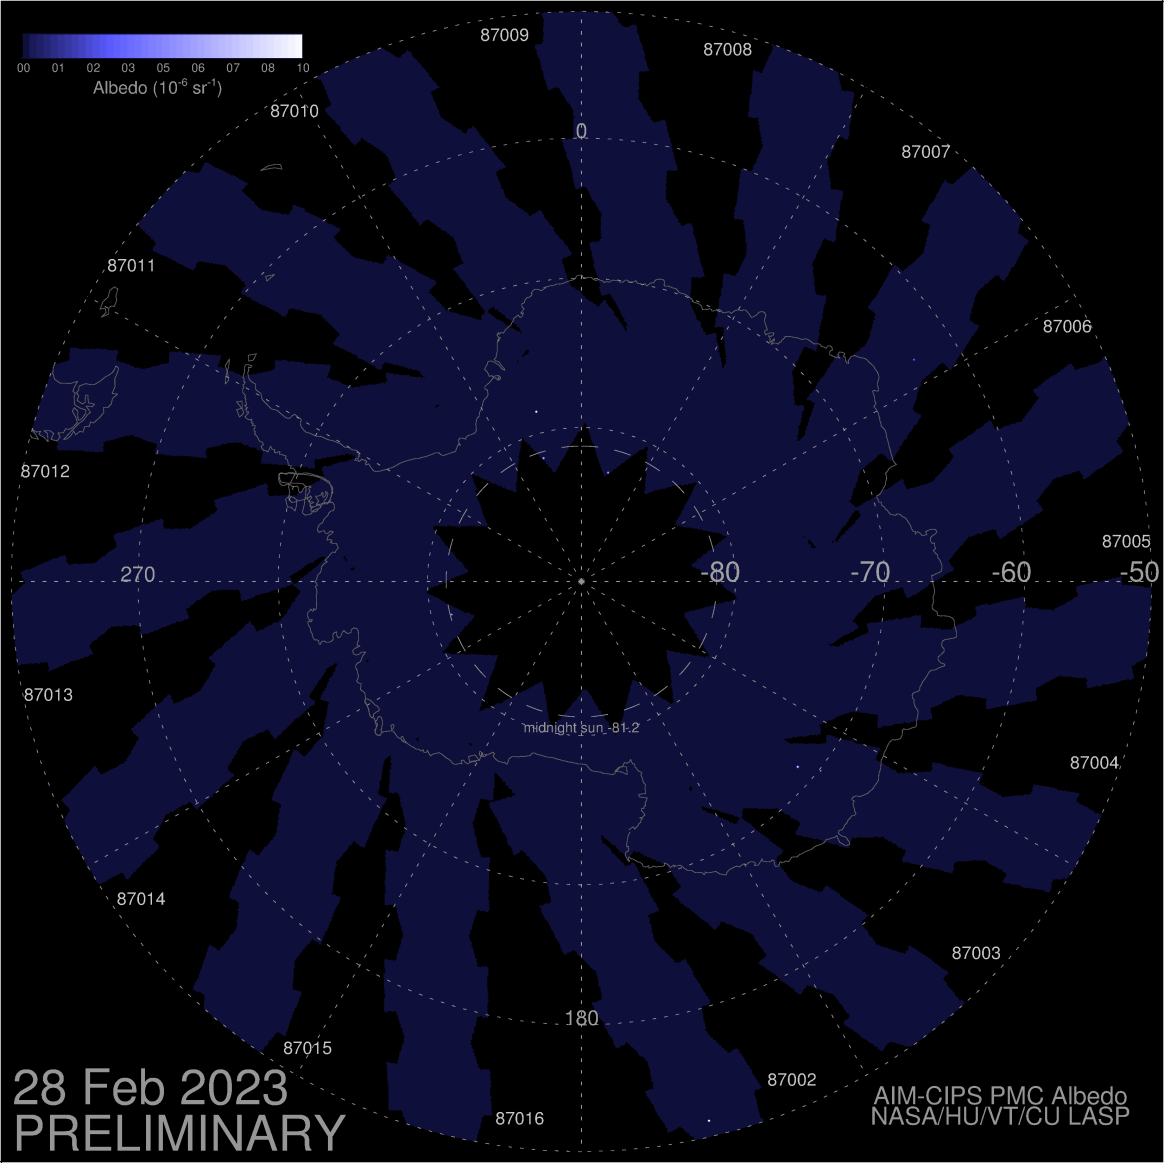
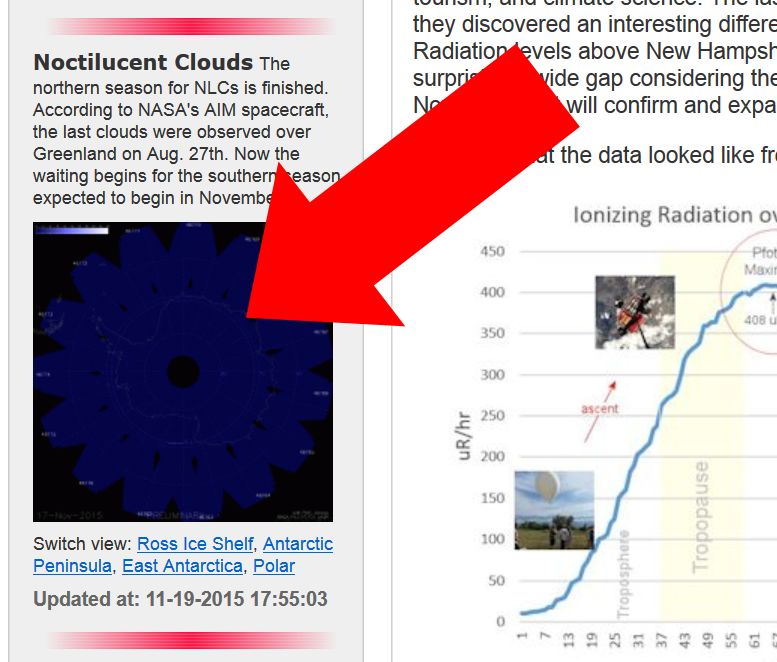
According to Hauksson, "they were nice and bright" -- a comment which both describes the auroras and provides an example of Icelandic understatement. The auroras are subsiding now, but they could flare up again as Earth moves through the turbulent wake of the CME. NOAA forecasters estimate a 60% chance of renewed geomagnetic storms on Nov. 19th. Aurora alerts: text or voice Realtime Aurora Photo Gallery WAITING FOR NOCTILUCENT CLOUDS: Summer is the season for noctilucent clouds (NLCs)--icy wisps of electric-blue that float at the edge of space. This means NLCs should be appearing soon over Antarctica, where summer is nigh. NASA's AIM spacecraft has started monitoring the south pole, but so far the maps are blank: 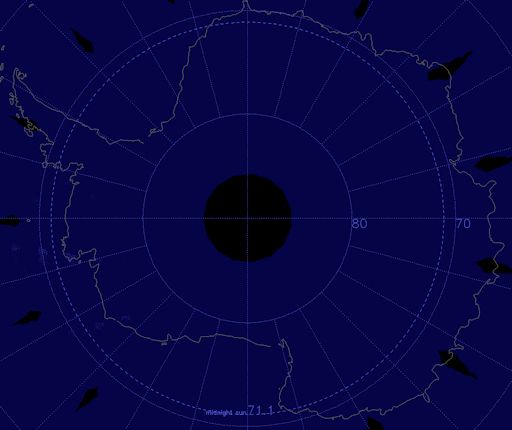
"Previous seasons in the southern hemisphere have started anywhere from 17 November to 16 December," says Cora Randall, a member of the AIM science team and the chair of the Department of Atmospheric and Oceanic Sciences at the University of Colorado. "It seems to depend on when winds in the southern stratosphere shift to their summer-ly state. This year the polar vortex in the lower stratosphere is very large, which suggests that the season will have a late start." Researchers will be watching with interest. Last year's season for southern NLCs was unusual. The clouds varied strangely and they completely disappeared for a few weeks after the solstice when they are normally most abundant. What does this mean? Previous research shows that NLCs are a sensitive indicator of long-range teleconnections in Earth's atmosphere, which link weather and climate across hemispheres. The strange behavior of noctilucent clouds in 2014-2015 could be a sign of previously unknown linkages. Are these linkages still at work? Will the southern NLCs of 2015-2016 "misbehave" again? Answers will be revealed in data from the AIM spacecraft, which has been studying NLCs from Earth orbit since 2007. You can monitor the latest images from AIM right here on Spaceweather.com. Realtime Noctilucent Cloud Photo Gallery TRANSCONTINENTAL SPACE WEATHER BALLOON LAUNCH: The students of Earth to Sky Calculus, Spaceweather.com, and physicists from the University of New Hampshire are preparing their second transcontinental launch of space weather balloons. On Saturday morning, Nov. 21st, two identical balloons equipped with radiation detectors will lift off from opposite sides of the USA. The goal of the experiment is to explore how cosmic rays affect Earth's atmosphere on continental scales. 
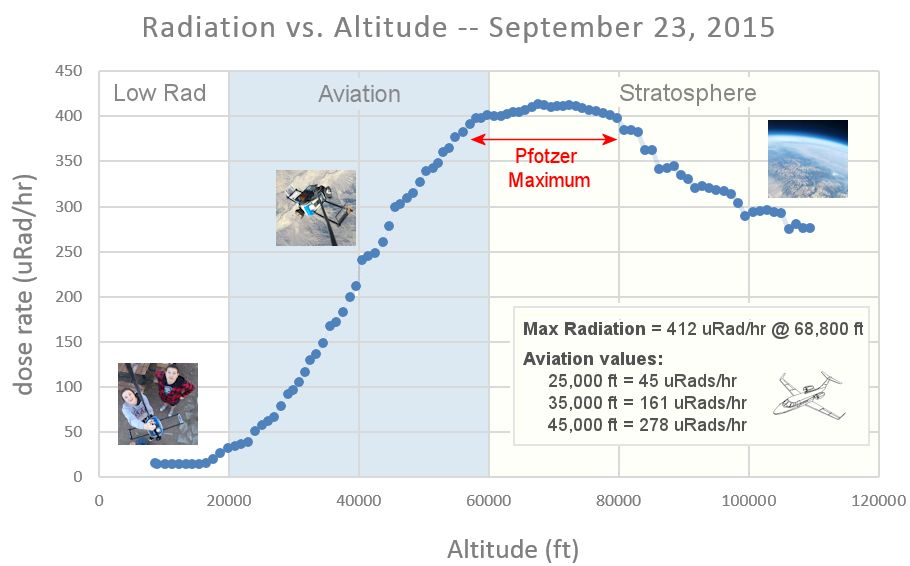
Flying simultaneously, the balloons will ascend all the way to the stratosphere, sampling X-rays and gamma-rays at altitudes of interest to aviation, space tourism, and climate science. The last time the teams did this, on July 20, 2015, they discovered an interesting difference between California and New Hampshire: Radiation levels above New Hampshire were more than 25% higher, a surprisingly wide gap considering their relatively small difference in latitude. The Nov. 21st flight will confirm and expand upon these findings. Here are what the data looked like from the previous transcontinental flight: 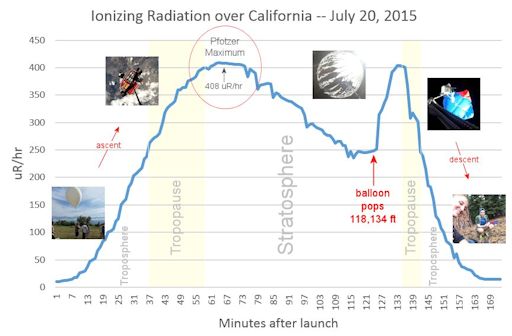
The graph shows how radiation levels over California changed as the balloon ascended toward the stratosphere, then parachuted back to Earth. A California vs. New Hampshire plot highlights the extra radiation over the Granite State. Is it still there? Stay tuned! Realtime Space Weather Photo Gallery
Realtime Meteor Photo Gallery Every night, a network of NASA all-sky cameras scans the skies above the United States for meteoritic fireballs. Automated software maintained by NASA's Meteoroid Environment Office calculates their orbits, velocity, penetration depth in Earth's atmosphere and many other characteristics. Daily results are presented here on Spaceweather.com. On Nov. 19, 2015, the network reported 61 fireballs.
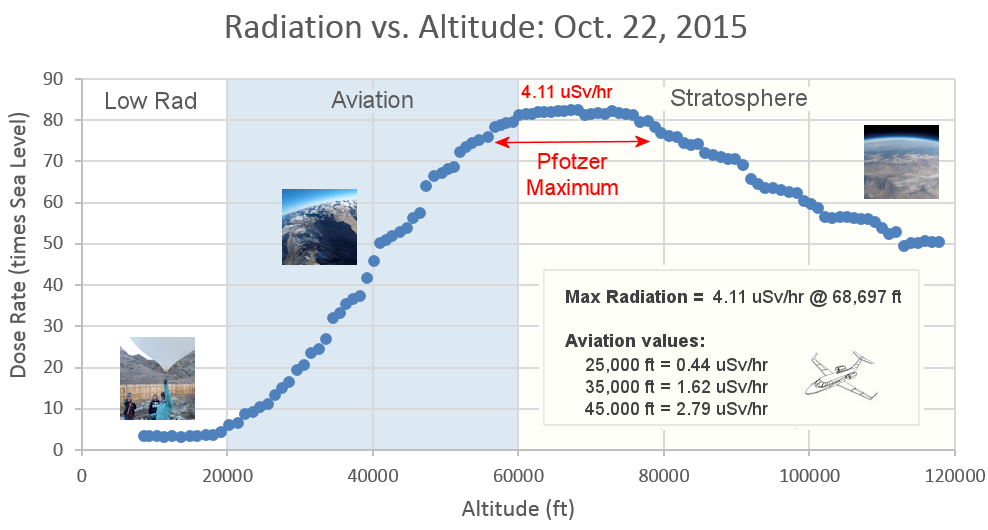
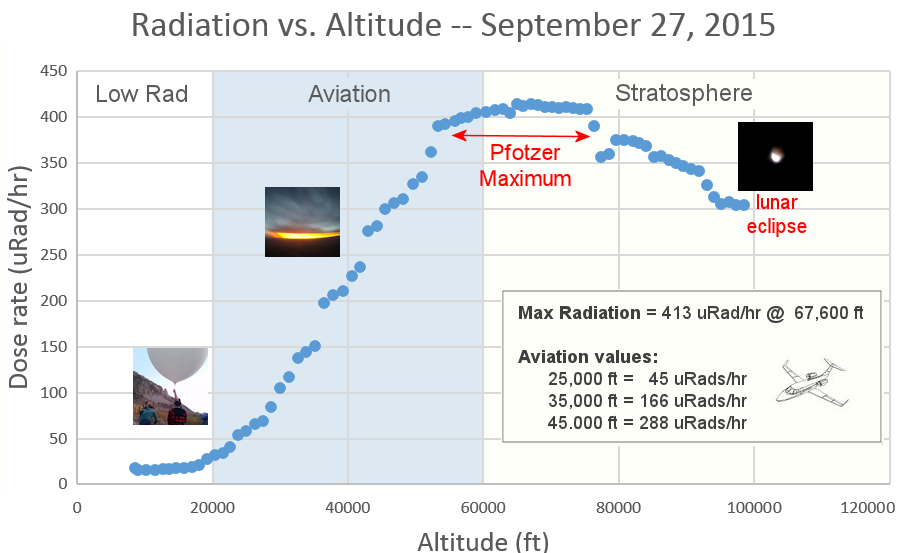
(31 sporadics, 24 Leonids, 6 Northern Taurids)  In this diagram of the inner solar system, all of the fireball orbits intersect at a single point--Earth. The orbits are color-coded by velocity, from slow (red) to fast (blue). [Larger image] [movies] Potentially Hazardous Asteroids ( PHAs) are space rocks larger than approximately 100m that can come closer to Earth than 0.05 AU. None of the known PHAs is on a collision course with our planet, although astronomers are finding new ones all the time. On November 19, 2015 there were potentially hazardous asteroids. Notes: LD means "Lunar Distance." 1 LD = 384,401 km, the distance between Earth and the Moon. 1 LD also equals 0.00256 AU. MAG is the visual magnitude of the asteroid on the date of closest approach. | | Cosmic Rays in the Atmosphere | | Situation Report -- Oct. 30, 2015 | Stratospheric Radiation (+37o N) | | Cosmic ray levels are elevated (+6.1% above the Space Age median). The trend is flat. Cosmic ray levels have increased +0% in the past month. | | Sept. 06: 4.14 uSv/hr (414 uRad/hr) | | Sept. 12: 4.09 uSv/hr (409 uRad/hr) | | Sept. 23: 4.12 uSv/hr (412 uRad/hr) | | Sept. 25: 4.16 uSv/hr (416 uRad/hr) | | Sept. 27: 4.13 uSv/hr (413 uRad/hr) | | Oct. 11: 4.02 uSv/hr (402 uRad/hr) | | Oct. 22: 4.11 uSv/hr (411 uRad/hr) | These measurements are based on regular space weather balloon flights: learn more. Approximately once a week, Spaceweather.com and the students of Earth to Sky Calculus fly "space weather balloons" to the stratosphere over California. These balloons are equipped with radiation sensors that detect cosmic rays, a surprisingly "down to Earth" form of space weather. Cosmic rays can seed clouds, trigger lightning, and penetrate commercial airplanes. Our measurements show that someone flying back and forth across the continental USA, just once, can absorb as much ionizing radiation as 2 to 5 dental X-rays. Here is the data from our latest flight, Oct. 22nd: 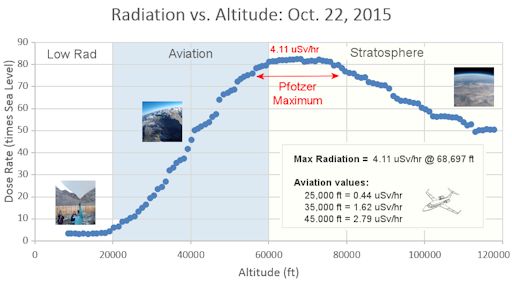
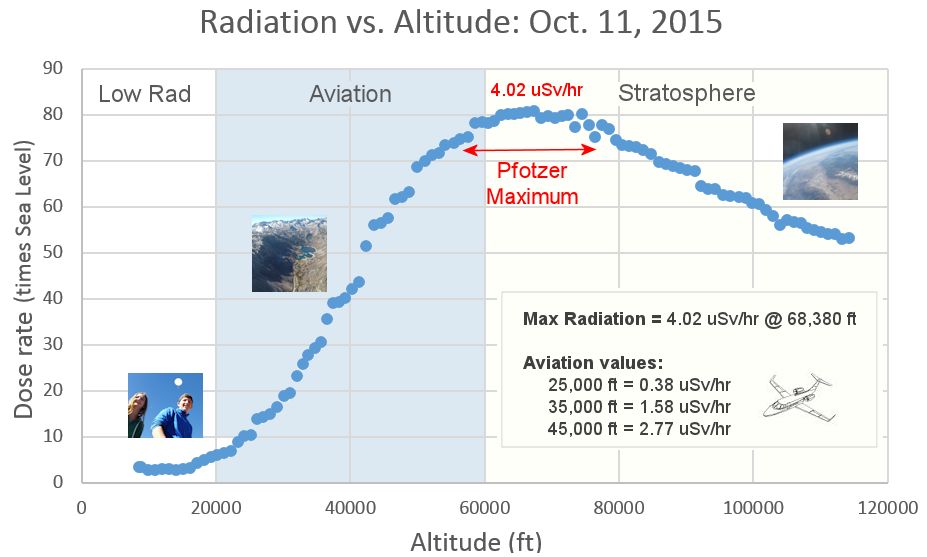
Radiation levels peak at the entrance to the stratosphere in a broad region called the "Pfotzer Maximum." This peak is named after physicist George Pfotzer who discovered it using balloons and Geiger tubes in the 1930s. Radiation levels there are more than 80x sea level. Note that the bottom of the Pfotzer Maximim is near 55,000 ft. This means that some high-flying aircraft are not far from the zone of maximum radiation. Indeed, according to the Oct 22th measurements, a plane flying at 45,000 feet is exposed to 2.79 uSv/hr. At that rate, a passenger would absorb about one dental X-ray's worth of radiation in about 5 hours. The radiation sensors onboard our helium balloons detect X-rays and gamma-rays in the energy range 10 keV to 20 MeV. These energies span the range of medical X-ray machines and airport security scanners. | | The official U.S. government space weather bureau | | | The first place to look for information about sundogs, pillars, rainbows and related phenomena. | | | Researchers call it a "Hubble for the sun." SDO is the most advanced solar observatory ever. | | | 3D views of the sun from NASA's Solar and Terrestrial Relations Observatory | | | Realtime and archival images of the Sun from SOHO. | | | from the NOAA Space Environment Center | | | the underlying science of space weather | | 


