 | | | Switch to: Europe, USA, New Zealand, Antarctica Credit: NOAA/Ovation  Planetary K-index Planetary K-index
Now: Kp= 1 quiet
24-hr max: Kp= 3 quiet
explanation | more data
Interplanetary Mag. Field
Btotal: 4.4 nT
Bz: 1.0 nT north
more data: ACE, DSCOVR
Updated: Today at 2352 UT Coronal Holes: 24 Aug 17 
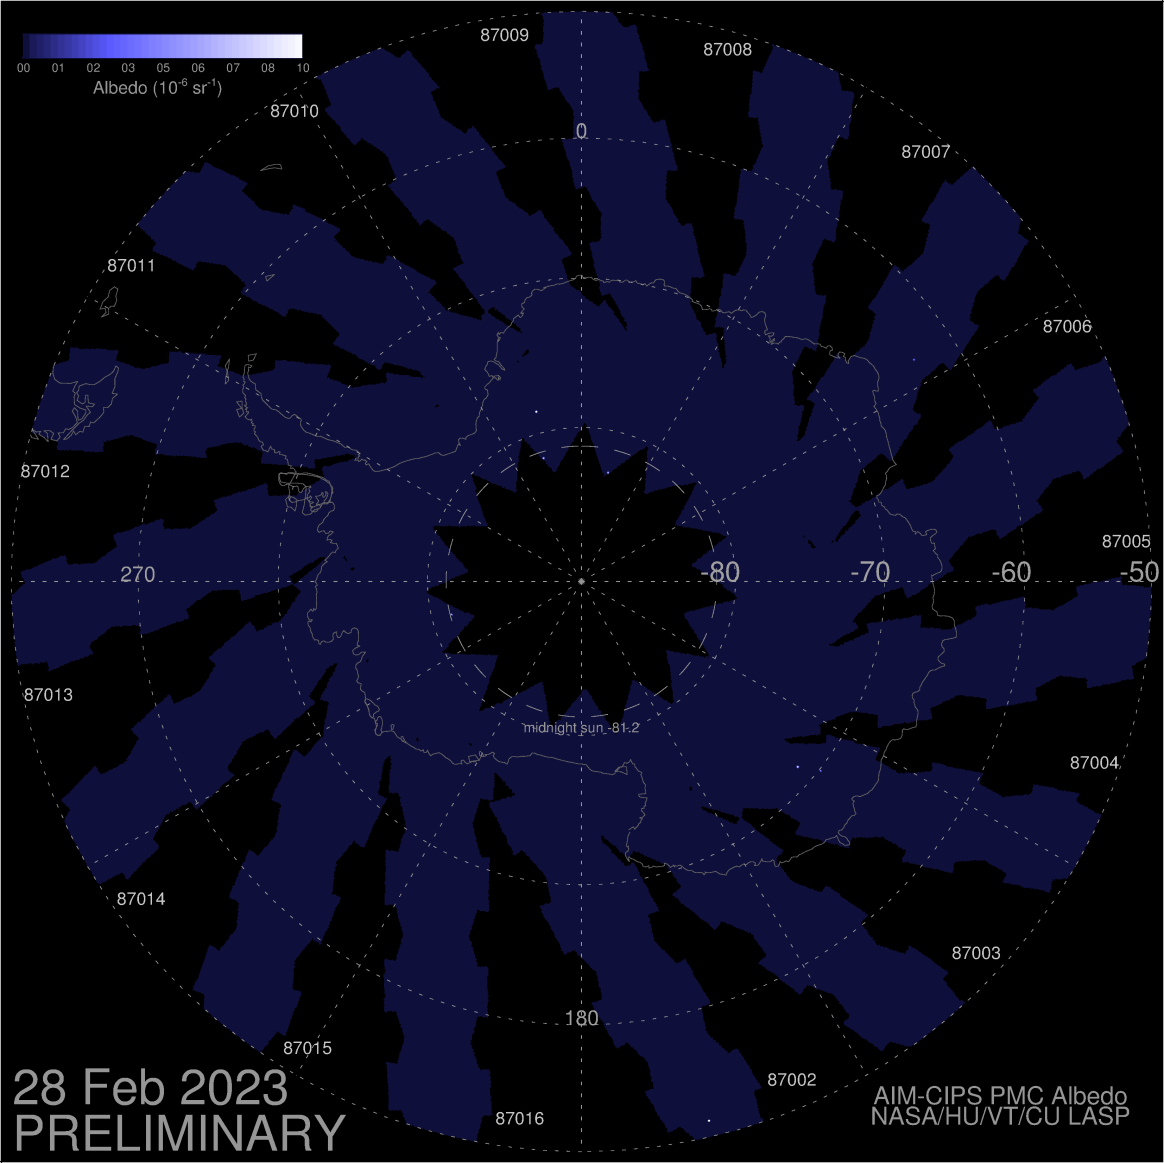
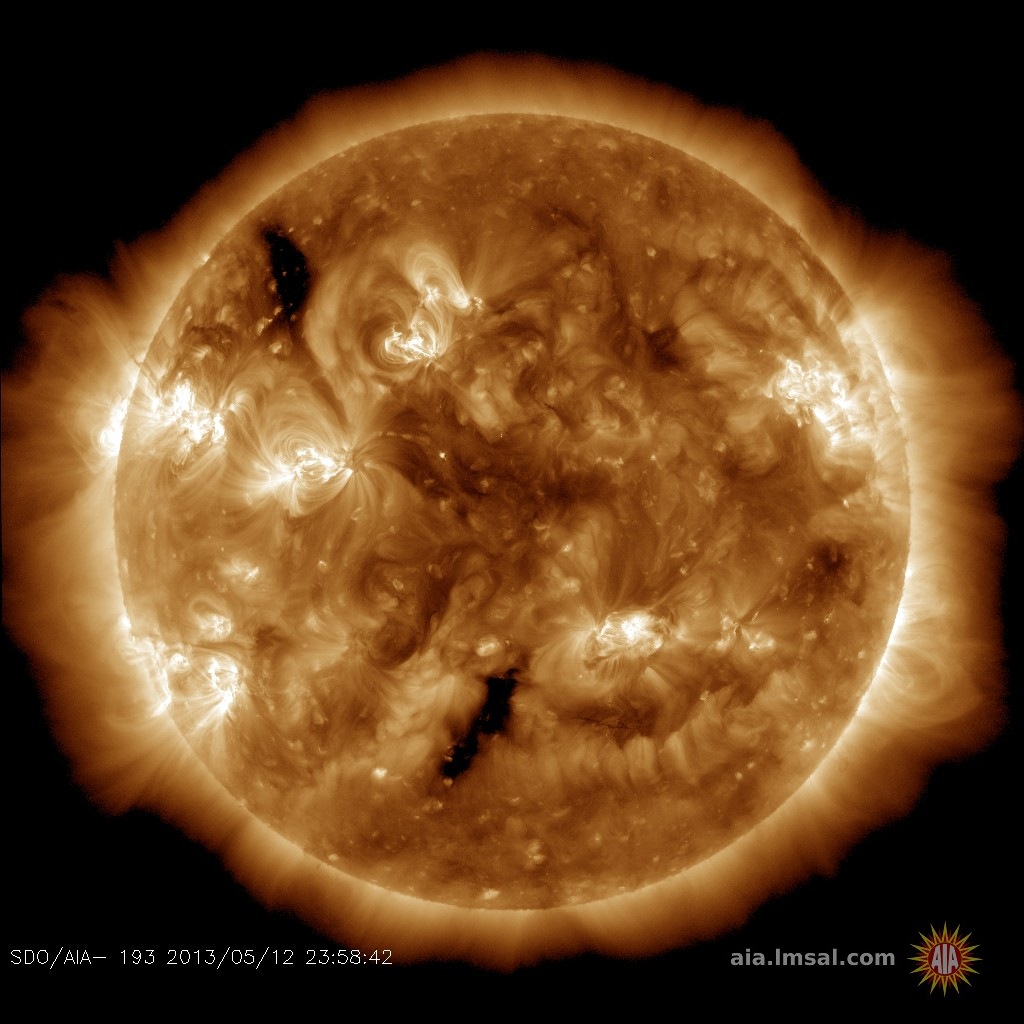
There are no large coronal holes on the Earthside of the sun. Credit: NASA/SDO.  Noctilucent Clouds They're back! Images of noctilucent clouds from NASA's AIM spacecraft are available again. The spacecraft's orbit had recently changed, requiring a new way to point AIM's science instruments. This problem has now been solved, and "daily daisies" have returned to Spaceweather.com. Switch view: Europe, USA, Asia, Polar Updated at: 08-23-2017 16:55:04 Noctilucent Clouds They're back! Images of noctilucent clouds from NASA's AIM spacecraft are available again. The spacecraft's orbit had recently changed, requiring a new way to point AIM's science instruments. This problem has now been solved, and "daily daisies" have returned to Spaceweather.com. Switch view: Europe, USA, Asia, Polar Updated at: 08-23-2017 16:55:04 SPACE WEATHER
NOAA Forecasts | | Updated at: 2017 Aug 23 2200 UTC FLARE | 0-24 hr | 24-48 hr | CLASS M | 15 % | 15 % | CLASS X | 01 % | 01 % | Geomagnetic Storms:
Probabilities for significant disturbances in Earth's magnetic field are given for three activity levels: active, minor storm, severe storm Updated at: 2017 Aug 23 2200 UTC Mid-latitudes | 0-24 hr | 24-48 hr | ACTIVE | 35 % | 15 % | MINOR | 15 % | 05 % | SEVERE | 01 % | 01 % | High latitudes | 0-24 hr | 24-48 hr | ACTIVE | 15 % | 15 % | MINOR | 25 % | 20 % | SEVERE | 35 % | 15 % | | | |  | | | | | | | | | | | Lights Over lapland is excited to announce that Autumn Aurora Adventures are available for immediate booking! Reserve your adventure of a lifetime in Abisko National Park, Sweden today! | | | SLIGHT CHANCE OF FLARES TODAY: There are two sunspots on the Earth-facing side of the sun today: AR2671 and AR2672. Both have 'beta-gamma' magnetic fields that harbor energy for M-class solar flares. NOAA forecasters say there is a 15% chance of such explosions on Aug. 24th and 25th. Any flares from AR2672 would be especially geoeffective as the sunspot is almost directly facing Earth. Free: Solar Flare Alerts UNEXPECTED GEOMAGNETIC STORM: With little warning, an unexpected geomagnetic storm occurred on Aug. 23rd, ringing Earth's poles with the luminous glow of auroras. Peter Sayers photographed the display from the banks of the Forth River in Tasmania, Australia: 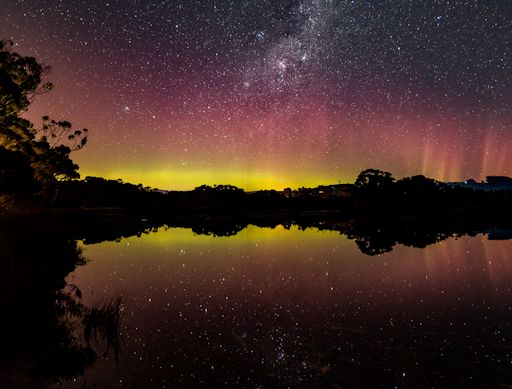
"These fantastic auroras came out of left field while I was watching the southern horizon," says Sayers. "There were beams like search lights for hours--a beautiful naked eye display." What happened? The interplanetary magnetic field (IMF) near Earth tipped south, opening a crack in our planet's magnetosphere. Solar wind blew in through the opening and fueled the display. Realtime Aurora Photo Gallery THE GREAT AMERICAN SOLAR ECLIPSE ... IN EUROPE: Americans weren't the only ones who witnessed an eclipse on August 21st. Some Europeans saw it too. In Portugal, Spain, the UK, Norway and Iceland, the Moon took a bite out of the sun at sunset. Diego González sends this picture from Oviedo, Spain: 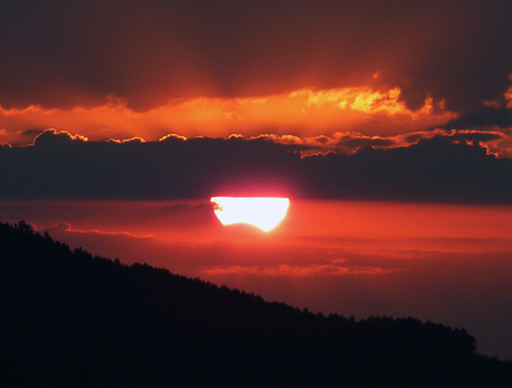
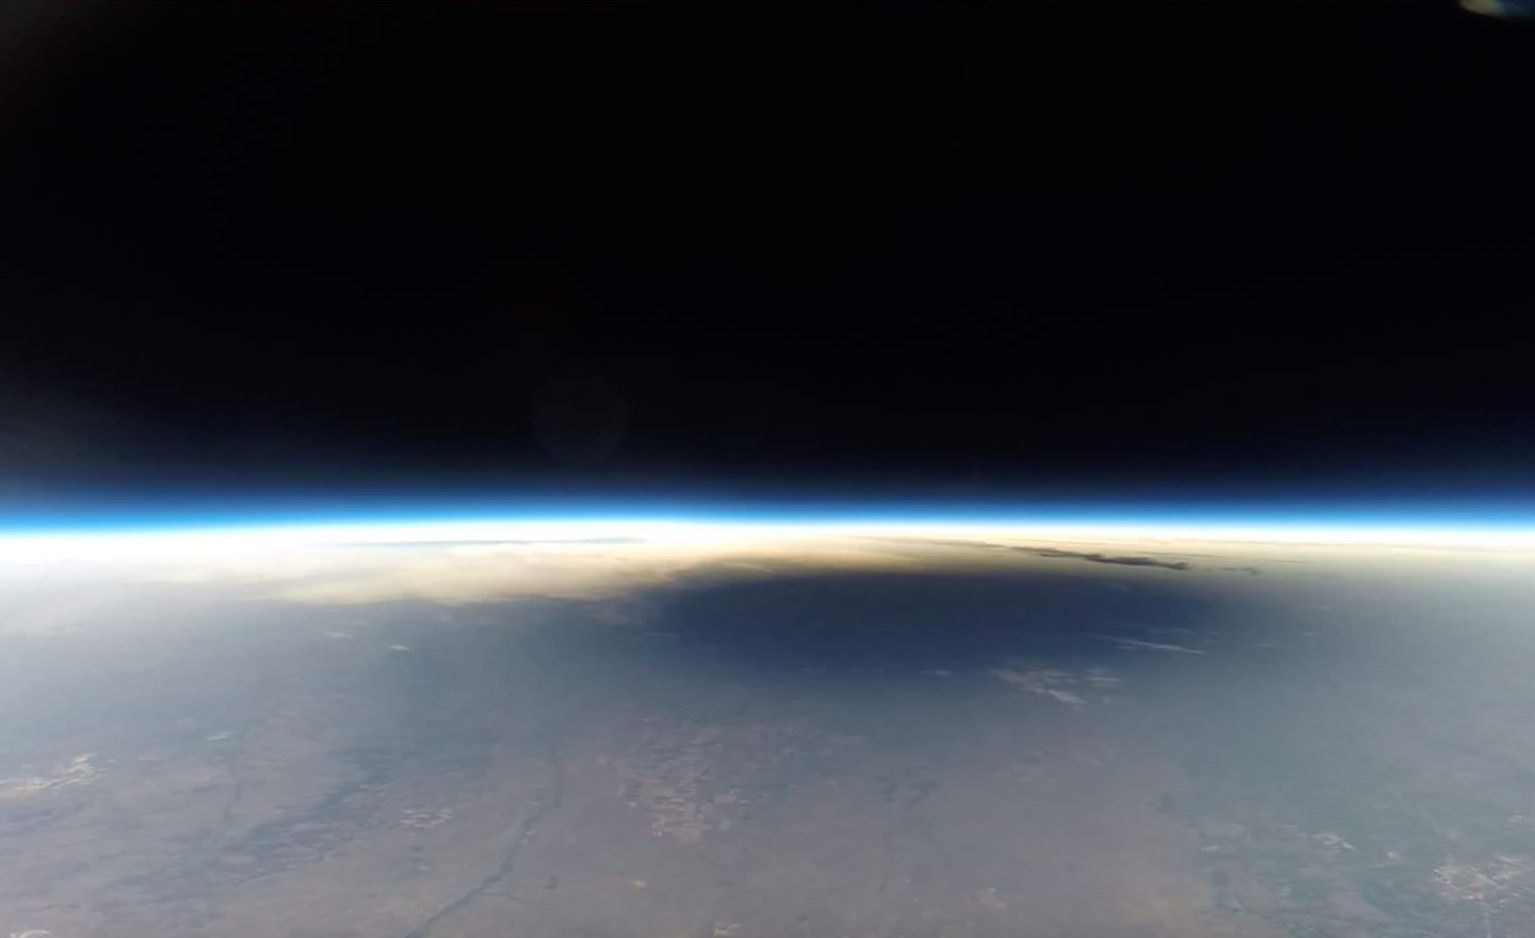
"The Aug. 21st eclipse was visible from northern Spain, but only as a shallow partial eclipse starting around 25 minutes before sunset," says photographer Diego González. "It wasn't the same as totality, but it was still beautiful." Solar Eclipse Photo Gallery SOLAR ECLIPSE IN THE STRATOSPHERE: During the Great American Solar Eclipse on August 21st, Spaceweather.com and Earth to Sky Calculus launched 11 high-altitude balloons carrying more than 20 cameras from the path of totality. We hoped to catch the Moon's shadow sweeping across the landscape from a vantage point in the stratosphere--and we succeeded! This picture shows the inky-black shadow of the Moon darkening a 70 mile-wide patch of Wyoming/Nebraska: 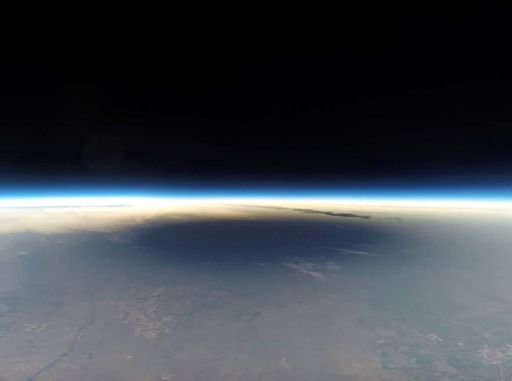
Sponsored by the Southern Maine Community College, the balloon was launched from Ft. Laramie, Wyoming, by a joint team of Earth to Sky students from Maine and California. This is just a single frame of a much longer HD video still being processed by the launch crew. Stay tuned for footage of the shadow in motion.
Far Out Gifts: Earth to Sky Store
All proceeds support hands-on STEM education
Realtime Space Weather Photo Gallery Every night, a network of NASA all-sky cameras scans the skies above the United States for meteoritic fireballs. Automated software maintained by NASA's Meteoroid Environment Office calculates their orbits, velocity, penetration depth in Earth's atmosphere and many other characteristics. Daily results are presented here on Spaceweather.com. On Aug. 24, 2017, the network reported 23 fireballs.
(23 sporadics)  In this diagram of the inner solar system, all of the fireball orbits intersect at a single point--Earth. The orbits are color-coded by velocity, from slow (red) to fast (blue). [Larger image] [movies] Potentially Hazardous Asteroids ( PHAs) are space rocks larger than approximately 100m that can come closer to Earth than 0.05 AU. None of the known PHAs is on a collision course with our planet, although astronomers are finding new ones all the time. On August 24, 2017 there were 1803 potentially hazardous asteroids.  | Recent & Upcoming Earth-asteroid encounters: | Asteroid | Date(UT) | Miss Distance | Velocity (km/s) | Diameter (m) | | 2017 QN2 | 2017-Aug-20 | 0.6 LD | 15.3 | 9 | | 2017 QO1 | 2017-Aug-21 | 10.6 LD | 3.7 | 14 | | 2017 QS16 | 2017-Aug-22 | 3.5 LD | 7.7 | 32 | | 2017 PV25 | 2017-Aug-22 | 5.5 LD | 6.5 | 42 | | 2017 QT1 | 2017-Aug-22 | 2.6 LD | 20.6 | 15 | | 2017 QF3 | 2017-Aug-23 | 1.4 LD | 12.7 | 9 | | 2017 PE | 2017-Aug-24 | 19.4 LD | 7.1 | 47 | | 2017 QJ2 | 2017-Aug-25 | 9.1 LD | 20.2 | 22 | | 2017 QX1 | 2017-Aug-26 | 12.9 LD | 7 | 38 | | 2017 QU1 | 2017-Aug-27 | 16.2 LD | 10.1 | 37 | | 2017 PL26 | 2017-Aug-28 | 14.2 LD | 8.4 | 126 | | 2017 QN1 | 2017-Aug-30 | 5.5 LD | 10.5 | 17 | | 2017 QP2 | 2017-Aug-30 | 10.1 LD | 7.5 | 33 | | 2017 QQ1 | 2017-Aug-31 | 4.8 LD | 10.2 | 39 | | 3122 | 2017-Sep-01 | 18.5 LD | 13.5 | 5376 | | 2017 OP68 | 2017-Sep-10 | 20 LD | 11.7 | 296 | | 2014 RC | 2017-Sep-11 | 15.1 LD | 8.9 | 16 | | 2017 PR25 | 2017-Sep-23 | 17.9 LD | 13.5 | 224 | | 1989 VB | 2017-Sep-29 | 7.9 LD | 6.3 | 408 | | 2012 TC4 | 2017-Oct-12 | 0.1 LD | 7.6 | 16 | | 2005 TE49 | 2017-Oct-13 | 8.5 LD | 11.2 | 16 | | 2013 UM9 | 2017-Oct-15 | 17 LD | 7.8 | 39 | | 2006 TU7 | 2017-Oct-18 | 18.7 LD | 13.3 | 148 | | 171576 | 2017-Oct-22 | 5.8 LD | 21.2 | 677 | Notes: LD means "Lunar Distance." 1 LD = 384,401 km, the distance between Earth and the Moon. 1 LD also equals 0.00256 AU. MAG is the visual magnitude of the asteroid on the date of closest approach. | | Cosmic Rays in the Atmosphere |
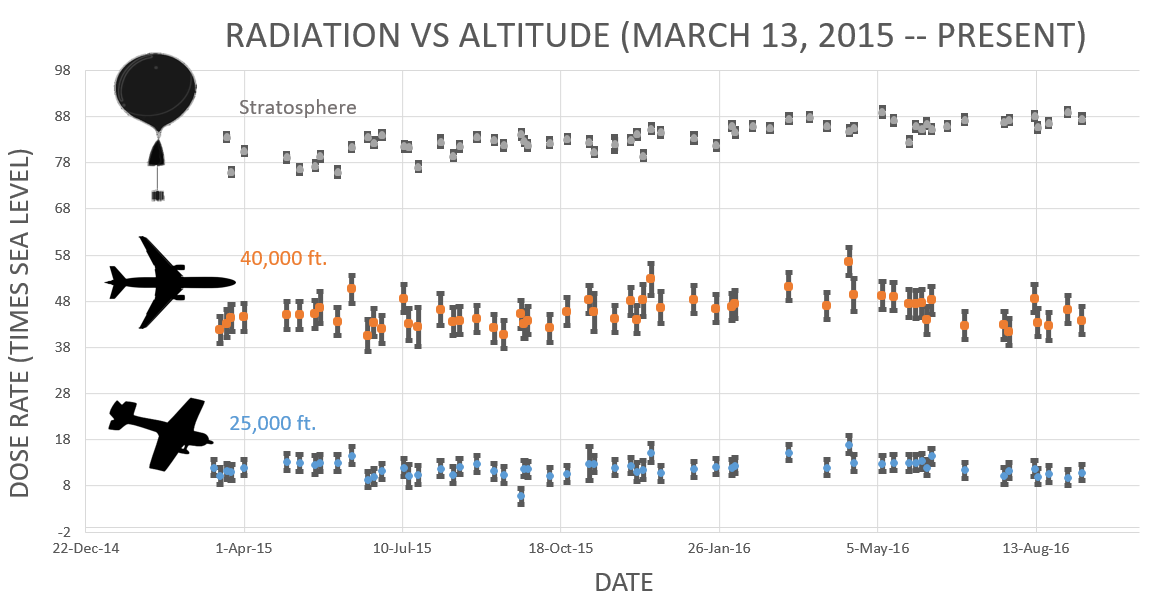
Readers, thank you for your patience while we continue to develop this new section of Spaceweather.com. We've been working to streamline our data reduction, allowing us to post results from balloon flights much more rapidly, and we have developed a new data product, shown here: 
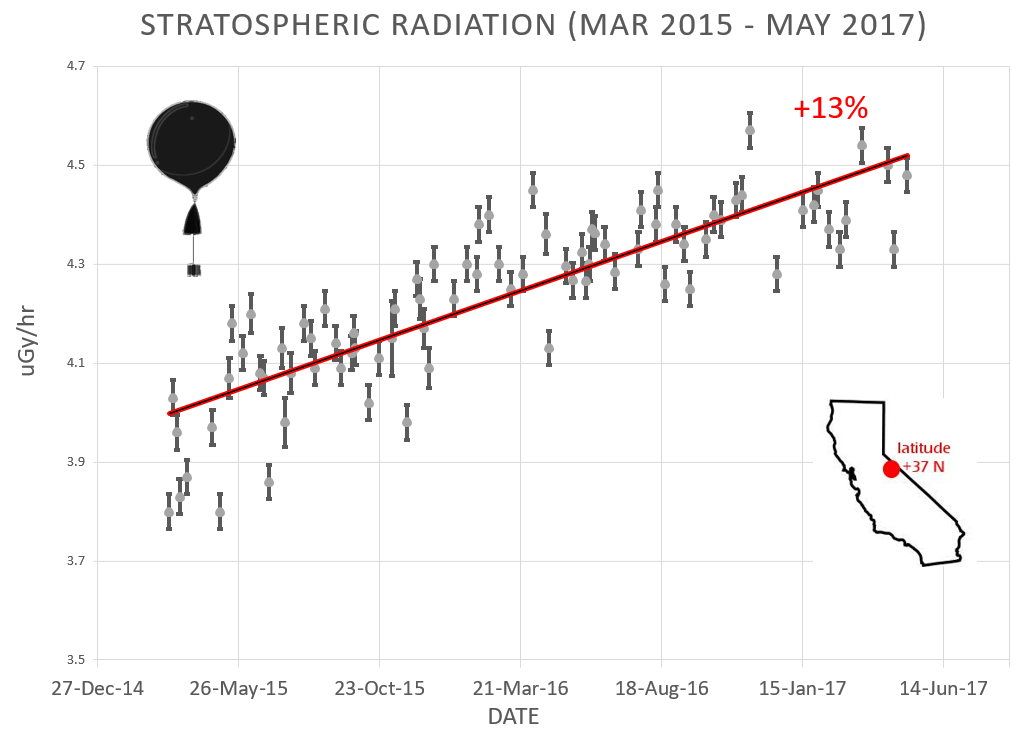
This plot displays radiation measurements not only in the stratosphere, but also at aviation altitudes. Dose rates are expessed as multiples of sea level. For instance, we see that boarding a plane that flies at 25,000 feet exposes passengers to dose rates ~10x higher than sea level. At 40,000 feet, the multiplier is closer to 50x. These measurements are made by our usual cosmic ray payload as it passes through aviation altitudes en route to the stratosphere over California. What is this all about? Approximately once a week, Spaceweather.com and the students of Earth to Sky Calculus fly space weather balloons to the stratosphere over California. These balloons are equipped with radiation sensors that detect cosmic rays, a surprisingly "down to Earth" form of space weather. Cosmic rays can seed clouds, trigger lightning, and penetrate commercial airplanes. Furthermore, there are studies ( #1, #2, #3, #4) linking cosmic rays with cardiac arrhythmias and sudden cardiac death in the general population. Our latest measurements show that cosmic rays are intensifying, with an increase of more than 13% since 2015: 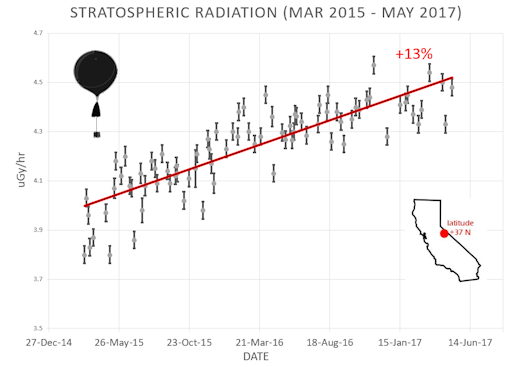
Why are cosmic rays intensifying? The main reason is the sun. Solar storm clouds such as coronal mass ejections (CMEs) sweep aside cosmic rays when they pass by Earth. During Solar Maximum, CMEs are abundant and cosmic rays are held at bay. Now, however, the solar cycle is swinging toward Solar Minimum, allowing cosmic rays to return. Another reason could be the weakening of Earth's magnetic field, which helps protect us from deep-space radiation. The radiation sensors onboard our helium balloons detect X-rays and gamma-rays in the energy range 10 keV to 20 MeV. These energies span the range of medical X-ray machines and airport security scanners. The data points in the graph above correspond to the peak of the Reneger-Pfotzer maximum, which lies about 67,000 feet above central California. When cosmic rays crash into Earth's atmosphere, they produce a spray of secondary particles that is most intense at the entrance to the stratosphere. Physicists Eric Reneger and Georg Pfotzer discovered the maximum using balloons in the 1930s and it is what we are measuring today. | | The official U.S. government space weather bureau | | | The first place to look for information about sundogs, pillars, rainbows and related phenomena. | | | Researchers call it a "Hubble for the sun." SDO is the most advanced solar observatory ever. | | | 3D views of the sun from NASA's Solar and Terrestrial Relations Observatory | | | Realtime and archival images of the Sun from SOHO. | | | from the NOAA Space Environment Center | | | a proud supporter of science education and Spaceweather.com | | | fun to read, but should be taken with a grain of salt! Forecasts looking ahead more than a few days are often wrong. | | | from the NOAA Space Environment Center | | | the underlying science of space weather |  | Beautyz for top beauty products reviews and their buying guides | | Reviews here can help you to pick up best memory foam mattresses. | | | These links help Spaceweather.com stay online. Thank you to our supporters! | | | | | | | | |  | | |  | ©2017 Spaceweather.com. All rights reserved. This site is penned daily by Dr. Tony Phillips. | |


