Solar minimum is here - but even now strangely beautiful auroras are dancing around the poles. Deep inside the Arctic Circle, the expert guides of Aurora Holidays in Utsjoki, Finland, can help you chase them. Book now! | | |
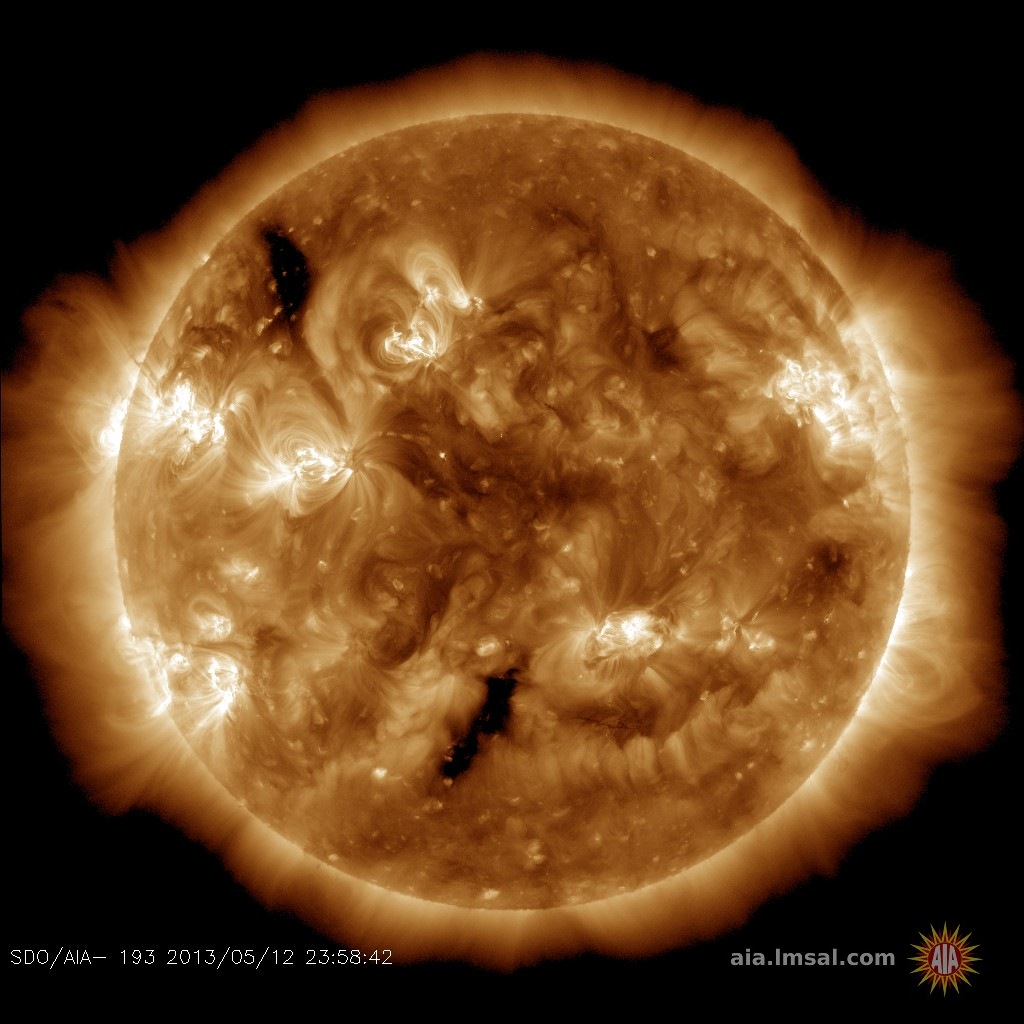
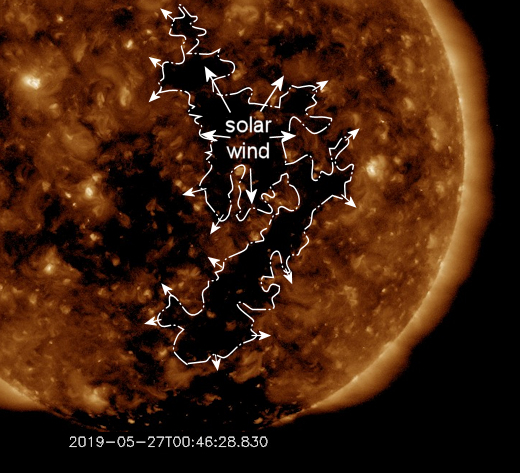
SOLAR WIND SPARKS RAINBOW AURORAS: Earth is inside a stream of high-speed solar wind flowing from a hole in the sun's atmosphere. First contact with the gaseous material on May 29th produced an outburst of rainbow auroras over Canada and a green "ET" over the South Pole. Solar wind effects could continue for another ~24 hours as Earth moves through the stream. Aurora alerts: SMS Text.
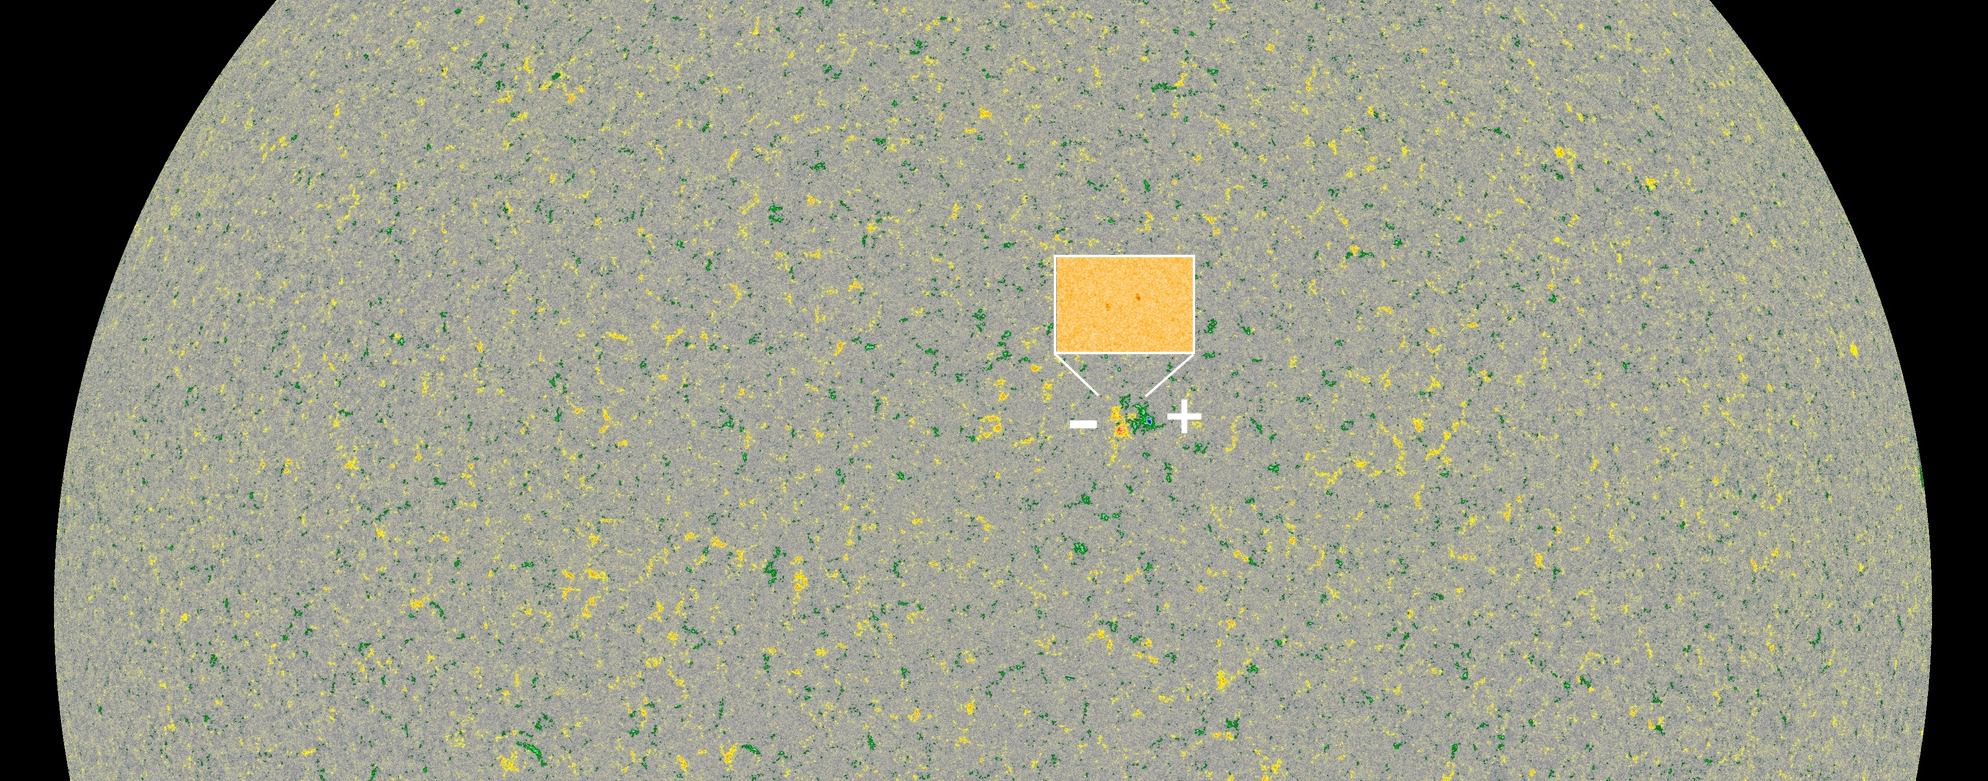
A SUNSPOT FROM THE NEXT SOLAR CYCLE: Getting tired of Solar Minimum? Good news: It won't last forever. In fact, the next solar cycle made a brief appearance this week. On May 28th, a small sunspot materialized in the sun's northern hemisphere, then, hours later, vanished again. The polarity of its magnetic field marked it as a possible member of Solar Cycle 25:
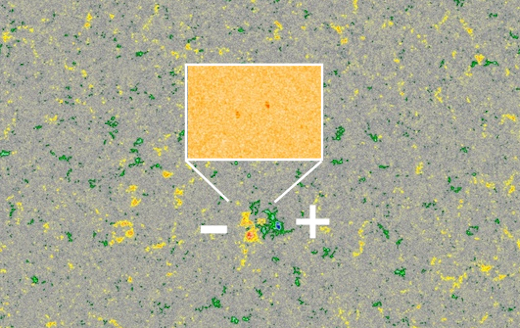
Above: A magnetic map of the solar surface on May 28, 2019. Credit: NASA/SDO
Northern sunspots from old Solar Cycle 24 have a +/- polarity. This ephemeral sunspot was the opposite: -/+. According to Hale's Law, sunspots switch polarities from one solar cycle to the next. The unnumbered sunspot appears to be a herald of Solar Cycle 25.
Solar cycles always mix together at their boundaries. Indeed, ephemeral sunspots possibly belonging to Solar Cycle 25 have already been reported on Dec. 20, 2016, and April 8, 2018, and Nov. 17, 2018. Now we can add May 28, 2019, to list. The slow transition between Solar Cycle 24 and Solar Cycle 25 appears to be underway.
Realtime Space Weather Photo Gallery
Free: Spaceweather.com Newsletter
FISHING IN THE STRATOSPHERE: Father's Day is less than 3 weeks away. Just in time for giftgiving, we present the first fishing lure in space. This unique hook, inscribed with the message "I love you more than you love fishing," hitched a ride onboard an Earth to Sky Calculus cosmic ray balloon on May 17, 2019, reaching an altitude of 117,454 feet:
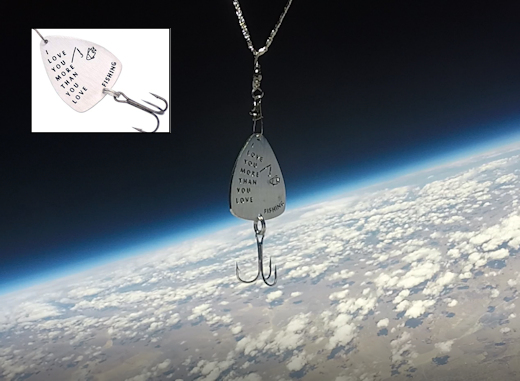
You can have it for $99.95. The students are selling these lures to support their cosmic ray ballooning program--an increasing necessity because of the worldwide helium shortage. Each hook comes with a greeting card showing the item in flight and telling the story of its journey to the edge of space and back.
Far Out Gifts: Earth to Sky Store
All sales support hands-on STEM education
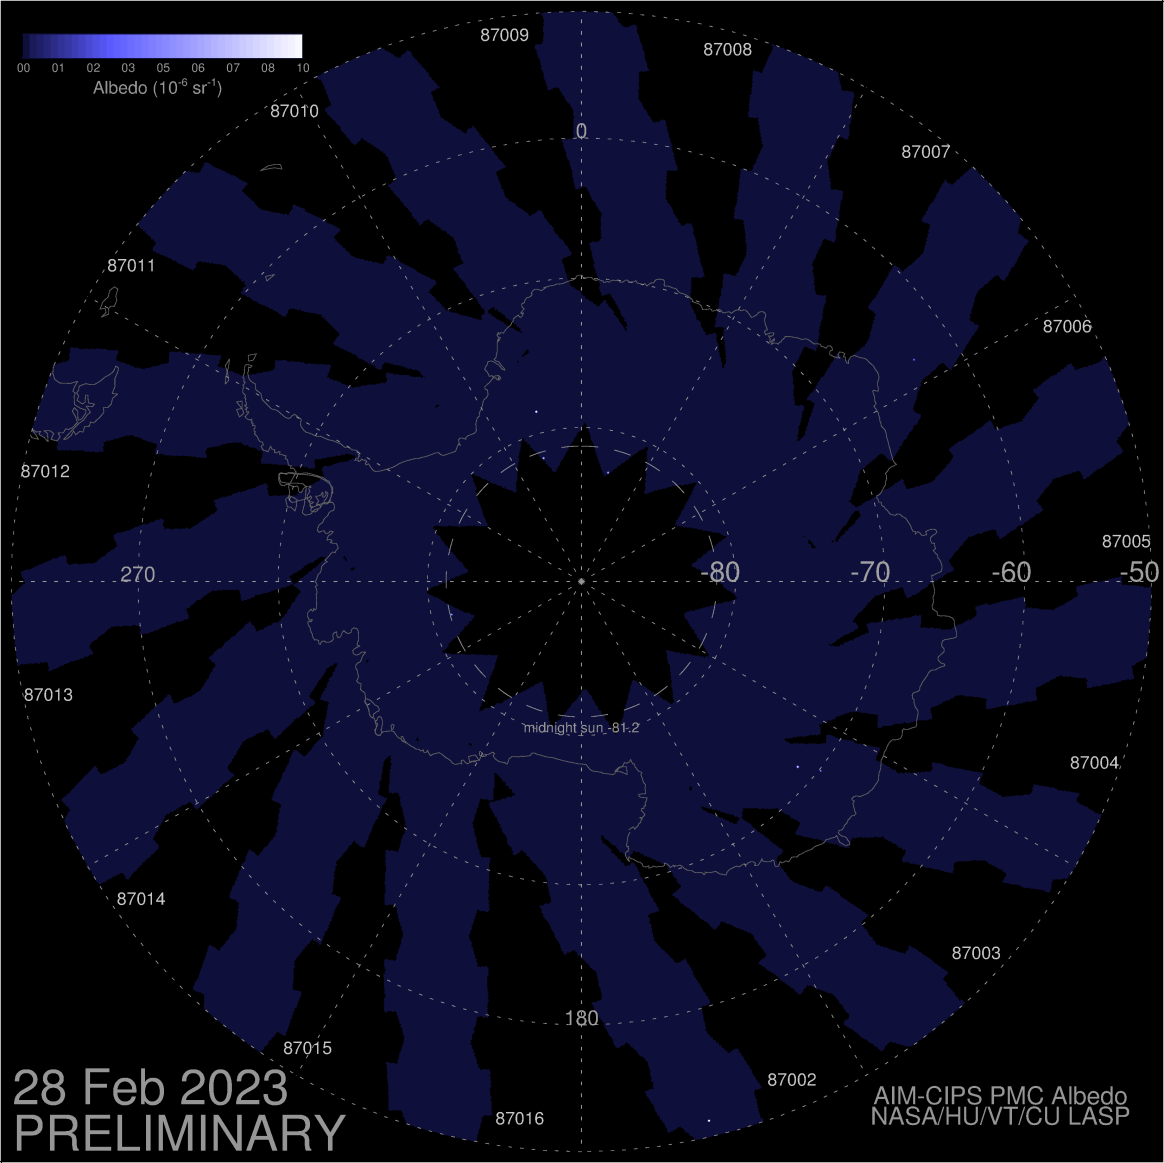
NOCTILUCENT CLOUDS TURN ON: Noctilucent clouds are rapidly spreading around the Arctic Circle. First sighted by NASA's AIM spacecraft on May 20th, small wisps of electric blue have since multiplied in areal coverage by a factor of nearly 200. This 7-day movie from AIM's CIPS instrument shows their development:
NLCs are Earth's highest clouds. Seeded by meteoroids, they float at the edge of space more than 80 km above the planet's surface. The clouds are very cold and filled with tiny ice crystals. When sunbeams hit those crystals, they glow electric-blue.
Previous data from AIM have shown that NLCs are like a great "geophysical light bulb." They turn on every year in late spring, reaching almost full intensity over a period of 10 days. This is happening now, and observers on the ground are beginning to see them.
On May 29th in Kiel, Germany, Laura Kranich witnessed bright electric-blue tendrils reaching up from the northern horizon. "Wow, I'm really stunned!" says Kranich. "The clouds covered a huge area of the sky."
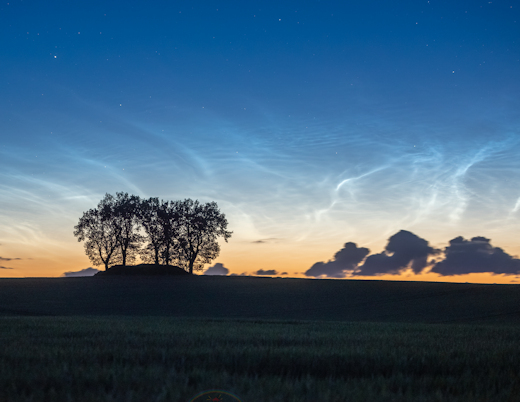
"This is my earliest observation of noctilucent clouds and, considering the fact that it's only May, they were exceptionally bright and well structured," says Kranich. "Seems like this is going to become a great season!"
Previous studies have shown that noctilucent clouds sometimes intensify during solar minimum. Solar minimum conditions are in effect now as the sun has been without spots for 11 consecutive days--a situation that may favor the frosting of meteor smoke high above Earth. Monitor the NLC photo gallery for more sightings.
Realtime Noctilucent Cloud Photo Gallery
Free: Spaceweather.com Newsletter
Realtime Aurora Photo Gallery
Realtime Space Weather Photo Gallery
Free: Spaceweather.com Newsletter
Every night, a network of
NASA all-sky cameras scans the skies above the United States for meteoritic fireballs. Automated software maintained by NASA's Meteoroid Environment Office calculates their orbits, velocity, penetration depth in Earth's atmosphere and many other characteristics. Daily results are presented here on Spaceweather.com.
On May. 30, 2019, the network reported 11 fireballs.
(11 sporadics)
In this diagram of the inner solar system, all of the fireball orbits intersect at a single point--Earth. The orbits are color-coded by velocity, from slow (red) to fast (blue). [Larger image] [movies]
Potentially Hazardous Asteroids (
PHAs) are space rocks larger than approximately 100m that can come closer to Earth than 0.05 AU. None of the known PHAs is on a collision course with our planet, although astronomers are finding
new ones all the time.
On May 30, 2019 there were 1983 potentially hazardous asteroids.
 |
Recent & Upcoming Earth-asteroid encounters: | Asteroid | Date(UT) | Miss Distance | Velocity (km/s) | Diameter (m) |
| 2019 KX | 2019-May-25 | 10.5 LD | 9.6 | 23 |
| 2015 KQ18 | 2019-May-25 | 10.7 LD | 13.1 | 30 |
| 2019 KL | 2019-May-25 | 2.1 LD | 14.3 | 18 |
| 66391 | 2019-May-25 | 13.5 LD | 21.5 | 1780 |
| 2019 JD8 | 2019-May-26 | 14.8 LD | 15.1 | 43 |
| 2019 KN | 2019-May-26 | 4 LD | 10.3 | 23 |
| 2019 KT | 2019-May-28 | 0.8 LD | 11.6 | 17 |
| 2003 LH | 2019-May-28 | 15.6 LD | 7.4 | 32 |
| 2019 JH8 | 2019-May-28 | 9.1 LD | 6.9 | 18 |
| 2019 KV | 2019-May-29 | 7.1 LD | 5.6 | 20 |
| 2019 KH | 2019-May-29 | 15.4 LD | 9.8 | 52 |
| 2011 HP | 2019-May-30 | 12.3 LD | 8.4 | 135 |
| 2019 KG2 | 2019-May-30 | 2.7 LD | 12 | 24 |
| 2019 KJ2 | 2019-May-31 | 13.7 LD | 1.7 | 13 |
| 2019 KL2 | 2019-Jun-01 | 8.7 LD | 4.5 | 11 |
| 2019 KU | 2019-Jun-01 | 16.1 LD | 6.1 | 17 |
| 2019 KH1 | 2019-Jun-02 | 10.6 LD | 18.5 | 27 |
| 2012 KZ41 | 2019-Jun-03 | 3.8 LD | 12 | 34 |
| 2019 KE2 | 2019-Jun-04 | 19.9 LD | 9.3 | 46 |
| 2019 KY | 2019-Jun-04 | 5.5 LD | 6.2 | 19 |
| 2019 KS | 2019-Jun-04 | 12.3 LD | 17.6 | 34 |
| 2019 JX2 | 2019-Jun-06 | 13.8 LD | 7 | 42 |
| 2014 MF18 | 2019-Jun-06 | 8.8 LD | 3 | 22 |
| 2019 KJ | 2019-Jun-14 | 12.6 LD | 8.1 | 68 |
| 441987 | 2019-Jun-24 | 7.7 LD | 12.6 | 178 |
| 2008 KV2 | 2019-Jun-27 | 17.8 LD | 11.4 | 195 |
| 2016 NN15 | 2019-Jun-28 | 9.6 LD | 8.4 | 16 |
| 2015 XC352 | 2019-Jul-01 | 11.9 LD | 4.1 | 26 |
| 2016 OF | 2019-Jul-07 | 12.8 LD | 8.5 | 85 |
| 2016 NO56 | 2019-Jul-07 | 3.4 LD | 12.2 | 26 |
| 2016 NJ33 | 2019-Jul-12 | 15 LD | 4.5 | 32 |
| 2015 HM10 | 2019-Jul-24 | 12.2 LD | 9.5 | 68 |
| 2010 PK9 | 2019-Jul-26 | 8.2 LD | 16.5 | 155 |
Notes: LD means "Lunar Distance." 1 LD = 384,401 km, the distance between Earth and the Moon. 1 LD also equals 0.00256 AU. MAG is the visual magnitude of the asteroid on the date of closest approach. | | Cosmic Rays in the Atmosphere |
SOMETHING NEW! We have developed a new predictive model of aviation radiation. It's called E-RAD--short for Empirical RADiation model. We are constantly flying radiation sensors onboard airplanes over the US and and around the world, so far collecting more than 22,000 gps-tagged radiation measurements. Using this unique dataset, we can predict the dosage on any flight over the USA with an error no worse than 15%.
E-RAD lets us do something new: Every day we monitor approximately 1400 flights criss-crossing the 10 busiest routes in the continental USA. Typically, this includes more than 80,000 passengers per day. E-RAD calculates the radiation exposure for every single flight.
The Hot Flights Table is a daily summary of these calculations. It shows the 5 charter flights with the highest dose rates; the 5 commercial flights with the highest dose rates; 5 commercial flights with near-average dose rates; and the 5 commercial flights with the lowest dose rates. Passengers typically experience dose rates that are 20 to 70 times higher than natural radiation at sea level.
To measure radiation on airplanes, we use the same sensors we fly to the stratosphere onboard Earth to Sky Calculus cosmic ray balloons: neutron bubble chambers and X-ray/gamma-ray Geiger tubes sensitive to energies between 10 keV and 20 MeV. These energies span the range of medical X-ray machines and airport security scanners.
Column definitions: (1) The flight number; (2) The maximum dose rate during the flight, expressed in units of natural radiation at sea level; (3) The maximum altitude of the plane in feet above sea level; (4) Departure city; (5) Arrival city; (6) Duration of the flight.
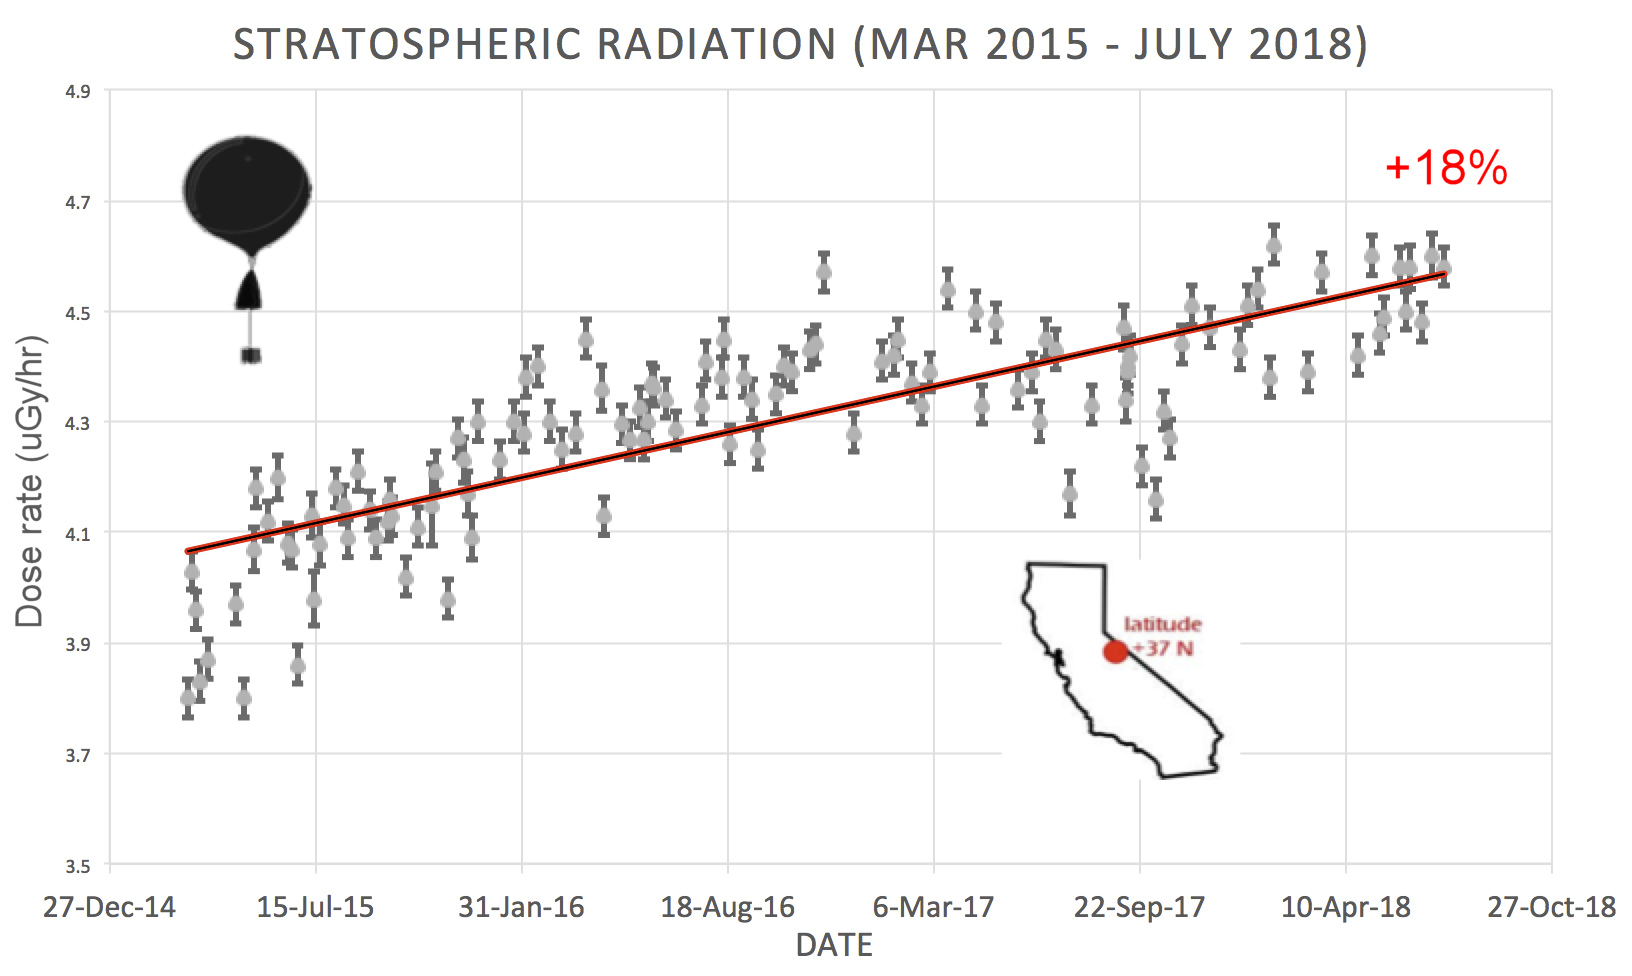
SPACE WEATHER BALLOON DATA: Approximately once a week, Spaceweather.com and the students of Earth to Sky Calculus fly space weather balloons to the stratosphere over California. These balloons are equipped with radiation sensors that detect cosmic rays, a surprisingly "down to Earth" form of space weather. Cosmic rays can seed clouds, trigger lightning, and penetrate commercial airplanes. Furthermore, there are studies ( #1, #2, #3, #4) linking cosmic rays with cardiac arrhythmias and sudden cardiac death in the general population. Our latest measurements show that cosmic rays are intensifying, with an increase of more than 18% since 2015:

The data points in the graph above correspond to the peak of the Reneger-Pfotzer maximum, which lies about 67,000 feet above central California. When cosmic rays crash into Earth's atmosphere, they produce a spray of secondary particles that is most intense at the entrance to the stratosphere. Physicists Eric Reneger and Georg Pfotzer discovered the maximum using balloons in the 1930s and it is what we are measuring today.
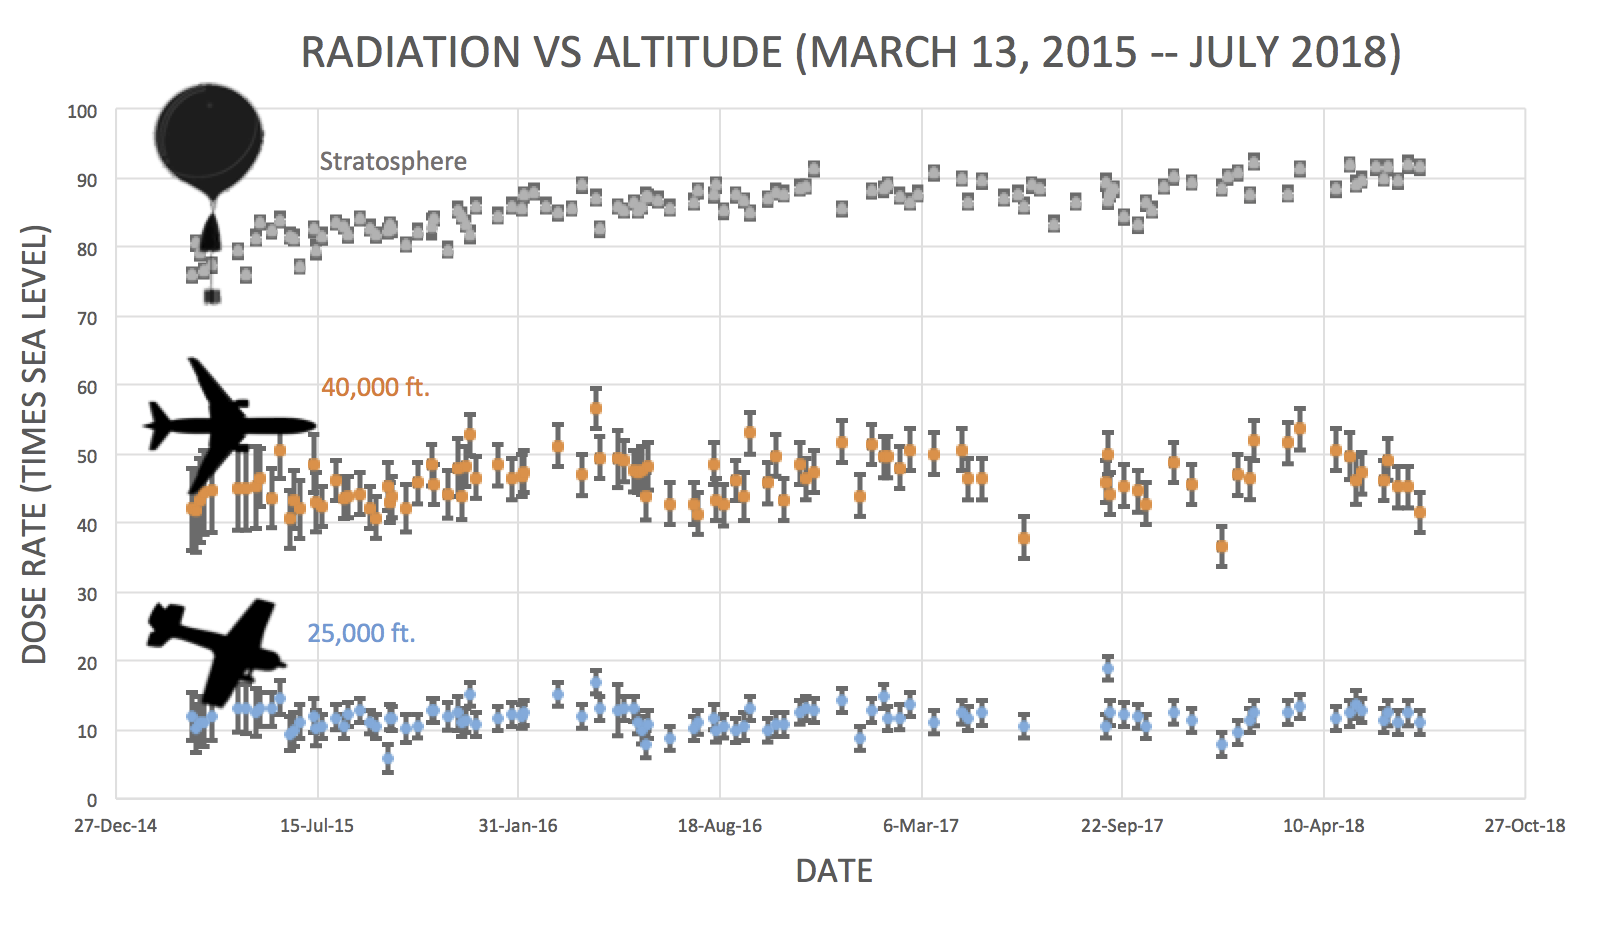
En route to the stratosphere, our sensors also pass through aviation altitudes:

In this plot, dose rates are expessed as multiples of sea level. For instance, we see that boarding a plane that flies at 25,000 feet exposes passengers to dose rates ~10x higher than sea level. At 40,000 feet, the multiplier is closer to 50x.
The radiation sensors onboard our helium balloons detect X-rays and gamma-rays in the energy range 10 keV to 20 MeV. These energies span the range of medical X-ray machines and airport security scanners.
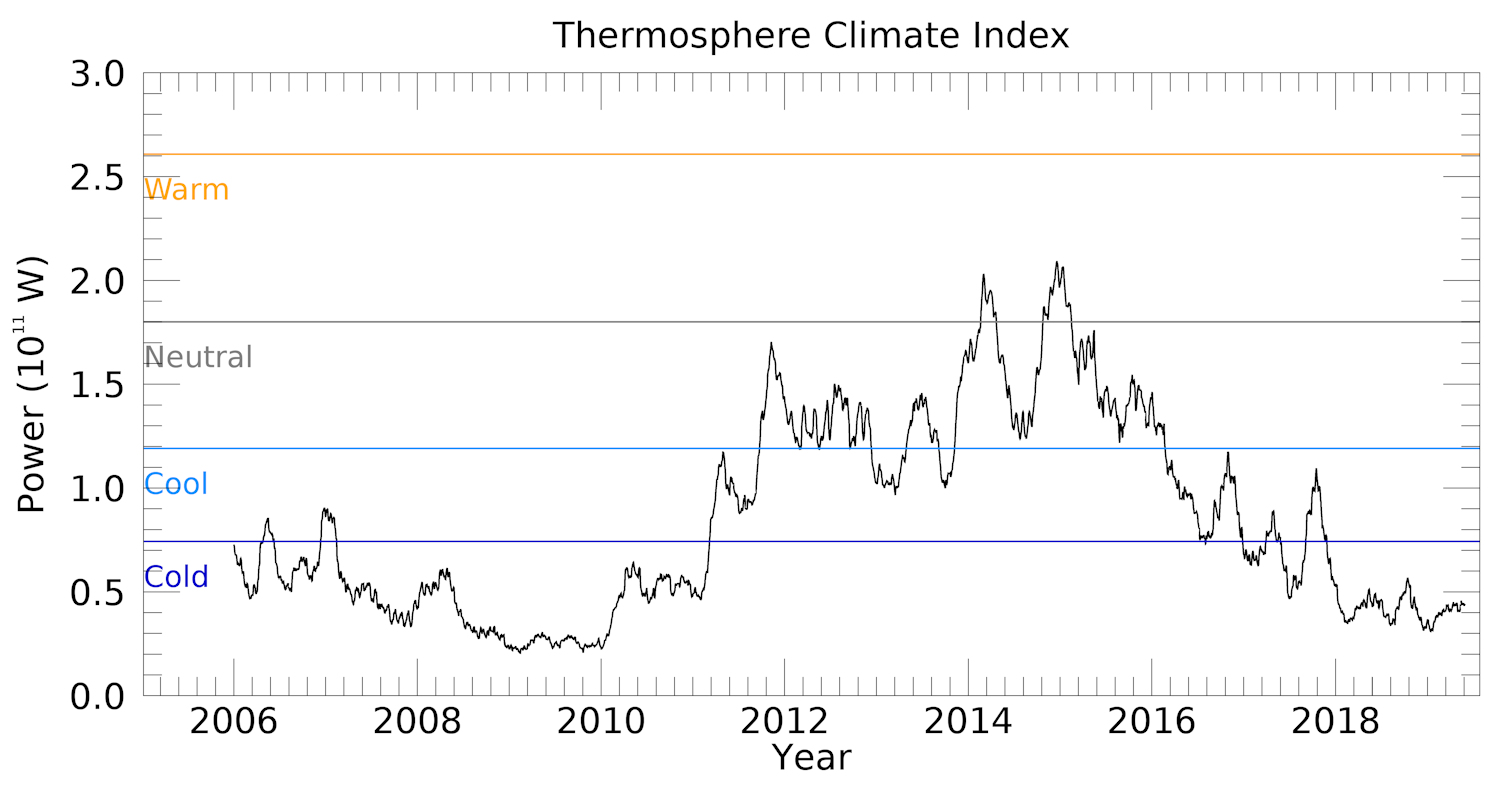
Why are cosmic rays intensifying? The main reason is the sun. Solar storm clouds such as coronal mass ejections (CMEs) sweep aside cosmic rays when they pass by Earth. During Solar Maximum, CMEs are abundant and cosmic rays are held at bay. Now, however, the solar cycle is swinging toward Solar Minimum, allowing cosmic rays to return. Another reason could be the weakening of Earth's magnetic field, which helps protect us from deep-space radiation.
| | The official U.S. government space weather bureau |
| | The first place to look for information about sundogs, pillars, rainbows and related phenomena. |
| | Researchers call it a "Hubble for the sun." SDO is the most advanced solar observatory ever. |
| | 3D views of the sun from NASA's Solar and Terrestrial Relations Observatory |
| | Realtime and archival images of the Sun from SOHO. |
| | from the NOAA Space Environment Center |
| | fun to read, but should be taken with a grain of salt! Forecasts looking ahead more than a few days are often wrong. |
| | from the NOAA Space Environment Center |
| | the underlying science of space weather |
 | To find reviews of new online casino sites in the UK try The Casino DB where there are hundreds of online casino reviews complete with bonuses and ratings. Looking for a new online casino? Try Casimpo the new site dedicated to making online casino simple and easy for all. |
| | These links help Spaceweather.com stay online. Thank you to our supporters! |
| | | | | | |


