All-inclusive Northern Lights trips in Tromsø, Norway. Small groups, big experiences! Highly qualified guides ensure unique and unforgettable adventures with a personal touch. Visit Explore the Arctic | | |
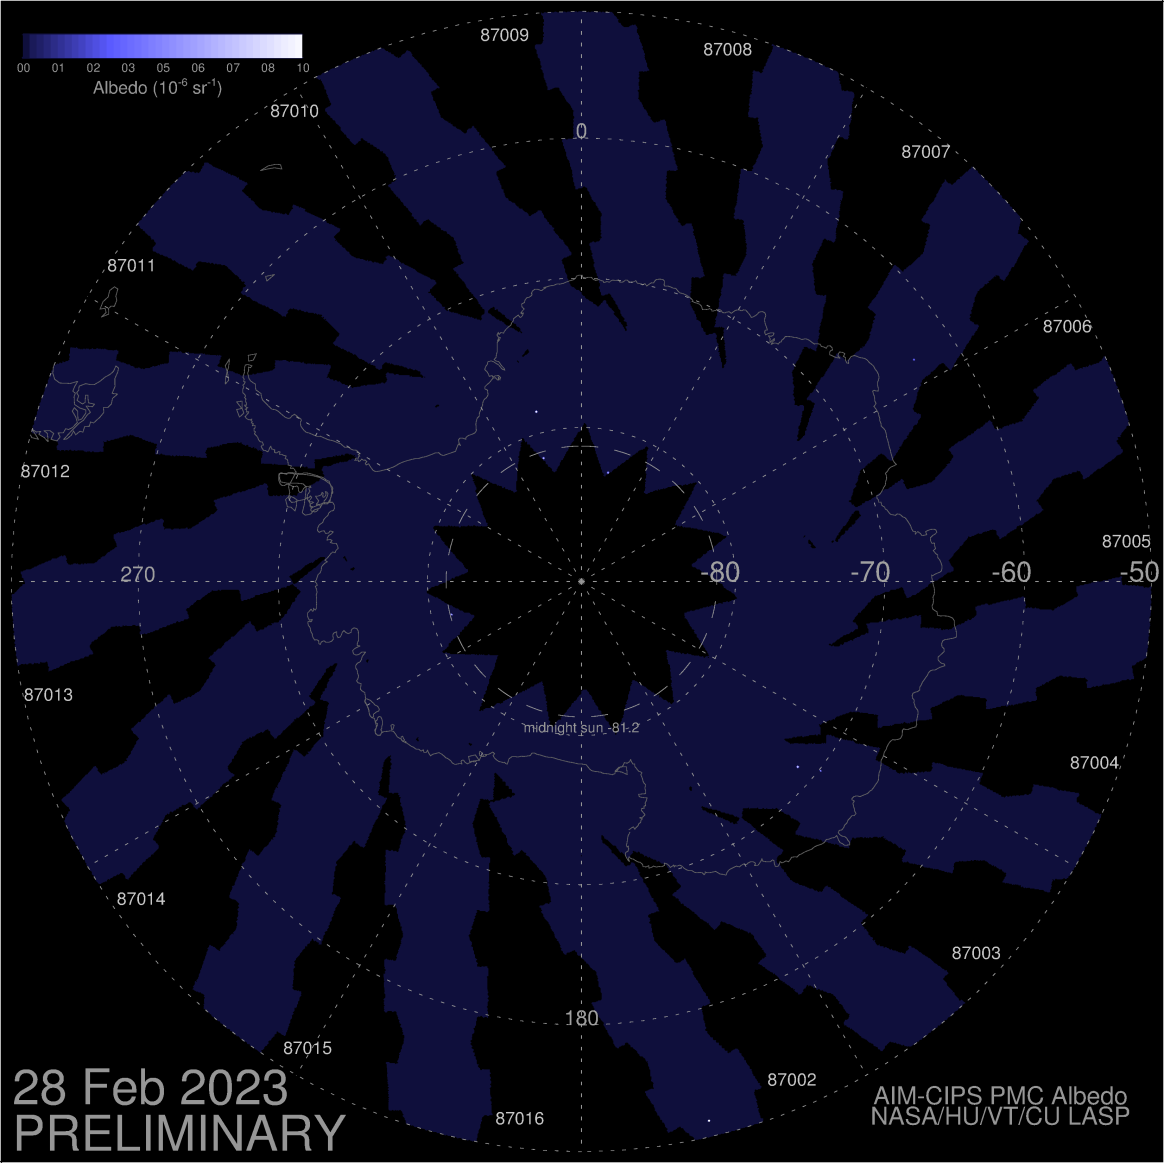
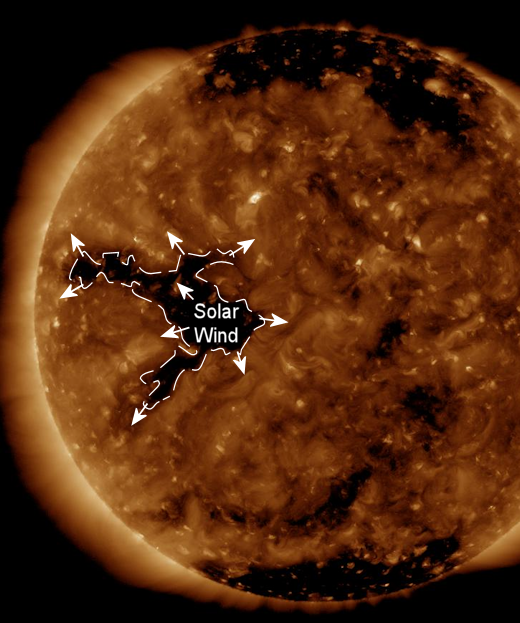
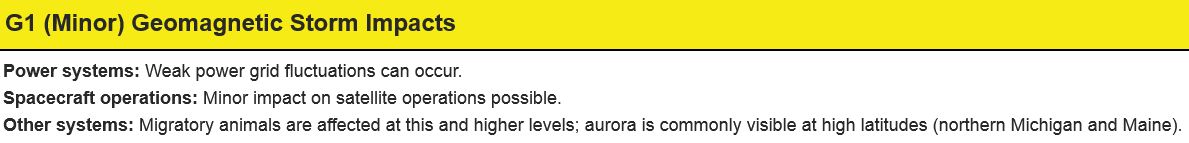
THE FIRST SOLAR WIND STREAM OF MAY: A hole in the sun's atmosphere is turning toward Earth, spewing a stream of solar wind that should reach our planet on May 6th. NOAA forecasters say G1-class geomagnetic storms are possible when the gaseous material arrives. High latitude sky watchers should be alert for weekend auroras, especially in the southern hemisphere where deepening autumn darkness favors the visibility of Southern Lights. Free: Aurora Alerts.
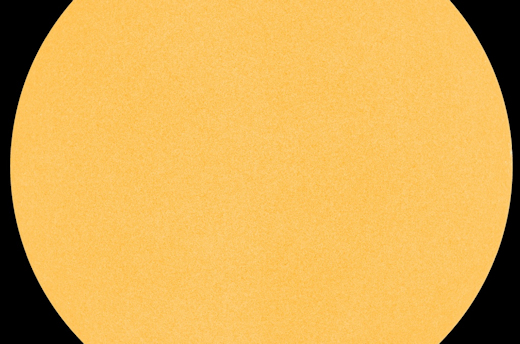
SUNSPOTS VANISHING FASTER THAN EXPECTED: Sunspots are becoming scarce. Very scarce. So far in 2018 the sun has been blank almost 60% of the time, with whole weeks going by without sunspots. Today's sun, shown here in an image from NASA's Solar Dynamics Observatory, is typical of the featureless solar disk:
The fact that sunspots are vanishing comes as no surprise. Forecasters have been saying for years that this would happen as the current solar cycle ("solar cycle 24") comes to an end. The surprise is how fast.
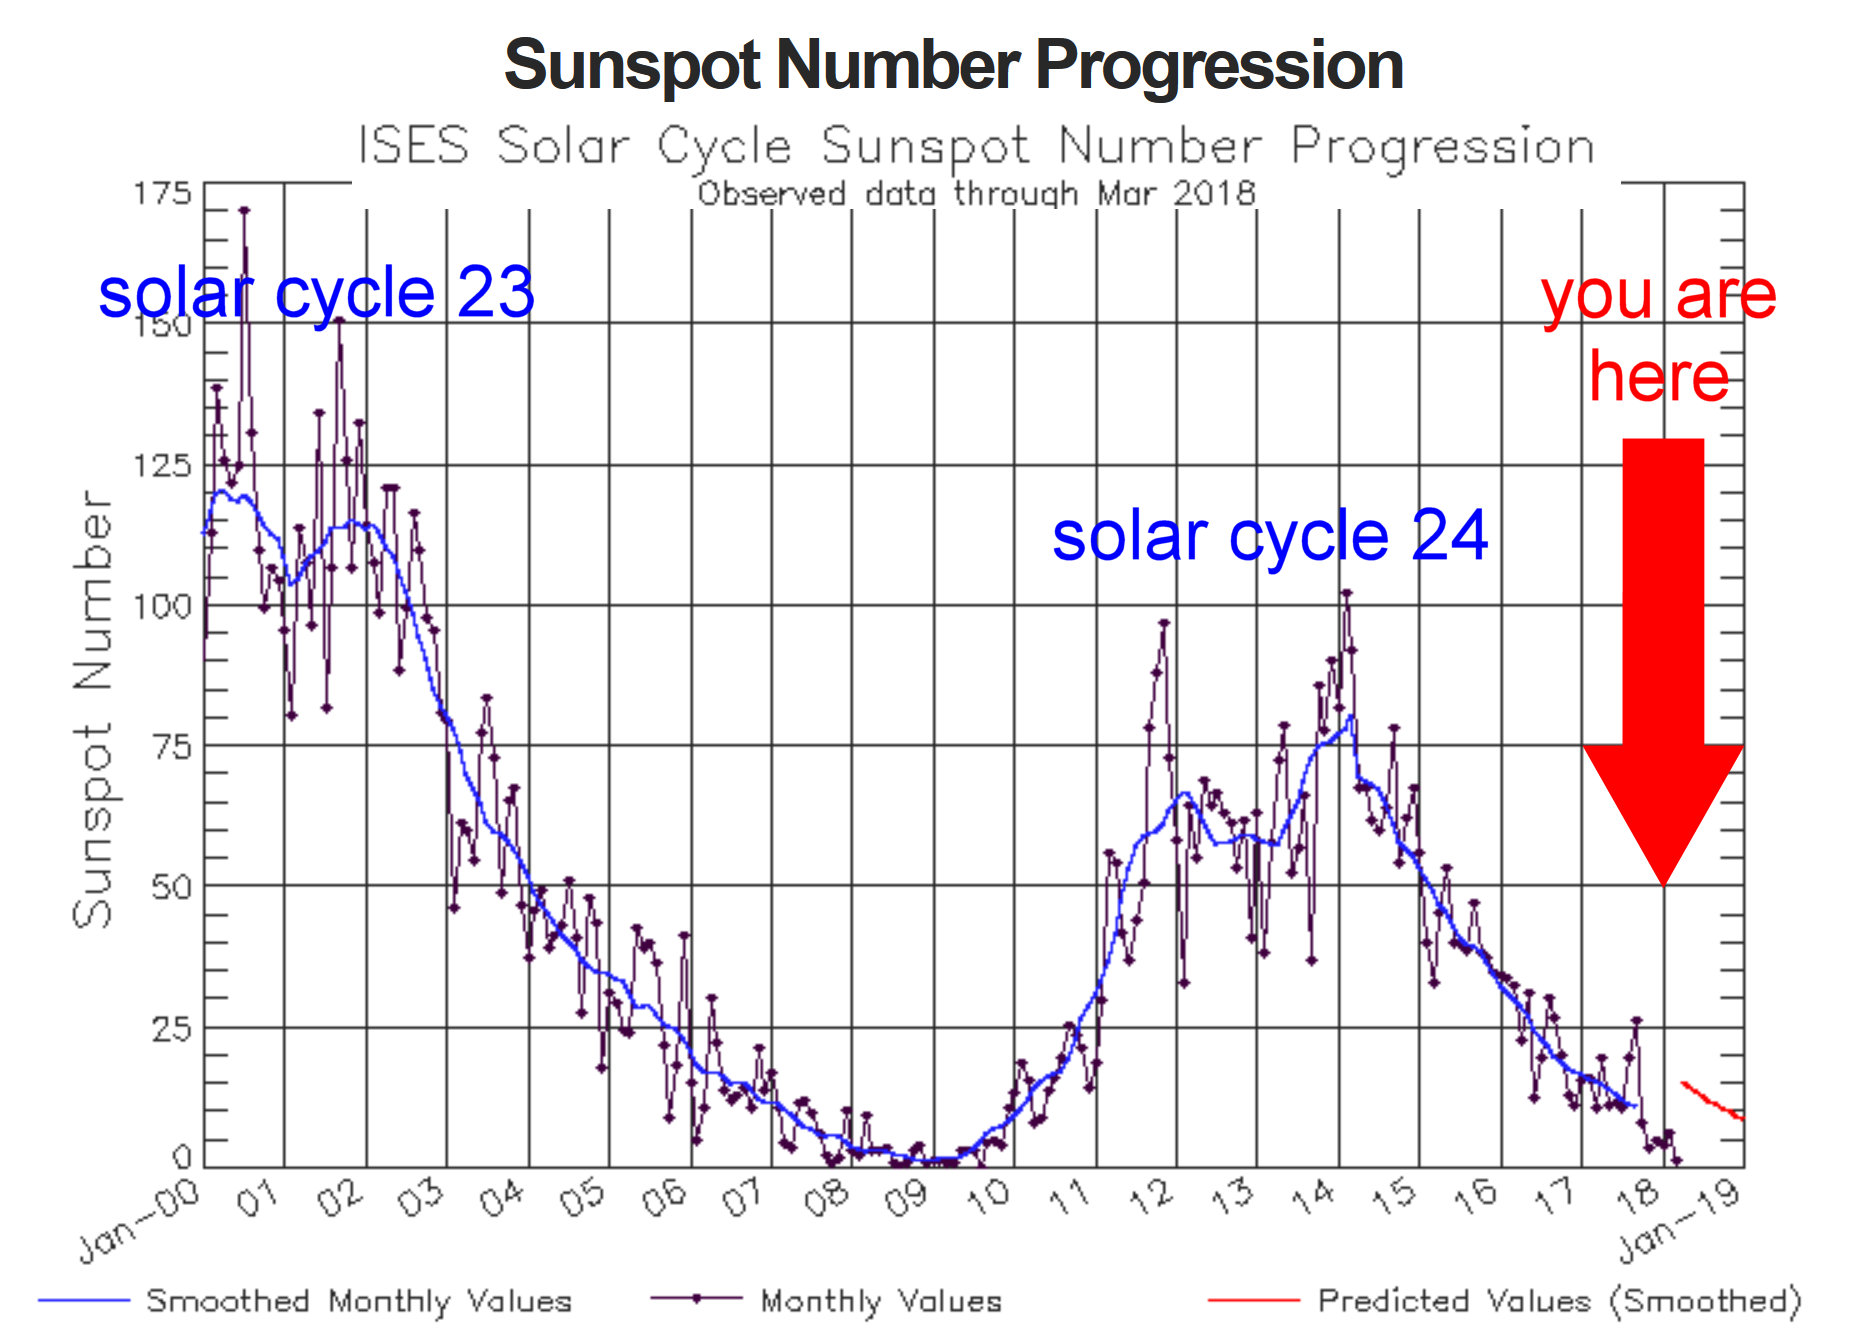
"Solar cycle 24 is declining more quickly than forecast," stated NOAA's Space Weather Prediction Center on April 26th. This plot shows observed sunspot numbers in blue vs. the official forecast in red:
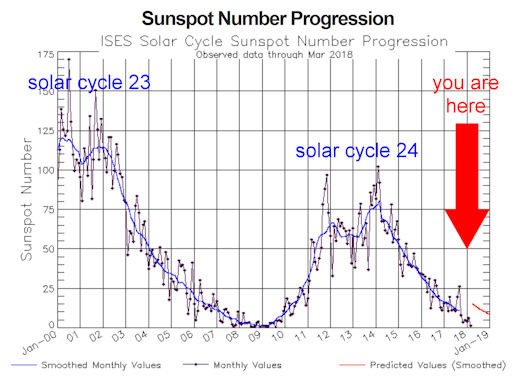
"The smoothed, predicted sunspot number for April-May 2018 is about 15," says NOAA. "However, the actual monthly values have been lower."
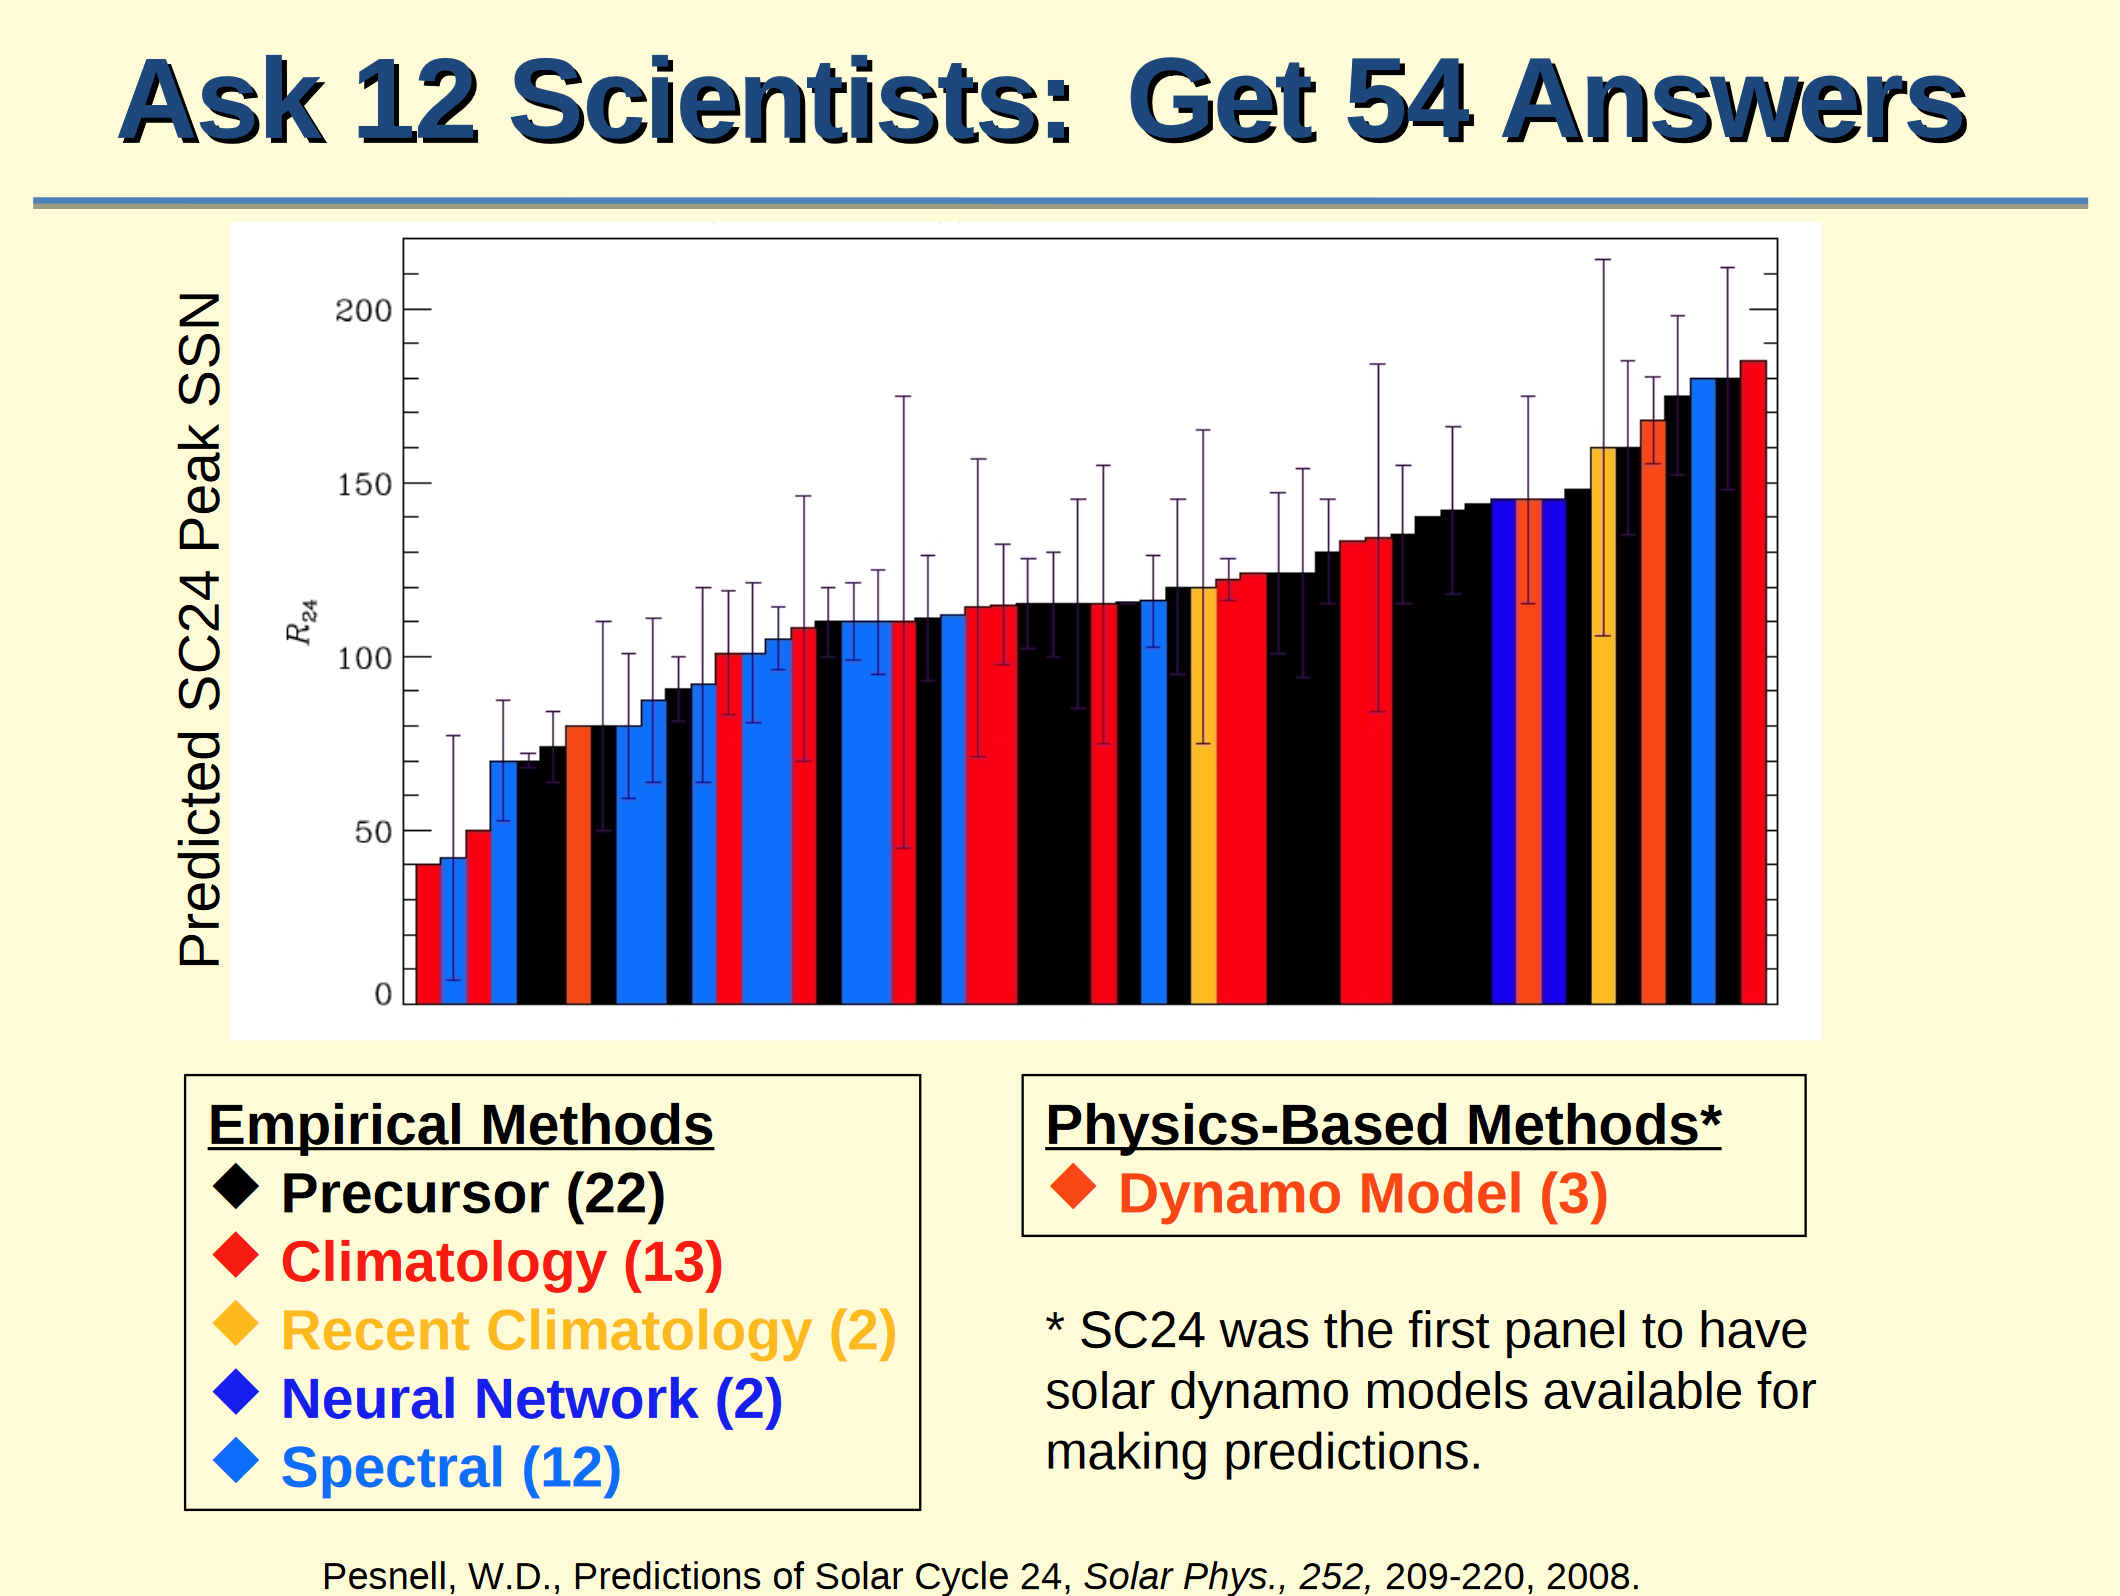
"Official" forecasts of the solar cycle come from NOAA's Solar Cycle Prediction Panel–a group of experts from NOAA, NASA, the US Air Force, universities and other research organizations. They have been convening at intervals since 1989 to predict the timing and intensity of Solar Max. The problem is, no one really knows how to predict the solar cycle. The most recent iteration of the panel in 2006-2008 compared 54 different methods ranging from empirical extrapolations of historical data to cutting-edge supercomputer models of the sun's magnetic dynamo. None fully described what is happening now.
Scroll past the space pendant to continue reading this story....
FAR-OUT MOTHER'S DAY GIFT: Mother's Day is less than two weeks away. To get ready, the students of Earth to Sky Calculus launched an array of cosmic ray sensors to the stratosphere onboard a helium balloon. This sterling silver Mother's Day gift went along for the ride:
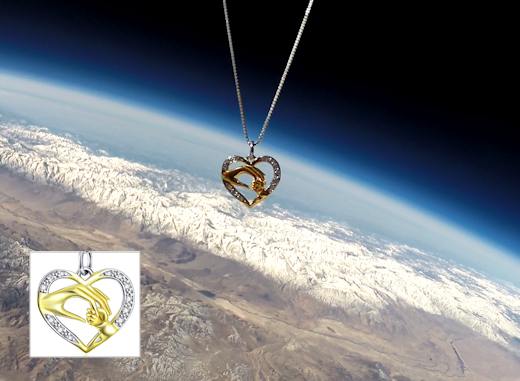
You can have it for $129.95. The students are selling these pendants as a fund-raiser for their cosmic ray monitoring program. All proceeds support atmospheric radiation measurements and hands-on STEM education.
Each pendant comes with a greeting card showing the jewelry in flight and telling the story of its journey to the stratosphere and back again. Mom-satisfaction guaranteed.
Far Out Gifts: Earth to Sky Store
All proceeds support hands-on STEM education
SUNSPOTS VANISHING FASTER THAN EXPECTED: continued...
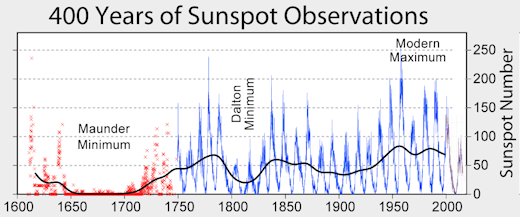
It's important to note that solar minimum is a normal part of the sunspot cycle. Sunspots have been disappearing (or nearly so) every ~11 years since 1843 when German astronomer Samuel Heinrich Schwabe discovered the periodic nature of solar activity. Sometimes they go away for decades, as happened during the Maunder Minimum of the 17th century. We've seen it all before. Or have we….?
Researchers are keeping a wary eye on the sun now because of what happened the last time sunspots disappeared. The solar minimum of 2008-2009 was unusually deep. The sun set Space Age records for low sunspot number, weak solar wind, and depressed solar irradiance. When the sun finally woke up a few years later, it seemed to have "solar minimum hangover." The bounce-back Solar Max of 2012-2015 was the weakest solar maximum of the Space Age, prompting some to wonder if solar activity is entering a phase of sustained quiet. The faster-than-expected decline of the sunspot cycle now may support that idea.
Newcomers to the field are often surprised to learn that a lot happens during solar minimum: The sun dims, albeit slightly. NASA recently launched a new sensor (TSIS-1) to the International Space Station to monitor this effect. With less extreme UV radiation coming from the sun, Earth's upper atmosphere cools and shrinks. This allows space junk to accumulate in low Earth orbit.
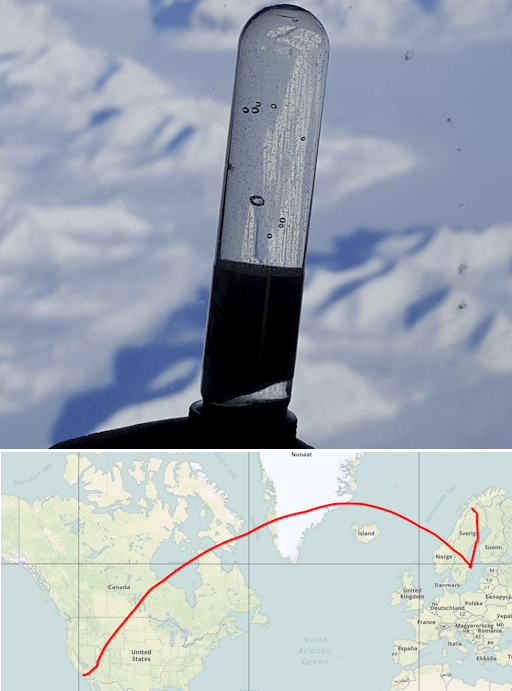 Above: A neutron bubble chamber in an airplane 35,000 feet above Greenland. Spaceweather.com and Earth to Sky Calculus are flying these sensors to measure aviation radiation during solar minimum. [more]
The most important change, however, could be the increase in cosmic rays. Flagging solar wind pressure during solar minimum allows cosmic rays from deep space to penetrate the inner solar system. Right now, space weather balloons and NASA spacecraft are measuring an uptick in radiation due to this effect. Cosmic rays may alter the chemistry of Earth's upper atmosphere, trigger lightning, and seed clouds.
Air travelers are affected, too. It is well known that cosmic rays penetrate airplanes. Passengers on long commercial flights receive doses similar to dental X-rays during a single trip, while pilots have been classified as occupational radiation workers by the International Commission on Radiological Protection (ICRP). Ongoing measurements by Spaceweather.com and Earth to Sky Calculus show that dose rates at cruising altitudes of 35,000 feet are currently ~40 times greater than on the ground below, values which could increase as the solar cycle wanes.
Solar minimum is just getting started. Stay tuned for updates.
Realtime Space Weather Photo Gallery
Realtime Aurora Photo Gallery
Every night, a network of
NASA all-sky cameras scans the skies above the United States for meteoritic fireballs. Automated software maintained by NASA's Meteoroid Environment Office calculates their orbits, velocity, penetration depth in Earth's atmosphere and many other characteristics. Daily results are presented here on Spaceweather.com.
On May. 2, 2018, the network reported 9 fireballs.
(8 sporadics, 1 eta Aquariid)
In this diagram of the inner solar system, all of the fireball orbits intersect at a single point--Earth. The orbits are color-coded by velocity, from slow (red) to fast (blue). [Larger image] [movies]
Potentially Hazardous Asteroids (
PHAs) are space rocks larger than approximately 100m that can come closer to Earth than 0.05 AU. None of the known PHAs is on a collision course with our planet, although astronomers are finding
new ones all the time.
On May 2, 2018 there were 1907 potentially hazardous asteroids.
 |
Recent & Upcoming Earth-asteroid encounters: | Asteroid | Date(UT) | Miss Distance | Velocity (km/s) | Diameter (m) |
| 2018 GH5 | 2018-Apr-27 | 12.2 LD | 12.7 | 32 |
| 2018 GB2 | 2018-Apr-27 | 17.1 LD | 14.6 | 92 |
| 2013 US3 | 2018-Apr-29 | 10.1 LD | 7.7 | 214 |
| 2018 GO4 | 2018-Apr-29 | 11.8 LD | 8.6 | 40 |
| 2018 GY1 | 2018-Apr-29 | 13.2 LD | 16.7 | 139 |
| 2018 FV4 | 2018-Apr-29 | 17.7 LD | 6.5 | 59 |
| 2002 JR100 | 2018-Apr-29 | 10.8 LD | 7.7 | 49 |
| 2018 HF2 | 2018-Apr-30 | 18.6 LD | 6.8 | 20 |
| 2018 HM2 | 2018-Apr-30 | 8.8 LD | 6.5 | 65 |
| 2018 HB1 | 2018-May-02 | 10.1 LD | 9.2 | 38 |
| 2018 HR1 | 2018-May-04 | 17.4 LD | 16.4 | 50 |
| 1999 FN19 | 2018-May-07 | 9.7 LD | 5.7 | 118 |
| 2016 JQ5 | 2018-May-08 | 6.3 LD | 10.4 | 9 |
| 388945 | 2018-May-09 | 6.5 LD | 9 | 295 |
| 2018 GR2 | 2018-May-11 | 13.4 LD | 9.8 | 109 |
| 1999 LK1 | 2018-May-15 | 13.3 LD | 10 | 141 |
| 2018 GL1 | 2018-May-18 | 14.3 LD | 5.2 | 66 |
| 68347 | 2018-May-29 | 9.5 LD | 13.3 | 389 |
| 2013 LE7 | 2018-May-31 | 17.8 LD | 1.7 | 12 |
| 2018 EJ4 | 2018-Jun-10 | 5.6 LD | 6.2 | 195 |
| 2015 DP155 | 2018-Jun-11 | 9 LD | 4.4 | 170 |
| 2017 YE5 | 2018-Jun-21 | 15.6 LD | 15.5 | 513 |
| 467309 | 2018-Jun-23 | 17.9 LD | 14 | 355 |
| 441987 | 2018-Jun-24 | 7.3 LD | 12.6 | 178 |
Notes: LD means "Lunar Distance." 1 LD = 384,401 km, the distance between Earth and the Moon. 1 LD also equals 0.00256 AU. MAG is the visual magnitude of the asteroid on the date of closest approach. | | Cosmic Rays in the Atmosphere |
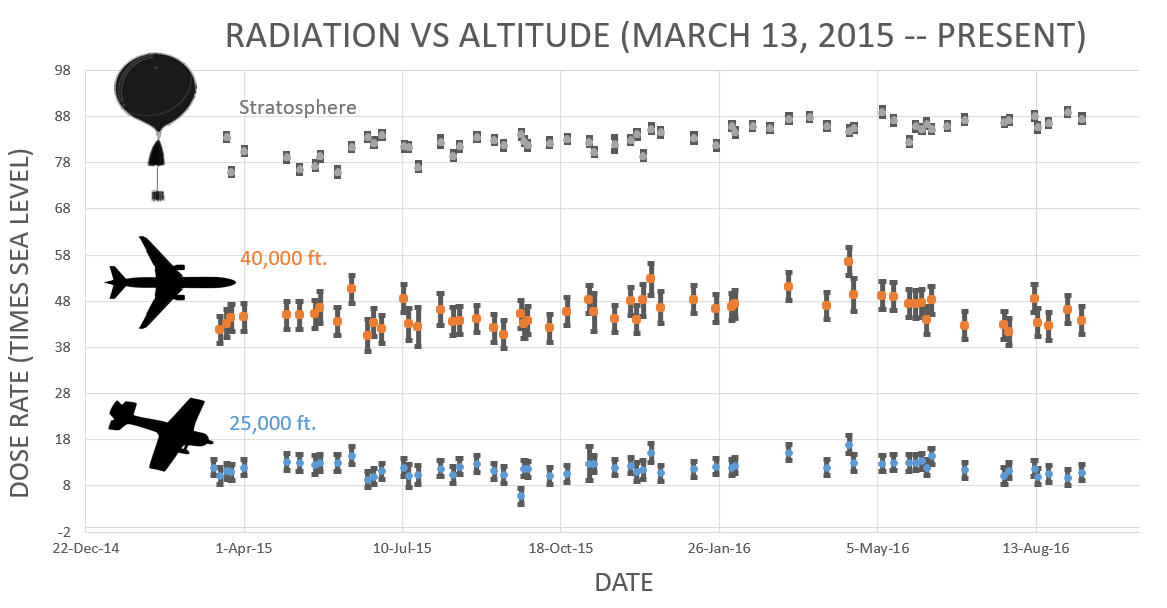
Readers, thank you for your patience while we continue to develop this new section of Spaceweather.com. We've been working to streamline our data reduction, allowing us to post results from balloon flights much more rapidly, and we have developed a new data product, shown here:

This plot displays radiation measurements not only in the stratosphere, but also at aviation altitudes. Dose rates are expessed as multiples of sea level. For instance, we see that boarding a plane that flies at 25,000 feet exposes passengers to dose rates ~10x higher than sea level. At 40,000 feet, the multiplier is closer to 50x. These measurements are made by our usual cosmic ray payload as it passes through aviation altitudes en route to the stratosphere over California.
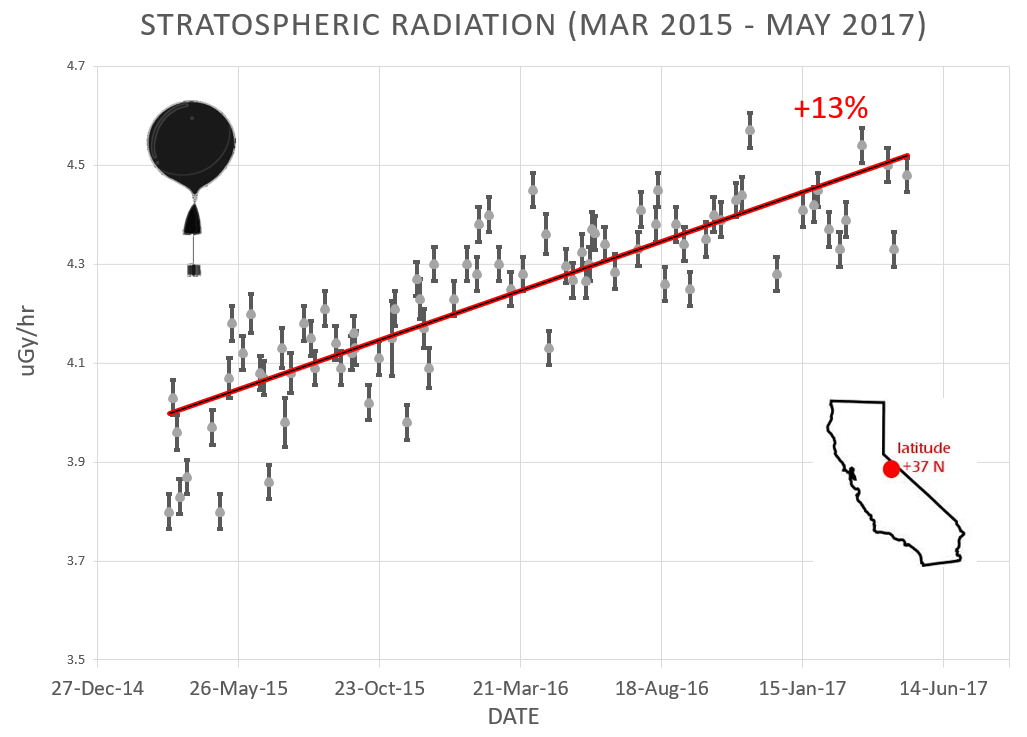
What is this all about? Approximately once a week, Spaceweather.com and the students of Earth to Sky Calculus fly space weather balloons to the stratosphere over California. These balloons are equipped with radiation sensors that detect cosmic rays, a surprisingly "down to Earth" form of space weather. Cosmic rays can seed clouds, trigger lightning, and penetrate commercial airplanes. Furthermore, there are studies ( #1, #2, #3, #4) linking cosmic rays with cardiac arrhythmias and sudden cardiac death in the general population. Our latest measurements show that cosmic rays are intensifying, with an increase of more than 13% since 2015:
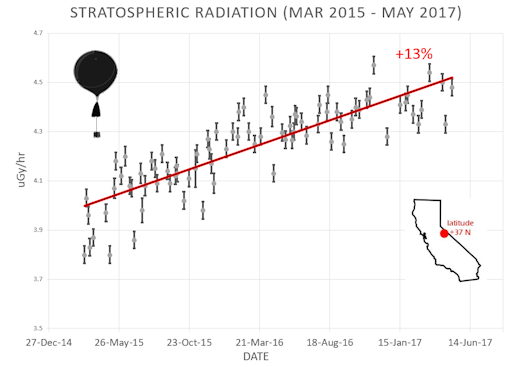
Why are cosmic rays intensifying? The main reason is the sun. Solar storm clouds such as coronal mass ejections (CMEs) sweep aside cosmic rays when they pass by Earth. During Solar Maximum, CMEs are abundant and cosmic rays are held at bay. Now, however, the solar cycle is swinging toward Solar Minimum, allowing cosmic rays to return. Another reason could be the weakening of Earth's magnetic field, which helps protect us from deep-space radiation.
The radiation sensors onboard our helium balloons detect X-rays and gamma-rays in the energy range 10 keV to 20 MeV. These energies span the range of medical X-ray machines and airport security scanners.
The data points in the graph above correspond to the peak of the Reneger-Pfotzer maximum, which lies about 67,000 feet above central California. When cosmic rays crash into Earth's atmosphere, they produce a spray of secondary particles that is most intense at the entrance to the stratosphere. Physicists Eric Reneger and Georg Pfotzer discovered the maximum using balloons in the 1930s and it is what we are measuring today.
| | The official U.S. government space weather bureau |
| | The first place to look for information about sundogs, pillars, rainbows and related phenomena. |
| | Researchers call it a "Hubble for the sun." SDO is the most advanced solar observatory ever. |
| | 3D views of the sun from NASA's Solar and Terrestrial Relations Observatory |
| | Realtime and archival images of the Sun from SOHO. |
| | from the NOAA Space Environment Center |
| | fun to read, but should be taken with a grain of salt! Forecasts looking ahead more than a few days are often wrong. |
| | from the NOAA Space Environment Center |
| | the underlying science of space weather |
 | Reviews here can help you to pick up best memory foam mattresses. |
| | These links help Spaceweather.com stay online. Thank you to our supporters! |
| | | | | | |


