 | | | Switch to: Europe, USA, New Zealand, Antarctica Credit: NOAA/Ovation  Planetary K-index Planetary K-index
Now: Kp= 3 quiet
24-hr max: Kp= 4 unsettled
explanation | more data
Interplanetary Mag. Field
Btotal: 10.8 nT
Bz: -8.4 nT south
more data: ACE, DSCOVR
Updated: Today at 2350 UT Coronal Holes: 04 Dec 17 
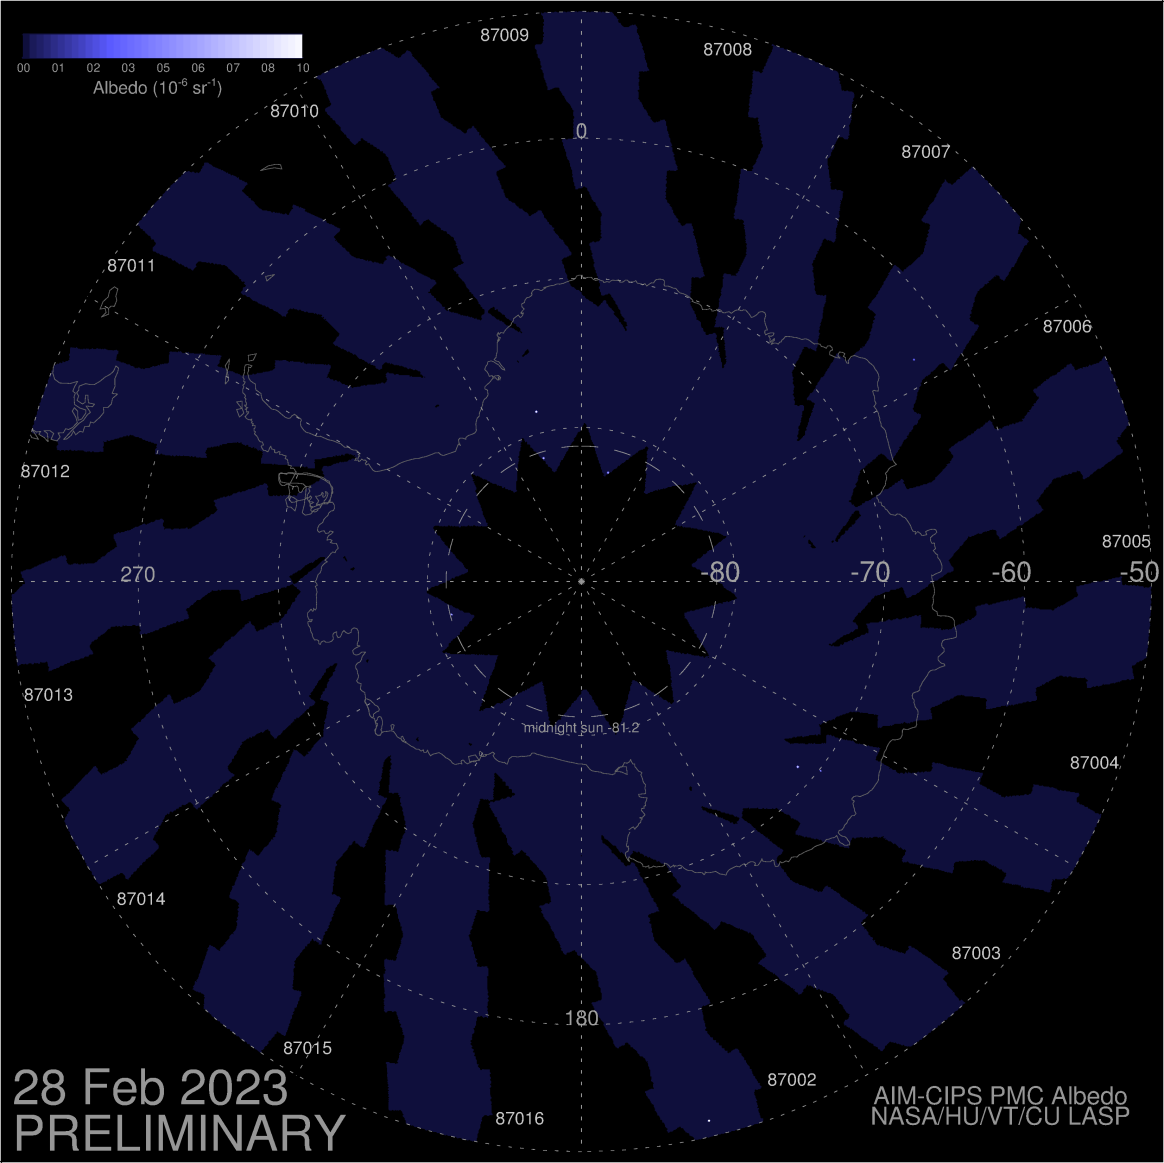
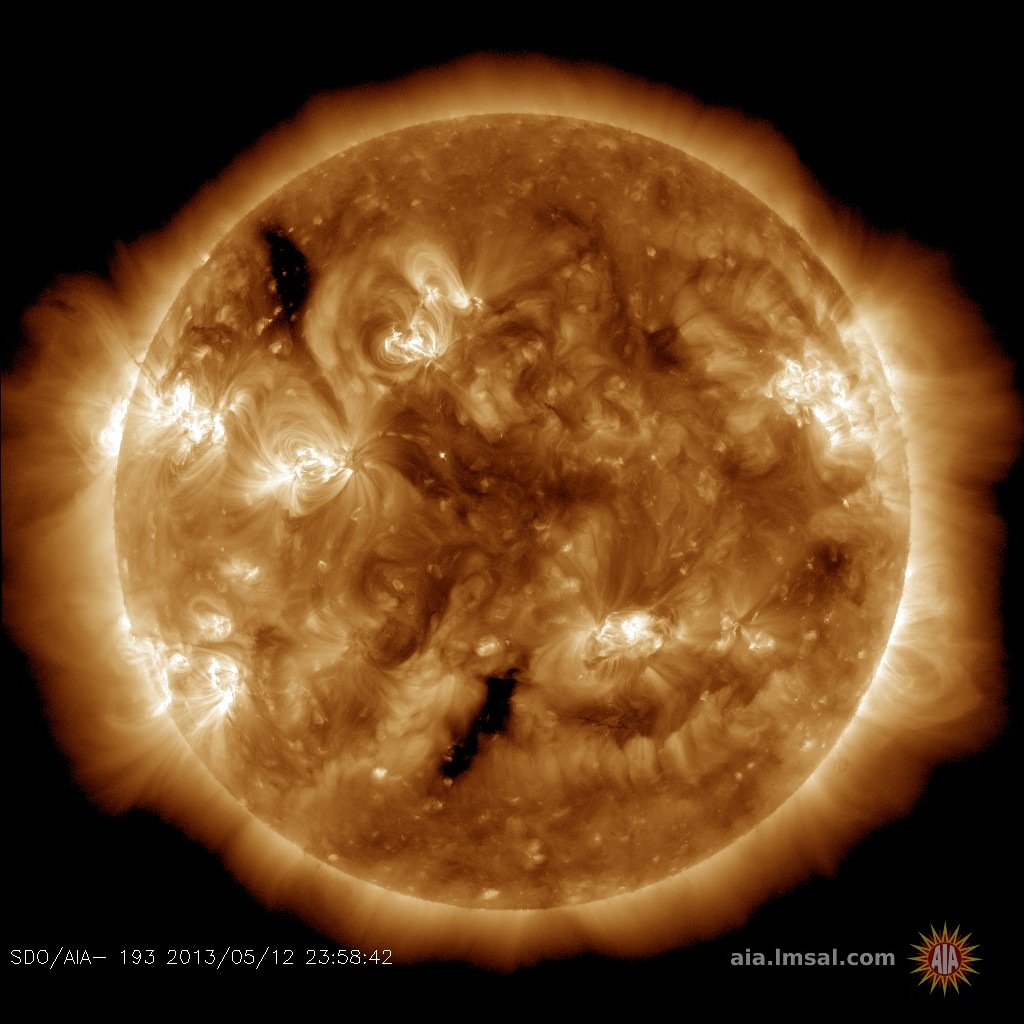
Solar wind flowing from the indicated coronal hole could reach Earth on Dec. 4th and 5th. Credit: SDO/AIA  Noctilucent Clouds Latest images from NASA's AIM spacecraft show that the 2017 northern summer season for noctilucent clouds has finished. Switch view: Europe, USA, Asia, Polar Updated at: 09-03-2017 01:55:03 Noctilucent Clouds Latest images from NASA's AIM spacecraft show that the 2017 northern summer season for noctilucent clouds has finished. Switch view: Europe, USA, Asia, Polar Updated at: 09-03-2017 01:55:03 SPACE WEATHER
NOAA Forecasts | | Updated at: 2017 Dec 04 2200 UTC FLARE | 0-24 hr | 24-48 hr | CLASS M | 01 % | 01 % | CLASS X | 01 % | 01 % | Geomagnetic Storms:
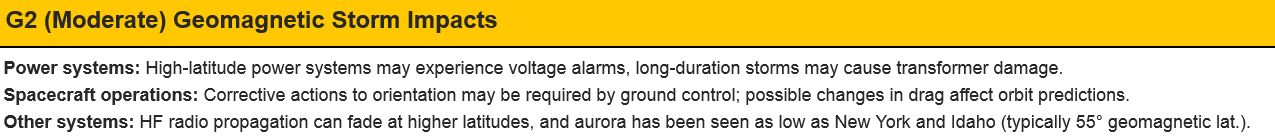
Probabilities for significant disturbances in Earth's magnetic field are given for three activity levels: active, minor storm, severe storm Updated at: 2017 Dec 04 2200 UTC Mid-latitudes | 0-24 hr | 24-48 hr | ACTIVE | 35 % | 35 % | MINOR | 35 % | 20 % | SEVERE | 15 % | 05 % | High latitudes | 0-24 hr | 24-48 hr | ACTIVE | 05 % | 10 % | MINOR | 20 % | 25 % | SEVERE | 70 % | 55 % | | | |  | | | | | | | | | | | All-inclusive Northern Lights trips in Tromsø, Norway. Small groups, big experiences! Highly qualified guides ensure unique and unforgettable adventures with a personal touch. Visit Explore the Arctic | | | GEOMAGNETIC STORM PREDICTED (G2-CLASS): A high-speed stream of solar wind is approaching Earth, and NOAA forecasters say there is a 75% chance of polar geomagnetic storms when it arrives on Dec. 4th and 5th. Periods of moderately-strong G2-class storming could send Northern Lights spilling across the Canadian border into upper-tier US states; interfere with shortwave radio propagation at high latitudes; and confuse wildlife that use magnetic cues for navigation. Free: Aurora Alerts. SPACE STATION AND SUPERMOON: Last night's full Moon was a "supermoon", almost 8% wider and 16% brighter than an average full Moon. Thomas K. T. Fok was watching the oversized orb rise above Hong Kong when a black silhouette flitted across the great gray disk. It was the International Space Station: 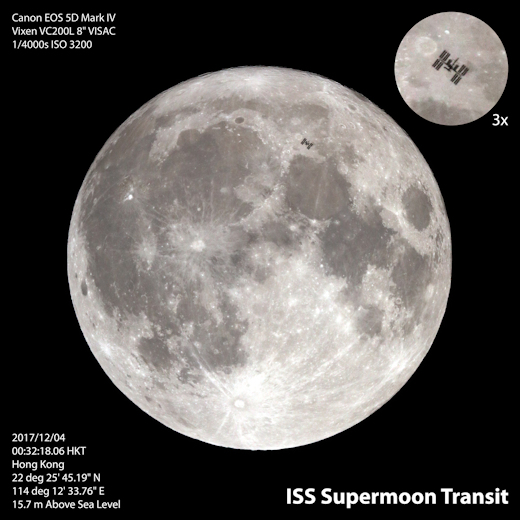
"The ISS crossed the Moon in a split second [as predicted by Calsky]," says Fok. "I captured the transit using an 8-inch telescope and a Canon EOS 5D digital camera at the Ho Koon Nature Education cum Astronomical Centre."
The moon's extra diameter made an ISS transit slightly more likely than usual. Full moons vary in size because the Moon's orbit is not a circle, it's an ellipse: diagram. One side of the Moon's orbit, called "perigee," is 50,000 km closer to Earth than the other side, "apogee." Last night's Moon became full only 16 hours away from perigee, closer than any other full Moon of 2017.
More amazing moonshots may be found in the real time photo gallery: Realtime Space Weather Photo Gallery STRANGE ARCTIC RAINBOW: Rainbows usually require liquid water. Droplets falling out of the sky intercept beams of sunlight, reflecting them back in a colorful spray of red, green, and blue. Yesterday, Valtteri Immonen saw such a rainbow over Muonio, Finland, but something was missing: the raindrops. "It was -6 degrees C, no rain and no snowfall," he says. "Yet there was a huge rainbow across the sky." 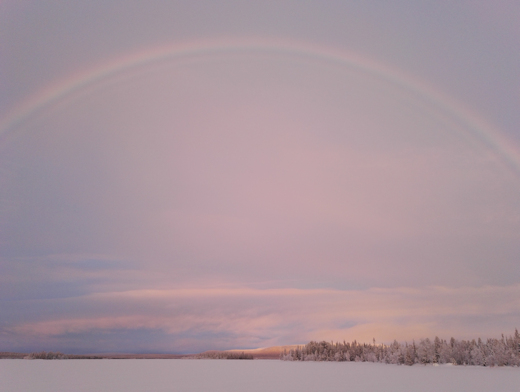
"I have never seen a rainbow during the winter and I didn't even know that it is possible for them to form when the temperature is below 0 degrees Celsius," he marvels.
Atmospheric optics expert Les Cowley says that raindrops must have been present: "The rainbow's appearance, narrow with a supernumerary, says that it was produced with reasonable size water drops, perhaps about 0.5 mm in diameter. I surmise that the there was high level precipitation that did not necessarily reach the ground. The drops could also have been supercooled below the normal freezing point of water," he speculates.
Supercooled raindrops can form when droplets of liquid water fall through layers of subfreezing air. Droplets containing specks of dust or even microbes readily freeze as ice crystals form around the impurities. But when rain droplets are especially pure, they can remain in a liquid state even when the temperature drops below freezing.
Last winter, supercooled rainbows were sighted in the Arctic as strange weather gripped the poles. Immonen's photo suggests that more of these rare rainbows may be in the offing. Stay tuned.
CHRISTMAS ORNAMENTS FROM SPACE: On Nov. 2, 2017, the students of Earth to Sky Calculus launched a space weather balloon to the stratosphere. These kids do science, and the payload of their balloon carried an array of cosmic ray sensors to measure radiation coming from deep space. A basket of Christmas ornaments went along for the ride. Watch the video to see what happened: The ornaments were created by student artist Dana Wilcher, a longtime member of Earth to Sky Calculus. Each year she creates a limited batch of "space ornaments" to raise money for our balloon program. You can have one for $59.95. Each ornament comes with a unique gift card showing the work of art floating at the top of Earth's atmosphere. The interior of the card tells the story of the flight and confirms that the ornament has been to the edge of space and back again. It *also* comes with a hanging mini-photo of the ornament in the stratosphere. Hang it on your tree alonside the actual ornament to impress holiday visitors! Far Out Gifts: Earth to Sky Store
All proceeds support hands-on STEM education
Realtime Aurora Photo Gallery Every night, a network of NASA all-sky cameras scans the skies above the United States for meteoritic fireballs. Automated software maintained by NASA's Meteoroid Environment Office calculates their orbits, velocity, penetration depth in Earth's atmosphere and many other characteristics. Daily results are presented here on Spaceweather.com. On Dec. 4, 2017, the network reported 19 fireballs.
(10 sporadics, 8 sigma Hydrids, 1 November omega Orionid)  In this diagram of the inner solar system, all of the fireball orbits intersect at a single point--Earth. The orbits are color-coded by velocity, from slow (red) to fast (blue). [Larger image] [movies] Potentially Hazardous Asteroids ( PHAs) are space rocks larger than approximately 100m that can come closer to Earth than 0.05 AU. None of the known PHAs is on a collision course with our planet, although astronomers are finding new ones all the time. On December 4, 2017 there were 1869 potentially hazardous asteroids.
 | Recent & Upcoming Earth-asteroid encounters: | Asteroid | Date(UT) | Miss Distance | Velocity (km/s) | Diameter (m) | | 2017 WK1 | 2017-Nov-28 | 7.8 LD | 8 | 14 | | 2017 WD28 | 2017-Nov-28 | 4.5 LD | 13.3 | 26 | | 2017 WF16 | 2017-Nov-29 | 3.7 LD | 4.2 | 6 | | 2017 WN15 | 2017-Nov-29 | 7.4 LD | 19.4 | 38 | | 2017 WH28 | 2017-Nov-30 | 19.7 LD | 14.7 | 45 | | 2017 WH2 | 2017-Nov-30 | 6.4 LD | 16.8 | 48 | | 2008 WM61 | 2017-Dec-02 | 3.7 LD | 4.7 | 16 | | 2017 WH16 | 2017-Dec-03 | 17.4 LD | 15.2 | 26 | | 2017 WZ27 | 2017-Dec-03 | 13.6 LD | 4.2 | 11 | | 2017 WS13 | 2017-Dec-05 | 9.5 LD | 11.3 | 42 | | 2017 WF28 | 2017-Dec-06 | 17.6 LD | 7.6 | 21 | | 2017 WV12 | 2017-Dec-09 | 3.5 LD | 10.6 | 25 | | 2017 WE13 | 2017-Dec-12 | 16.4 LD | 5.4 | 26 | | 2017 VS14 | 2017-Dec-12 | 15.9 LD | 2.8 | 15 | | 2017 WJ28 | 2017-Dec-13 | 12.9 LD | 6.1 | 21 | | 2015 XX169 | 2017-Dec-14 | 9.7 LD | 6.3 | 11 | | 2006 XY | 2017-Dec-14 | 3.4 LD | 4.9 | 56 | | 2017 VT14 | 2017-Dec-17 | 3.8 LD | 10.4 | 105 | | 2011 YD29 | 2017-Dec-19 | 17.6 LD | 7.7 | 20 | | 2017 WX12 | 2017-Dec-21 | 10.1 LD | 11.4 | 126 | | 2017 TS3 | 2017-Dec-22 | 18.1 LD | 10.2 | 136 | | 418849 | 2017-Dec-22 | 15.3 LD | 17.4 | 257 | | 2015 YQ1 | 2017-Dec-22 | 17.3 LD | 11.1 | 9 | | 2017 WZ14 | 2017-Dec-24 | 7.6 LD | 4.9 | 32 | | 2017 QL33 | 2017-Dec-30 | 13.3 LD | 8.2 | 191 | | 2015 RT1 | 2018-Jan-02 | 19.7 LD | 9 | 30 | | 2004 FH | 2018-Jan-10 | 20 LD | 8.5 | 26 | | 306383 | 2018-Jan-22 | 14.4 LD | 17.4 | 178 | Notes: LD means "Lunar Distance." 1 LD = 384,401 km, the distance between Earth and the Moon. 1 LD also equals 0.00256 AU. MAG is the visual magnitude of the asteroid on the date of closest approach. | | Cosmic Rays in the Atmosphere |
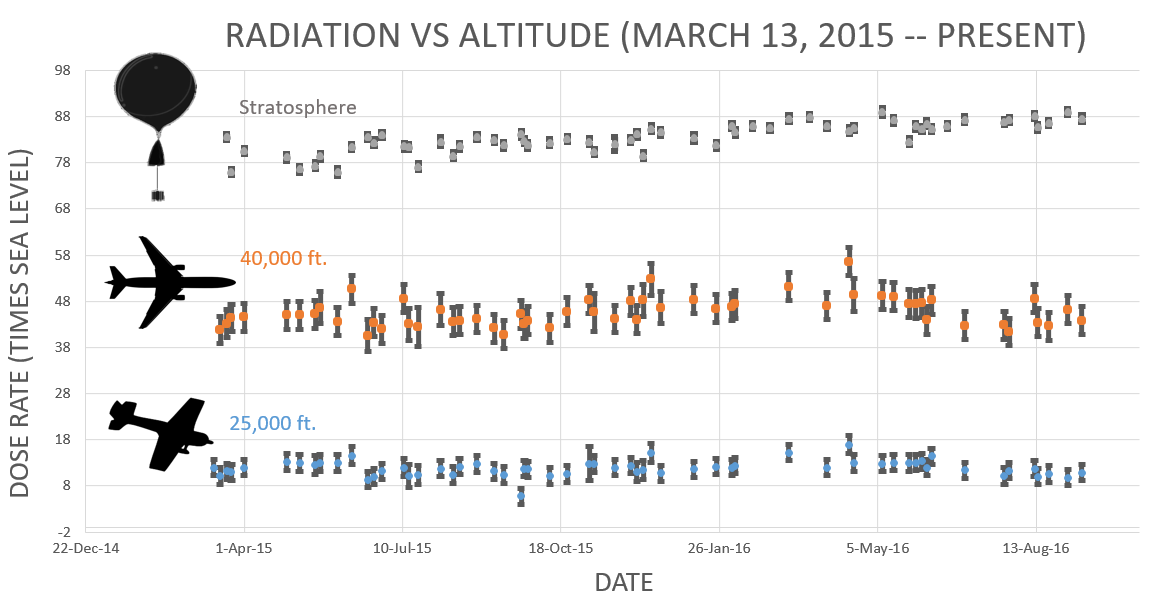
Readers, thank you for your patience while we continue to develop this new section of Spaceweather.com. We've been working to streamline our data reduction, allowing us to post results from balloon flights much more rapidly, and we have developed a new data product, shown here: 
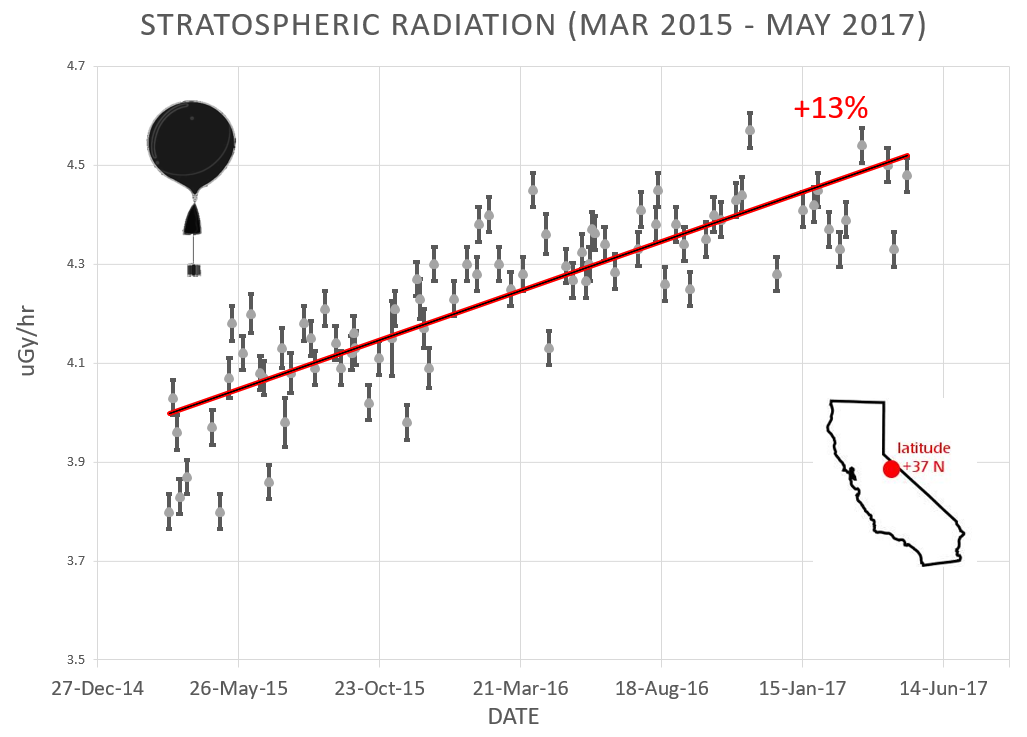
This plot displays radiation measurements not only in the stratosphere, but also at aviation altitudes. Dose rates are expessed as multiples of sea level. For instance, we see that boarding a plane that flies at 25,000 feet exposes passengers to dose rates ~10x higher than sea level. At 40,000 feet, the multiplier is closer to 50x. These measurements are made by our usual cosmic ray payload as it passes through aviation altitudes en route to the stratosphere over California. What is this all about? Approximately once a week, Spaceweather.com and the students of Earth to Sky Calculus fly space weather balloons to the stratosphere over California. These balloons are equipped with radiation sensors that detect cosmic rays, a surprisingly "down to Earth" form of space weather. Cosmic rays can seed clouds, trigger lightning, and penetrate commercial airplanes. Furthermore, there are studies ( #1, #2, #3, #4) linking cosmic rays with cardiac arrhythmias and sudden cardiac death in the general population. Our latest measurements show that cosmic rays are intensifying, with an increase of more than 13% since 2015: 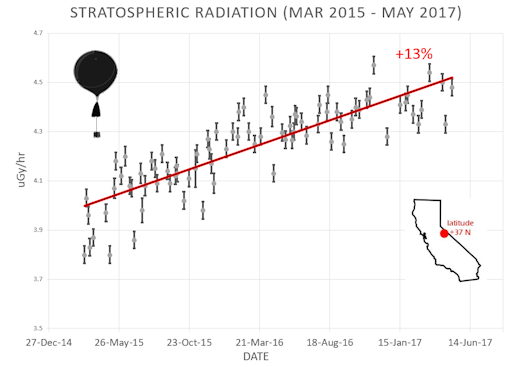
Why are cosmic rays intensifying? The main reason is the sun. Solar storm clouds such as coronal mass ejections (CMEs) sweep aside cosmic rays when they pass by Earth. During Solar Maximum, CMEs are abundant and cosmic rays are held at bay. Now, however, the solar cycle is swinging toward Solar Minimum, allowing cosmic rays to return. Another reason could be the weakening of Earth's magnetic field, which helps protect us from deep-space radiation. The radiation sensors onboard our helium balloons detect X-rays and gamma-rays in the energy range 10 keV to 20 MeV. These energies span the range of medical X-ray machines and airport security scanners. The data points in the graph above correspond to the peak of the Reneger-Pfotzer maximum, which lies about 67,000 feet above central California. When cosmic rays crash into Earth's atmosphere, they produce a spray of secondary particles that is most intense at the entrance to the stratosphere. Physicists Eric Reneger and Georg Pfotzer discovered the maximum using balloons in the 1930s and it is what we are measuring today. | | The official U.S. government space weather bureau | | | The first place to look for information about sundogs, pillars, rainbows and related phenomena. | | | Researchers call it a "Hubble for the sun." SDO is the most advanced solar observatory ever. | | | 3D views of the sun from NASA's Solar and Terrestrial Relations Observatory | | | Realtime and archival images of the Sun from SOHO. | | | from the NOAA Space Environment Center | | | fun to read, but should be taken with a grain of salt! Forecasts looking ahead more than a few days are often wrong. | | | from the NOAA Space Environment Center | | | the underlying science of space weather |  | Reviews here can help you to pick up best memory foam mattresses. | | | These links help Spaceweather.com stay online. Thank you to our supporters! | | | | | | | | |  | | |  | ©2017 Spaceweather.com. All rights reserved. This site is penned daily by Dr. Tony Phillips. | |


