 | | | Switch to: Europe, USA, New Zealand, Antarctica Credit: NOAA/Ovation  Planetary K-index Planetary K-index
Now: Kp= 4 unsettled
24-hr max: Kp= 5 storm
explanation | more data
Interplanetary Mag. Field
Btotal: 4.0 nT
Bz: -2.3 nT south
more data: ACE, DSCOVR
Updated: Today at 2350 UT Coronal Holes: 05 Aug 19 
Earth is entering a stream of solar wind flowing from the indicated coronal hole.. Credit: SDO/AIA
 Noctilucent Clouds The northern season for noctilucent clouds is underway. Monitor the daily images from NASA's AIM spacecraft to see how the clouds spread around the Arctic Circle as northern summer unfolds. Switch view: Europe, USA, Asia, Polar Updated at: 07-18-2019 14:55:02 Noctilucent Clouds The northern season for noctilucent clouds is underway. Monitor the daily images from NASA's AIM spacecraft to see how the clouds spread around the Arctic Circle as northern summer unfolds. Switch view: Europe, USA, Asia, Polar Updated at: 07-18-2019 14:55:02 SPACE WEATHER
NOAA Forecasts | | Updated at: 2019 Aug 05 2200 UTC FLARE | 0-24 hr | 24-48 hr | CLASS M | 01 % | 01 % | CLASS X | 01 % | 01 % | Geomagnetic Storms:
Probabilities for significant disturbances in Earth's magnetic field are given for three activity levels: active, minor storm, severe storm Updated at: 2019 Aug 05 2200 UTC Mid-latitudes | 0-24 hr | 24-48 hr | ACTIVE | 40 % | 30 % | MINOR | 25 % | 10 % | SEVERE | 05 % | 01 % | High latitudes | 0-24 hr | 24-48 hr | ACTIVE | 05 % | 15 % | MINOR | 20 % | 30 % | SEVERE | 65 % | 40 % | | | |  | | | | | | | | | | | Solar minimum is here - but even now strangely beautiful auroras are dancing around the poles. Deep inside the Arctic Circle, the expert guides of Aurora Holidays in Utsjoki, Finland, can help you chase them. Book now! | | | MIDSUMMER AURORAS IN THE USA: This morning a fast-moving stream of solar wind hit Earth's magnetic field. First contact produced a G1-class geomagnetic storm and auroras in northern-tier US states visible even through city lights. Philip Granrud sends this report from Montana: "Northern Lights were dancing almost overhead in the city limits of Kalispell just a few hours ago." 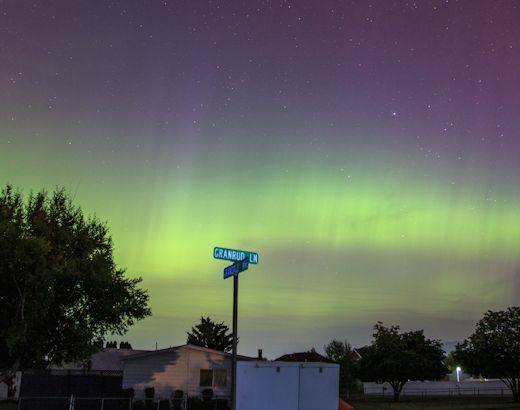
" It is rare for us in Montana to have such a beautiful show inside the city limits with all the light pollution, and in this case, wildfire smoke too," he adds. "If you look closely, the street sign in the foreground, Granrud Lane, was named after my family and it just happened to be my Dad's Birthday today. Perfect timing!" Currently, the solar wind is blowing faster than 600 km/s. If these speeds continue, more geomagnetic storms and high latitude auroras are possible tonight. Get a text alert when auroras appear in your area! Aurora alerts: SMS Text Realtime Aurora Photo Gallery
Free: Spaceweather.com Newsletter RAIKOKE SUNSETS: Over the weekend in DeSoto, Kansas, something strange happened to the sunset: It turned purple. "On Saturday night, I photographed a large dome of pinkish-purple light," reports Doug Zubenel. "Strong crepuscular rays were also visible." 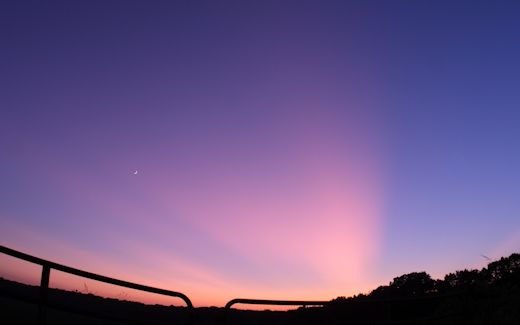
Photo credit: Doug Zubenel of DeSoto, Kansas. August 3, 2019.
Purple sunsets are a sign of volcanic activity. Fine volcanic aerosols in the stratosphere scatter blue light which, when mixed with ordinary sunset red, produces a violet hue.
But which volcano? The answer is probably Raikoke, a volcano in the Kuril islands which erupted with such force on June 22, 2019, that it was seen from the International Space Station. NASA satellites confirm that aerosols from Raikoke reached the stratosphere and they have been circulating around the Northern Hemisphere ever since.
A similar eruption occurred 11 years ago, in Aug. 2008, when Alaska's Kasatochi volcano spewed sulfurous gases into the stratosphere. For months sky watchers witnessed strange sunsets whenever a plume of Kasatochi's emissions drifted overhead. The same thing, apparently, is happening now thanks to Raikoke. 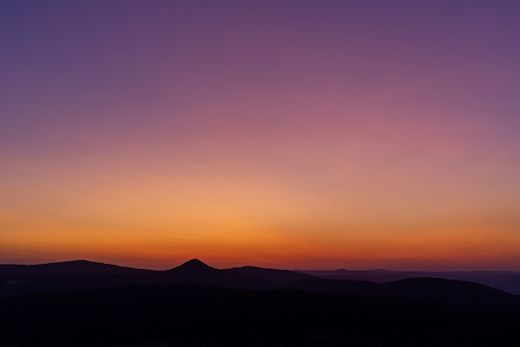
Photo credit: Heiko Ulbricht in the Zittau Mountains of southeastern Germany. July 26, 2019.
Volcanic sunsets have also been seen in Halifax, Nova Scotia; in the Zittau Mountains of Germany; in Joshua Tree, California; in Orange, California.
Purple isn't the only thing to look for, says atmospheric optics expert Les Cowley. In addition, he advises, sky watchers should "be alert for a very bright yellow twilight arch, fine cloud structure in the arch seen through binoculars, and long diffuse rays and shadows." Realtime Space Weather Photo Gallery
Free: Spaceweather.com Newsletter FLY ME TO THE MOONSTONE: Are you looking for a far-out gift? Nothing says "I love you" like a moonstone from the edge of space. On June 12th, the students of Earth to Sky Calculus flew this moonstone wrapped in a sterling silver Celtic love knot 34.1 km (111,877 feet) above Earth's surface: 
You can have it for $139.95. The students are selling these pendants to support their cosmic ray ballooning program. Each one comes with a greeting card showing the item in flight and telling the story of its journey to the edge of space. Sales support the Earth to Sky Calculus cosmic ray ballooning program and hands-on STEM research. Far Out Gifts: Earth to Sky Store
All sales support hands-on STEM education
Realtime Aurora Photo Gallery
Free: Spaceweather.com Newsletter
Every night, a network of NASA all-sky cameras scans the skies above the United States for meteoritic fireballs. Automated software maintained by NASA's Meteoroid Environment Office calculates their orbits, velocity, penetration depth in Earth's atmosphere and many other characteristics. Daily results are presented here on Spaceweather.com. On Aug. 5, 2019, the network reported 29 fireballs.
(14 sporadics, 12 Perseids, 3 Southern delta Aquariids)  In this diagram of the inner solar system, all of the fireball orbits intersect at a single point--Earth. The orbits are color-coded by velocity, from slow (red) to fast (blue). [Larger image] [movies] Potentially Hazardous Asteroids ( PHAs) are space rocks larger than approximately 100m that can come closer to Earth than 0.05 AU. None of the known PHAs is on a collision course with our planet, although astronomers are finding new ones all the time. On August 5, 2019 there were 1983 potentially hazardous asteroids.
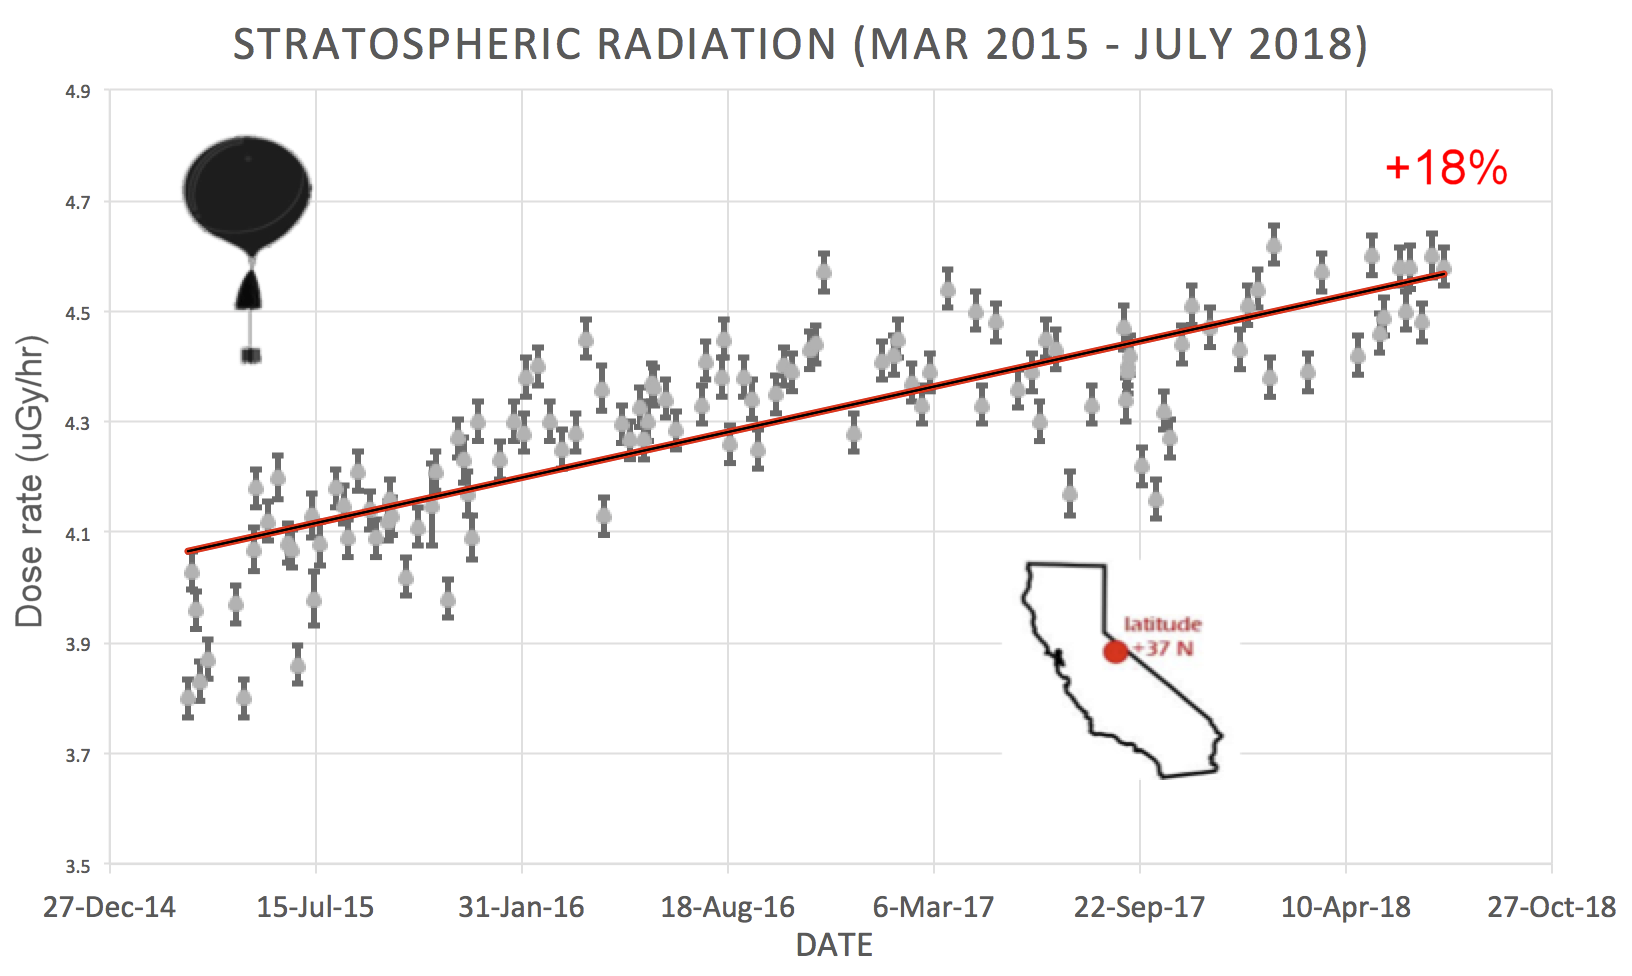
 | Recent & Upcoming Earth-asteroid encounters: | Asteroid | Date(UT) | Miss Distance | Velocity (km/s) | Diameter (m) | | 2019 ON | 2019-Aug-01 | 6.8 LD | 4.7 | 33 | | 2019 OJ3 | 2019-Aug-02 | 11.4 LD | 16.2 | 61 | | 2006 QQ23 | 2019-Aug-10 | 19.4 LD | 4.7 | 339 | | 454094 | 2019-Aug-12 | 17 LD | 8.2 | 148 | | 2018 PN22 | 2019-Aug-17 | 17.1 LD | 2.3 | 11 | | 2016 PD1 | 2019-Aug-26 | 11.4 LD | 5.9 | 65 | | 2002 JR100 | 2019-Aug-27 | 19.4 LD | 8.4 | 49 | | 2019 OU1 | 2019-Aug-28 | 2.7 LD | 13.2 | 97 | | 2019 OF2 | 2019-Sep-03 | 18.3 LD | 10.7 | 53 | | 2018 DE1 | 2019-Sep-03 | 12.7 LD | 6.6 | 28 | | 2019 GT3 | 2019-Sep-06 | 19.5 LD | 13.6 | 227 | | 2010 RM82 | 2019-Sep-13 | 18.2 LD | 14.6 | 23 | | 2013 CV83 | 2019-Sep-13 | 15.7 LD | 13.1 | 62 | | 504800 | 2019-Sep-14 | 13.9 LD | 14.4 | 155 | | 467317 | 2019-Sep-14 | 13.9 LD | 6.4 | 389 | | 2019 JF1 | 2019-Sep-16 | 11.2 LD | 4.3 | 61 | | 2018 FU1 | 2019-Sep-16 | 18.4 LD | 4.7 | 16 | | 2017 SL16 | 2019-Sep-21 | 7.9 LD | 6.5 | 25 | | 2017 SM21 | 2019-Sep-21 | 11.5 LD | 9.6 | 20 | | 2006 QV89 | 2019-Sep-23 | 15.9 LD | 4.2 | 31 | | 523934 | 2019-Sep-24 | 10.9 LD | 22.3 | 257 | | 2017 KP27 | 2019-Sep-26 | 6.2 LD | 4.8 | 25 | | 2018 FK5 | 2019-Oct-01 | 13.3 LD | 10.5 | 8 | | 2018 LG4 | 2019-Oct-02 | 13.8 LD | 8.1 | 12 | Notes: LD means "Lunar Distance." 1 LD = 384,401 km, the distance between Earth and the Moon. 1 LD also equals 0.00256 AU. MAG is the visual magnitude of the asteroid on the date of closest approach. | | Cosmic Rays in the Atmosphere | SOMETHING NEW! We have developed a new predictive model of aviation radiation. It's called E-RAD--short for Empirical RADiation model. We are constantly flying radiation sensors onboard airplanes over the US and and around the world, so far collecting more than 22,000 gps-tagged radiation measurements. Using this unique dataset, we can predict the dosage on any flight over the USA with an error no worse than 15%. E-RAD lets us do something new: Every day we monitor approximately 1400 flights criss-crossing the 10 busiest routes in the continental USA. Typically, this includes more than 80,000 passengers per day. E-RAD calculates the radiation exposure for every single flight. The Hot Flights Table is a daily summary of these calculations. It shows the 5 charter flights with the highest dose rates; the 5 commercial flights with the highest dose rates; 5 commercial flights with near-average dose rates; and the 5 commercial flights with the lowest dose rates. Passengers typically experience dose rates that are 20 to 70 times higher than natural radiation at sea level. To measure radiation on airplanes, we use the same sensors we fly to the stratosphere onboard Earth to Sky Calculus cosmic ray balloons: neutron bubble chambers and X-ray/gamma-ray Geiger tubes sensitive to energies between 10 keV and 20 MeV. These energies span the range of medical X-ray machines and airport security scanners. Column definitions: (1) The flight number; (2) The maximum dose rate during the flight, expressed in units of natural radiation at sea level; (3) The maximum altitude of the plane in feet above sea level; (4) Departure city; (5) Arrival city; (6) Duration of the flight. SPACE WEATHER BALLOON DATA: Approximately once a week, Spaceweather.com and the students of Earth to Sky Calculus fly space weather balloons to the stratosphere over California. These balloons are equipped with radiation sensors that detect cosmic rays, a surprisingly "down to Earth" form of space weather. Cosmic rays can seed clouds, trigger lightning, and penetrate commercial airplanes. Furthermore, there are studies ( #1, #2, #3, #4) linking cosmic rays with cardiac arrhythmias and sudden cardiac death in the general population. Our latest measurements show that cosmic rays are intensifying, with an increase of more than 18% since 2015: 
The data points in the graph above correspond to the peak of the Reneger-Pfotzer maximum, which lies about 67,000 feet above central California. When cosmic rays crash into Earth's atmosphere, they produce a spray of secondary particles that is most intense at the entrance to the stratosphere. Physicists Eric Reneger and Georg Pfotzer discovered the maximum using balloons in the 1930s and it is what we are measuring today. En route to the stratosphere, our sensors also pass through aviation altitudes: 
In this plot, dose rates are expessed as multiples of sea level. For instance, we see that boarding a plane that flies at 25,000 feet exposes passengers to dose rates ~10x higher than sea level. At 40,000 feet, the multiplier is closer to 50x. The radiation sensors onboard our helium balloons detect X-rays and gamma-rays in the energy range 10 keV to 20 MeV. These energies span the range of medical X-ray machines and airport security scanners. Why are cosmic rays intensifying? The main reason is the sun. Solar storm clouds such as coronal mass ejections (CMEs) sweep aside cosmic rays when they pass by Earth. During Solar Maximum, CMEs are abundant and cosmic rays are held at bay. Now, however, the solar cycle is swinging toward Solar Minimum, allowing cosmic rays to return. Another reason could be the weakening of Earth's magnetic field, which helps protect us from deep-space radiation. | | The official U.S. government space weather bureau | | | The first place to look for information about sundogs, pillars, rainbows and related phenomena. | | | Researchers call it a "Hubble for the sun." SDO is the most advanced solar observatory ever. | | | 3D views of the sun from NASA's Solar and Terrestrial Relations Observatory | | | Realtime and archival images of the Sun from SOHO. | | | from the NOAA Space Environment Center | | | fun to read, but should be taken with a grain of salt! Forecasts looking ahead more than a few days are often wrong. | | | from the NOAA Space Environment Center | | | the underlying science of space weather |  | To find reviews of new online casino sites in the UK try The Casino DB where there are hundreds of online casino reviews complete with bonuses and ratings. Looking for a new online casino? Try Casimpo the new site dedicated to making online casino simple and easy for all. | | | These links help Spaceweather.com stay online. Thank you to our supporters! | | | | | | | | |  | | |  | ©2018 Spaceweather.com. All rights reserved. This site is penned daily by Dr. Tony Phillips. | |


