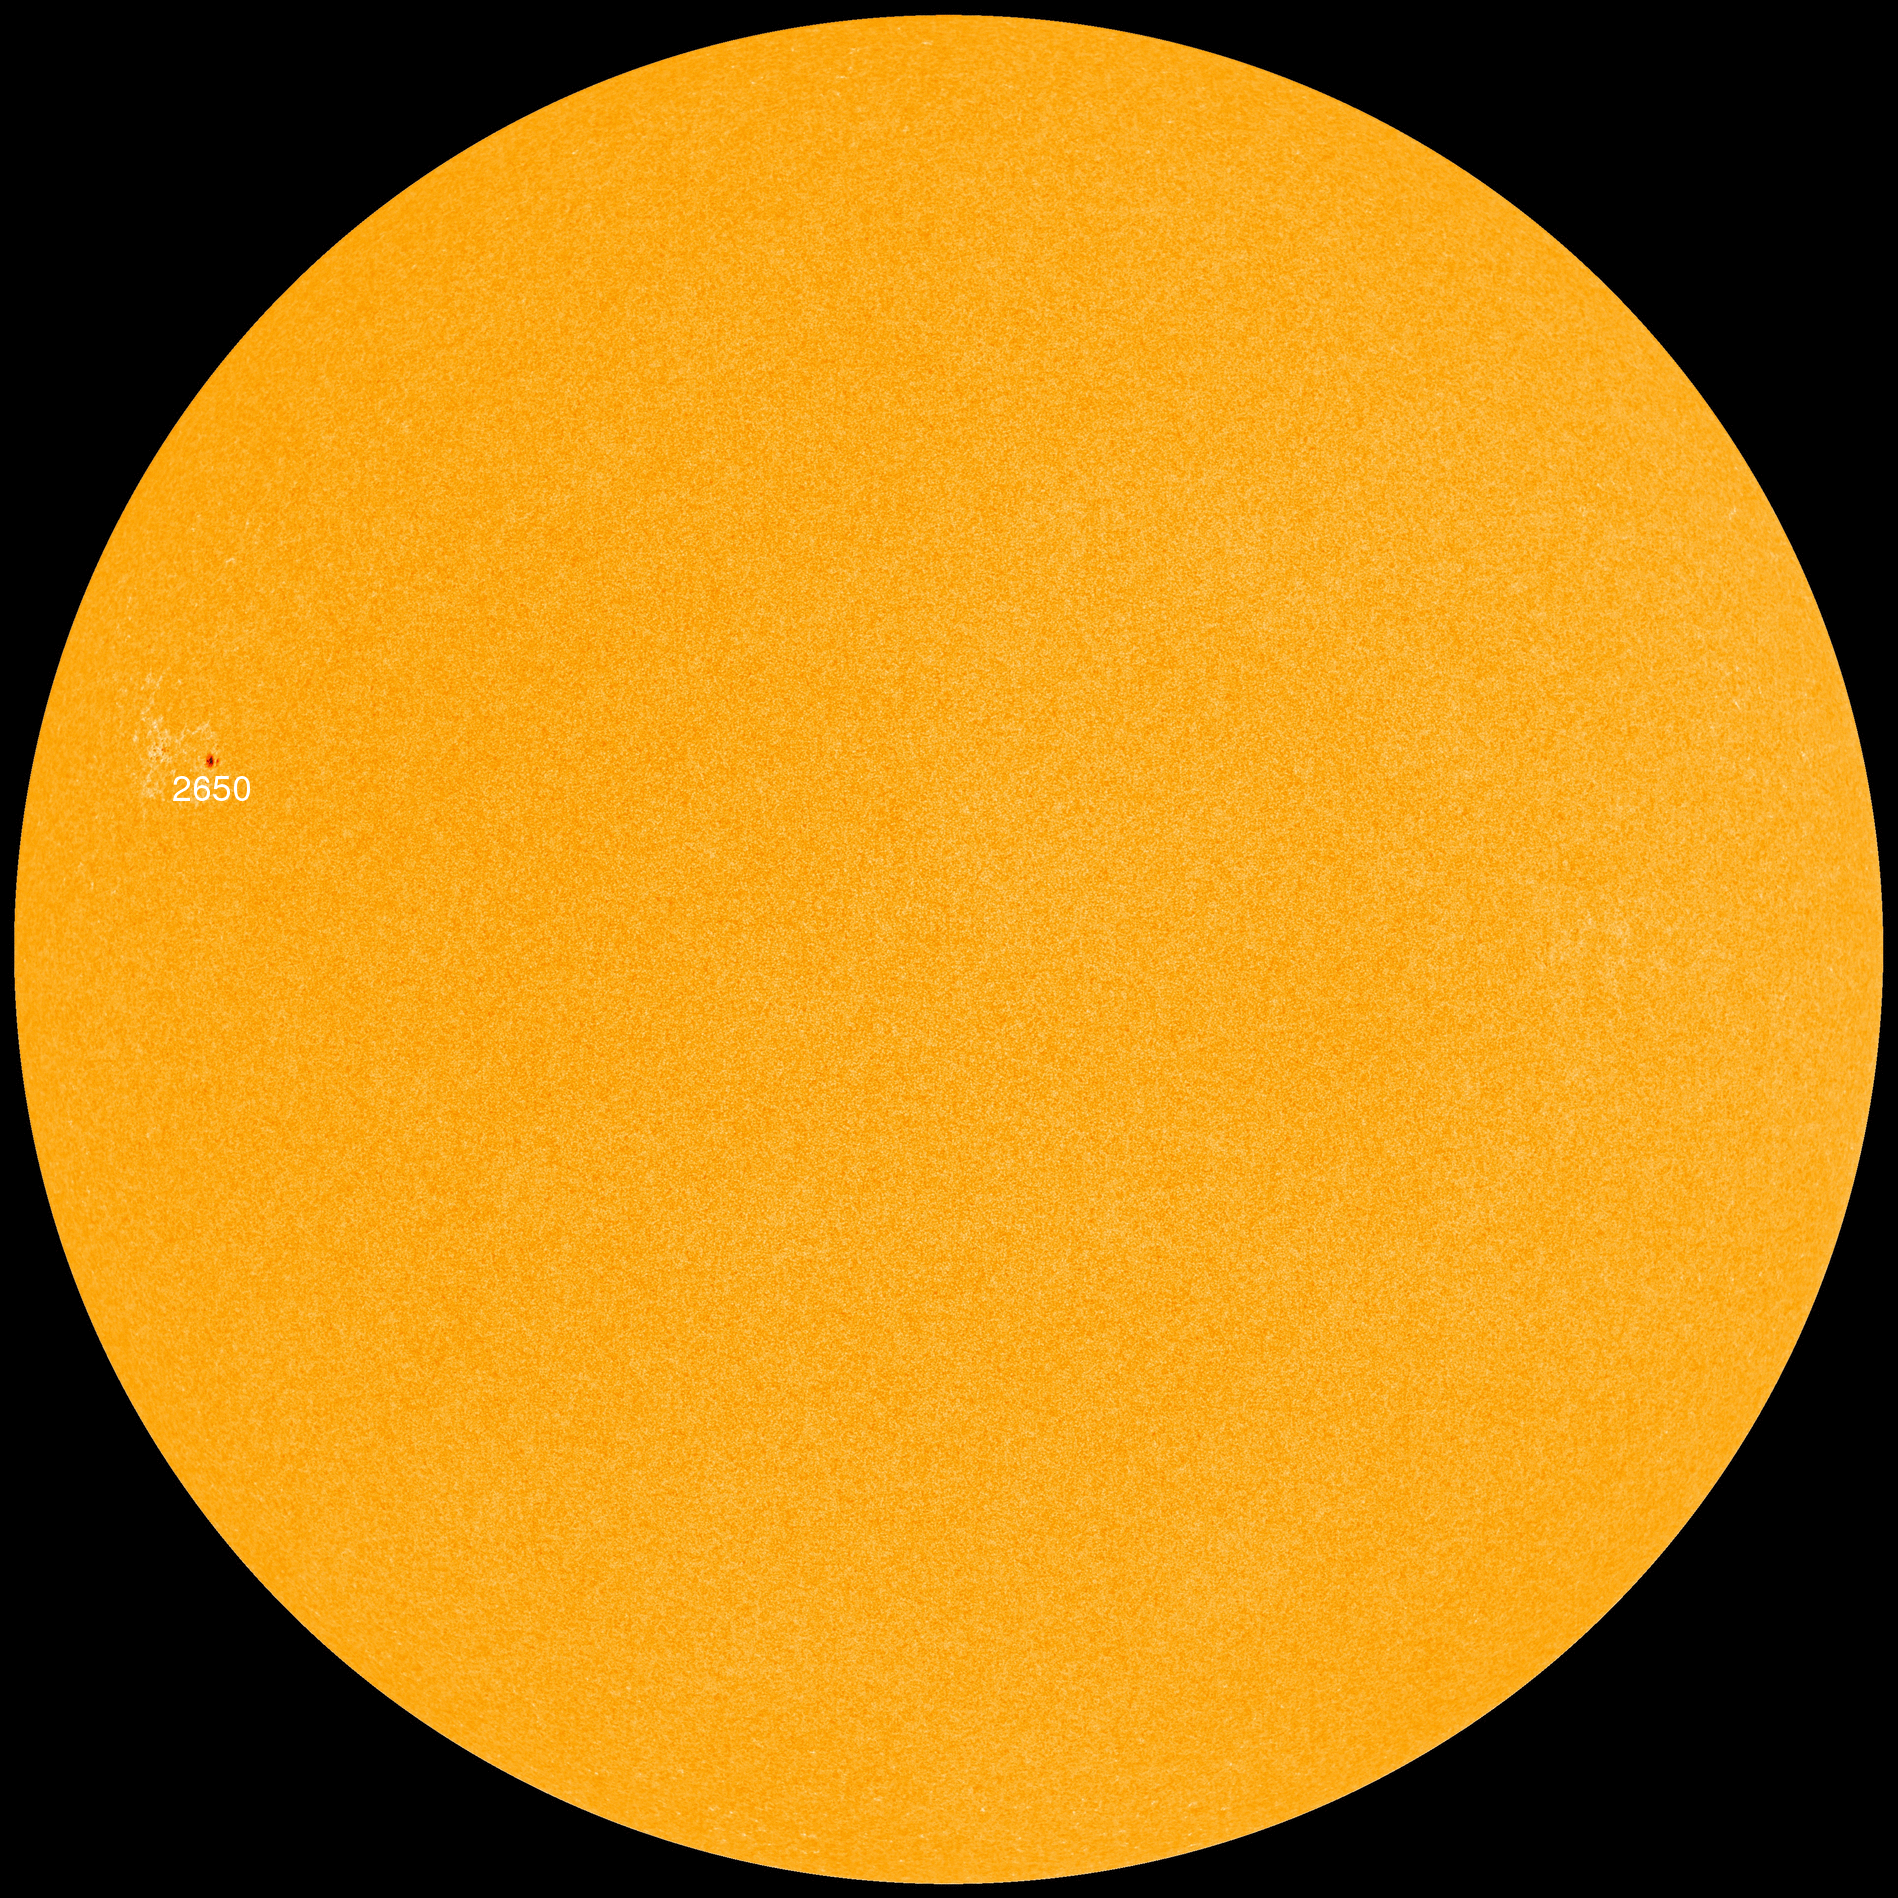
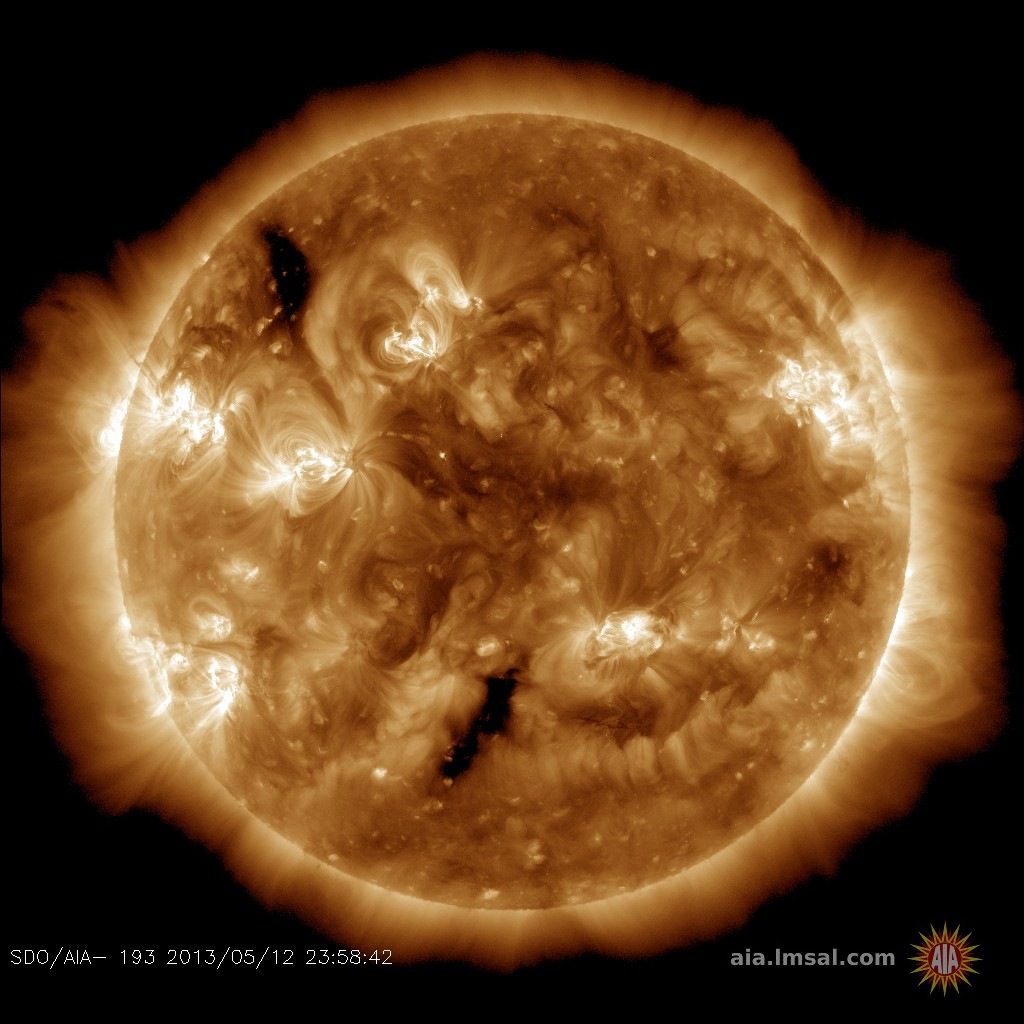
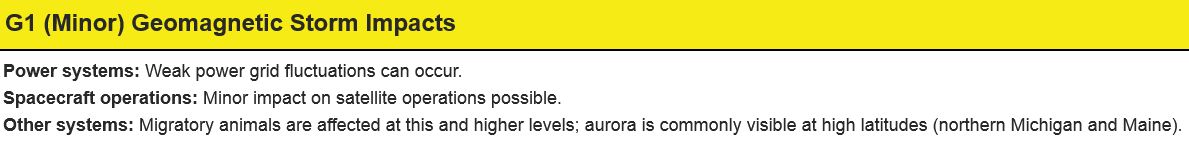
Directly under the Arctic Circle! Marianne's Arctic Xpress in Tromsø offers fjord, whale and wildlife tours by day, aurora tours by night. Email Marianne for bookings and availability. | | | LONG RANGE FORECAST: A hole in the sun's atmosphere that sprayed Earth with solar wind in late March is due to return next week. NOAA forecasters say there is a chance of G1-class geomagnetic storms on April 22nd intensifying to G2 storms on April 23rd in response to a repeat encounter with the solar wind stream. Free: Aurora Alerts. SOLAR FILAMENT EXPLODES, HURLS CME: On April 9th, a dark filament of magnetism on the sun rose up and hurled a portion of itself into space. NASA's Solar Dynamics Observatory recorded the eruption: 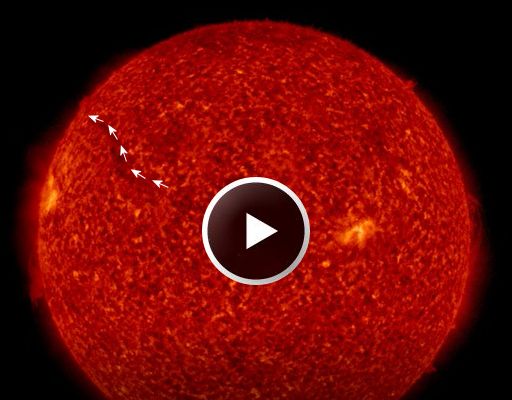
Flying debris from the filament formed the core of a coronal mass ejection (CME). A movie from the Solar and Heliospheric Observatory (SOHO) shows the cloud leaving the sun. At first it appeared that the CME would miss Earth, but a new analysis by NOAA forecasters suggests that a glancing glow is possible on April 15th. G1-class geomagnetic storms are possible when the CME arrives this weekend. Free: Aurora Alerts.
Realtime Aurora Photo Gallery INCREDIBLE COMET TAIL: More than 180 million km from Earth, something is happening to Comet PanSTARRS (C/2015 ER61). On April 4th and 5th, the comet brightened more than 6-fold, from magnitude +8.5 to +6.5, suddenly reaching the verge of naked-eye visibility despite its great distance from our planet. Now amateur astronomers are photographing an incredible tail. Gerald Rhemann sends this picture from his private observatory in Farm Tivoli, Namibia: 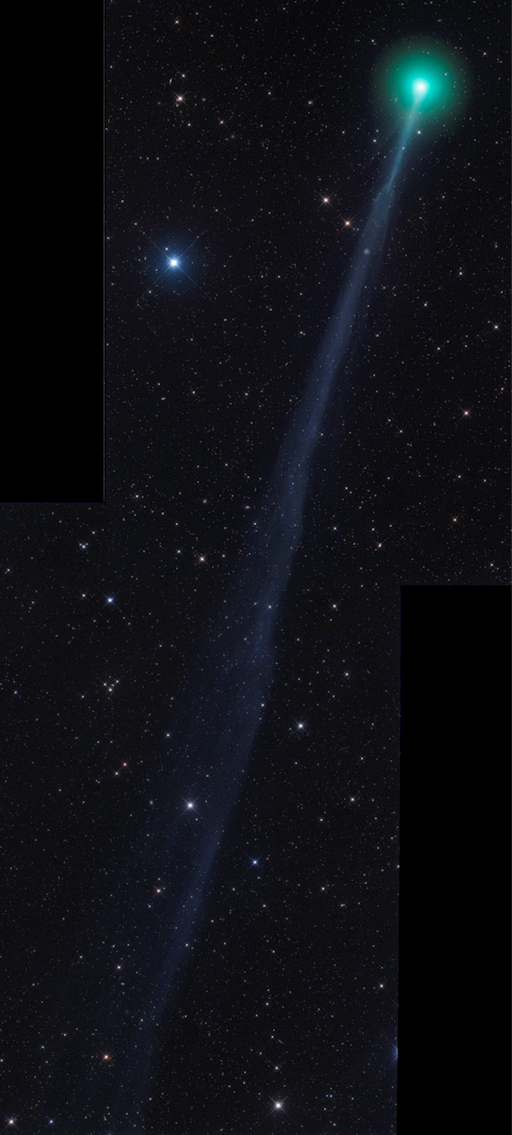
"The comet's tail is about 2.5 degrees long," says Rhemann. That means it spans more than 8 million km. For comparison, the entire sun is 1.4 million km wide; you could wrap the comet's tail around the sun's equator twice. Another way of putting it: The distance from Earth to the Moon is only 5% of the length of the gaseous lane behind Comet PanSTARRS. The comet's outburst is probably caused by a fresh vein of icy material in the comet's nucleus exposing itself to solar radiation. Furiously vaporizing, the comet's core is spewing jets of dust and gas into space--a tail-building process that should intensify as the comet approaches the sun between now and early May.
The comet's closest approach to Earth will be 176 million km (1.18 AU) on April 19th. Even at that distance, the comet might be a beautiful sight in backyard telescopes if current trends continue. Stay tuned! Realtime Comet Photo Gallery Realtime Space Weather Photo Gallery
Every night, a network of NASA all-sky cameras scans the skies above the United States for meteoritic fireballs. Automated software maintained by NASA's Meteoroid Environment Office calculates their orbits, velocity, penetration depth in Earth's atmosphere and many other characteristics. Daily results are presented here on Spaceweather.com. On Apr. 11, 2017, the network reported 2 fireballs.
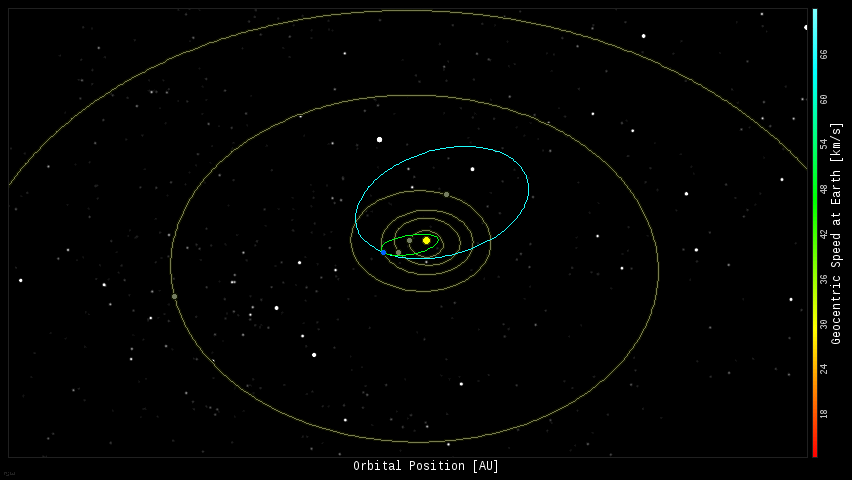
(2 sporadics) 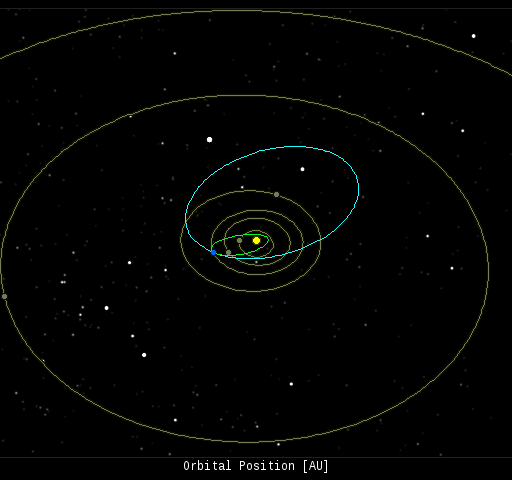 In this diagram of the inner solar system, all of the fireball orbits intersect at a single point--Earth. The orbits are color-coded by velocity, from slow (red) to fast (blue). [Larger image] [movies] Potentially Hazardous Asteroids ( PHAs) are space rocks larger than approximately 100m that can come closer to Earth than 0.05 AU. None of the known PHAs is on a collision course with our planet, although astronomers are finding new ones all the time. On April 11, 2017 there were potentially hazardous asteroids. Recent & Upcoming Earth-asteroid encounters: The asteroid table is undergoing development. Please check back shortly. Notes: LD means "Lunar Distance." 1 LD = 384,401 km, the distance between Earth and the Moon. 1 LD also equals 0.00256 AU. MAG is the visual magnitude of the asteroid on the date of closest approach. | | Cosmic Rays in the Atmosphere |
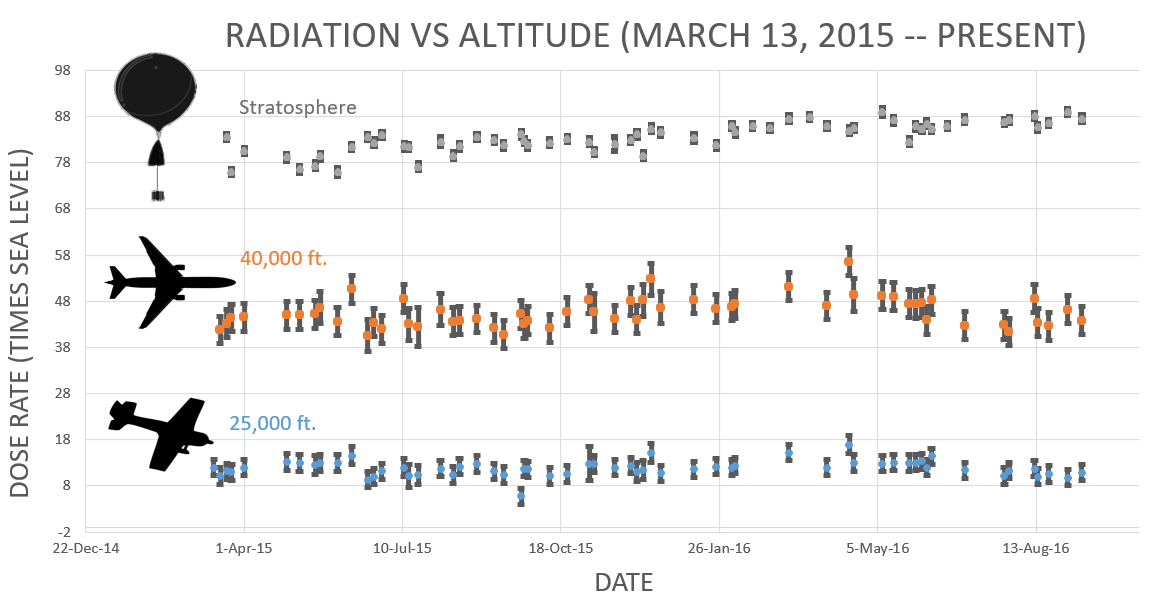
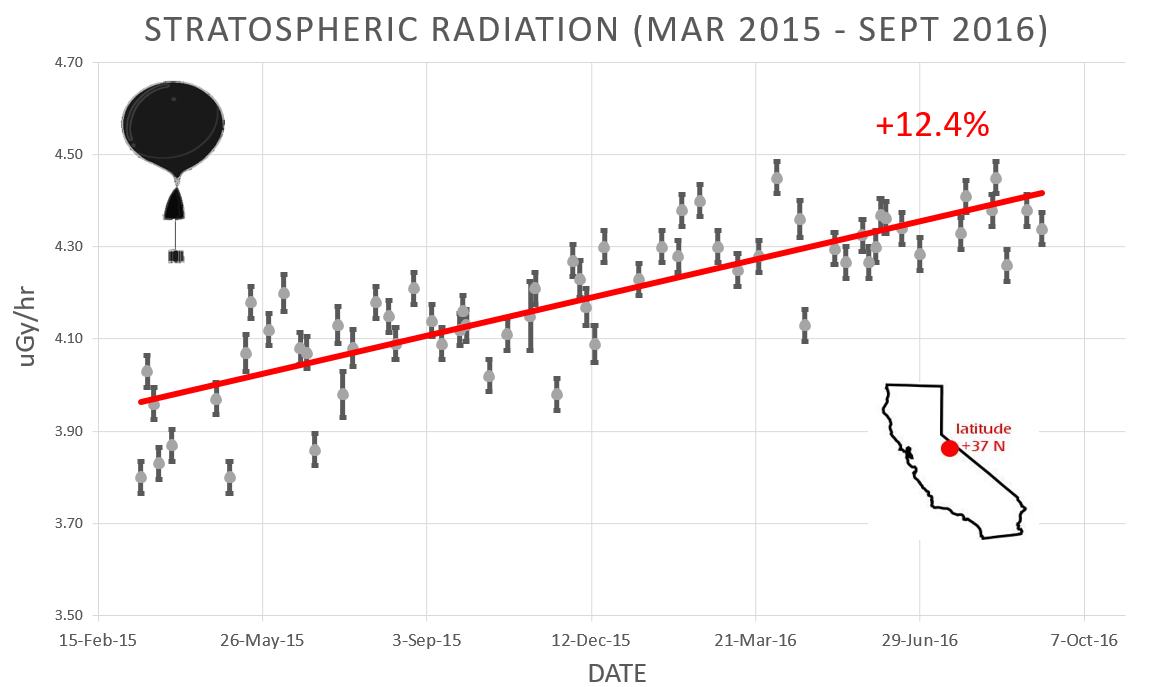
Readers, thank you for your patience while we continue to develop this new section of Spaceweather.com. We've been working to streamline our data reduction, allowing us to post results from balloon flights much more rapidly, and we have developed a new data product, shown here: 
This plot displays radiation measurements not only in the stratosphere, but also at aviation altitudes. Dose rates are expessed as multiples of sea level. For instance, we see that boarding a plane that flies at 25,000 feet exposes passengers to dose rates ~10x higher than sea level. At 40,000 feet, the multiplier is closer to 50x. These measurements are made by our usual cosmic ray payload as it passes through aviation altitudes en route to the stratosphere over California. What is this all about? Approximately once a week, Spaceweather.com and the students of Earth to Sky Calculus fly space weather balloons to the stratosphere over California. These balloons are equipped with radiation sensors that detect cosmic rays, a surprisingly "down to Earth" form of space weather. Cosmic rays can seed clouds, trigger lightning, and penetrate commercial airplanes. Furthermore, there are studies ( #1, #2, #3, #4) linking cosmic rays with cardiac arrhythmias and sudden cardiac death in the general population. Our latest measurements show that cosmic rays are intensifying, with an increase of more than 12% since 2015: 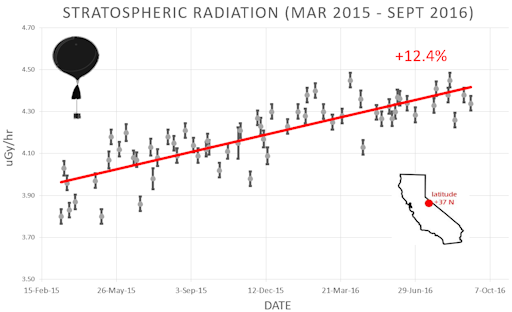
Why are cosmic rays intensifying? The main reason is the sun. Solar storm clouds such as coronal mass ejections (CMEs) sweep aside cosmic rays when they pass by Earth. During Solar Maximum, CMEs are abundant and cosmic rays are held at bay. Now, however, the solar cycle is swinging toward Solar Minimum, allowing cosmic rays to return. Another reason could be the weakening of Earth's magnetic field, which helps protect us from deep-space radiation. The radiation sensors onboard our helium balloons detect X-rays and gamma-rays in the energy range 10 keV to 20 MeV. These energies span the range of medical X-ray machines and airport security scanners. The data points in the graph above correspond to the peak of the Reneger-Pfotzer maximum, which lies about 67,000 feet above central California. When cosmic rays crash into Earth's atmosphere, they produce a spray of secondary particles that is most intense at the entrance to the stratosphere. Physicists Eric Reneger and Georg Pfotzer discovered the maximum using balloons in the 1930s and it is what we are measuring today. | | The official U.S. government space weather bureau | | | The first place to look for information about sundogs, pillars, rainbows and related phenomena. | | | Researchers call it a "Hubble for the sun." SDO is the most advanced solar observatory ever. | | | 3D views of the sun from NASA's Solar and Terrestrial Relations Observatory | | | Realtime and archival images of the Sun from SOHO. | | | from the NOAA Space Environment Center | | | a proud supporter of science education and Spaceweather.com | | | fun to read, but should be taken with a grain of salt! Forecasts looking ahead more than a few days are often wrong. | | | from the NOAA Space Environment Center | | | the underlying science of space weather |  | Beautyz for top beauty products reviews and their buying guides | | Reviews here can help you to pick up best memory foam mattresses. | | | These links help Spaceweather.com stay online. Thank you to our supporters! | | 


