Marianne's Heaven On Earth Aurora Chaser Tours Chasethelighttours.co.uk invites you to join them in their quest to find and photograph the Aurora Borealis. Experience the winter wonderland in the Tromsø Area. | | | INCREASING CHANCE OF FLARES: A new sunspot is emerging over the sun's eastern limb, and it poses a threat for M-class solar flares. For days this unnumbered active region has been throwing material up and over the limb as a herald of its approach: movie. Check back for updated flare probabilities as the sunspot rotates into view. Aurora alerts: text or voice ENORMOUS CORONAL HOLE: A gigantic hole in the sun's atmosphere has opened up and a broad stream of solar wind is flowing out of it. This is called a "coronal hole." It is the deep blue-colored region in this extreme UV image from NASA's Solar Dynamics Observatory: 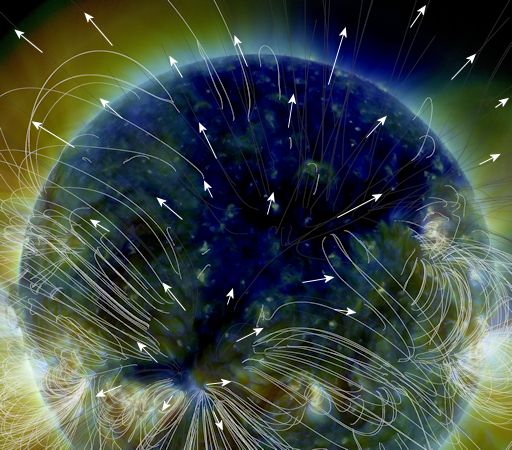
Coronal holes are places in the sun's atmosphere where the magnetic field unfurls and allows solar wind to escape. In the image above, the sun's magnetic field is traced by white curving lines. Outside the coronal hole, those magnetic fields curve back on themselves, trapping solar wind inside their loops. Inside the coronal hole, no such trapping occurs. Solar wind plasma is free to fly away as indicted by the white arrows. For much of the next week, Earth's environment in space will be dominated by winds flowing from this broad hole. This should activate some beautiful Arctic auroras. NOAA forecasters estimate a 40% of polar geomagnetic storms today, increasing to 60% on Oct. 15th as Earth moves deeper into the solar wind stream. Aurora alerts: text or voice Realtime Aurora Photo Gallery RADS ON A PLANE: Regular readers know that Spaceweather.com and the students of Earth to Sky Calculus regularly fly balloons to the stratosphere to measure cosmic rays. For the past six months, May through Oct. 2015, they have been taking their radiation sensors onboard commercial airplanes, too. The chart below summarizes their measurements on 18 different airplanes flying back and forth across the continental United States. 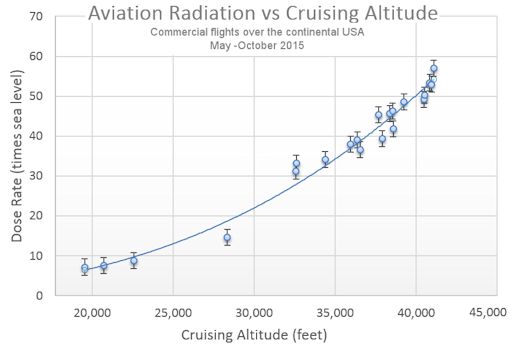
The points on the graph indicate the dose rate of cosmic rays inside the airplanes compared to sea level. For instance, the dose rate for flights that cruised at 40,000+ feet was more than 50x the dose rate on the ground below. No wonder the International Commission on Radiological Protection (ICRP) classifies pilots as occupational radiation workers. Cosmic rays come from deep space. They are high energy particles accelerated toward Earth by distant explosions such as supernovas and colliding neutron stars. Astronauts aren't the only ones who have to think about them; flyers do, too. Cosmic rays penetrate deep inside Earth's atmosphere where airplanes travel every day. This type of radiation is modulated by solar activity. Solar storms and CMEs tend to sweep aside cosmic rays, making it more difficut for cosmic rays to reach Earth. Low solar activity, on the other hand, allows an extra dose of cosmic rays to reach our planet. This is important because forecasters expect solar activity to drop sharply in the years ahead as we approach a new Solar Minimum. Cosmic rays are poised to increase accordingly. The plot, above, tells us what is "normal" in 2015. How will it change as the solar cycle wanes? Stay tuned for regular updates. AFTER LAST WEEK'S "MASSIVE AURORAS," WHAT WILL THIS WEEK BRING? Arctic sky watchers are still buzzing about last week's 3-day outburst of Northern Lights. Many veteran observers ranked it as the brightest display they had seen in years. Photographer Ole Salomonsen was one of them. "On Friday, Oct. 9th, I was treated with perhaps the most massive aurora I have ever witnessed," he says. "They appeared right over my hometown, Tromsø, Norway." 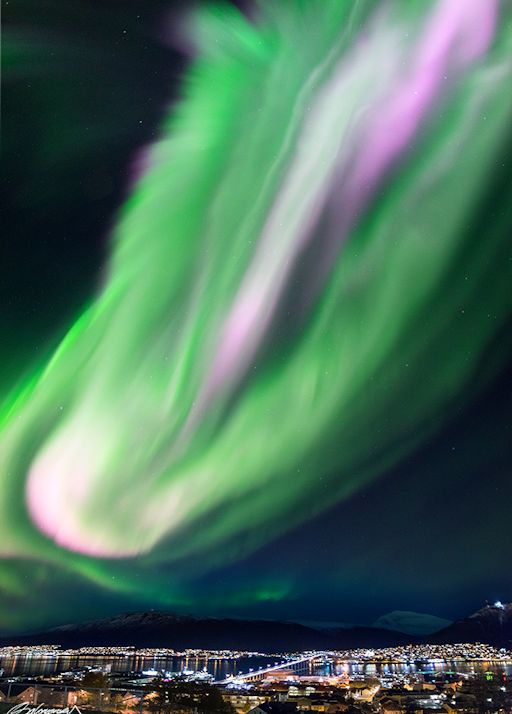
"The auroras were so strong that many of my shots were overexposed," he continues. "I had to continuously lower the exposure not to burn out the auroras. I have never in my life witnessed this amount of pink auroras, just MASSIVE!" The display was caused by shock waves from a CIR (co-rotating interaction region), which hit Earth on Oct. 7th, followed by a stream of high-speed solar wind on Oct. 8th and 9th. Strong geomagnetic storms sparked Northern Lights as far south as Virginia, USA. Another stream of solar wind is coming. ETA: Oct.12-13. Without another CIR to "pre-condition" Earth's magnetic field, however, this week's solar wind stream will probably have less effect. NOAA forecasters estimate a 60% chance of minor G1-class geomagnetic storms on Oct.12th. Aurora alerts: text or voice Realtime Space Weather Photo Gallery
Realtime Eclipse Photo Gallery
Realtime Sprite Photo Gallery
| | Cosmic Rays in the Atmosphere | | Situation Report -- Oct. 8, 2015 | Stratospheric Radiation (+37o N) | | Cosmic ray levels are elevated (+6.2% above the Space Age median). The trend is flat. Cosmic ray levels have increased +0% in the past month. | | Sept. 06: 414 uRad/hr | | Sept. 12: 409 uRad/hr | | Sept. 23: 412 uRad/hr | | Sept. 25: 416 uRad/hr | | Sept. 27: 413 uRad/hr | These measurements are based on space weather balloon flights, described below. Introduction: Once a week, and sometimes more often, Spaceweather.com and the students of Earth to Sky Calculus fly "space weather balloons" to the stratosphere. These balloons are equipped with radiation sensors that detect cosmic rays, a form of space weather important to people on Earth. Cosmic rays can alter the chemistry of the upper atmosphere, seed clouds, spark exotic forms of lightning, and penetrate commercial airplanes. This last point is of special interest to the traveling public. Our measurements show that someone flying back and forth across the continental USA, just once, can absorb as much ionizing radiation as 2 to 5 dental X-rays. From now on we will present the results of our regular weekly balloon flights in this section of our web site. Here is the radiation profile from our latest flight: 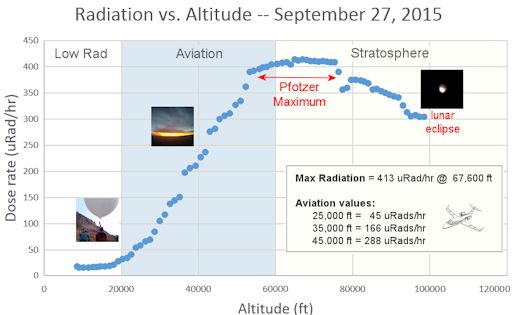
Radiation levels peak at the entrance to the stratosphere in a broad region called the "Pfotzer Maximum." This peak is named after physicist George Pfotzer who discovered it using balloons and Geiger tubes in the 1930s. Radiation levels there are nearly 100x sea level. Note that the bottom of the Pfotzer Maximim is near 55,000 ft. This means that some high-flying aircraft are not far from the zone of maximum radiation. Indeed, according to the Sept. 27th measurements, a plane flying at 45,000 feet is exposed to 288 uRads/hr. At that rate, a passenger would absorb about one dental X-ray's worth of radiation in 5 hours. The radiation sensors onboard our helium balloons detect X-rays and gamma-rays in the energy range 10 keV to 20 MeV. These energies span the range of medical X-ray machines and airport security scanners. Stay tuned for improvements to this section in the days and weeks ahead as we develop a glossary and better plain language strategies for communicating this information. Suggestions are welcomed. Every night, a network of NASA all-sky cameras scans the skies above the United States for meteoritic fireballs. Automated software maintained by NASA's Meteoroid Environment Office calculates their orbits, velocity, penetration depth in Earth's atmosphere and many other characteristics. Daily results are presented here on Spaceweather.com. On Oct. 13, 2015, the network reported 53 fireballs.
(50 sporadics, 2 Orionids, 1 Southern Taurid) 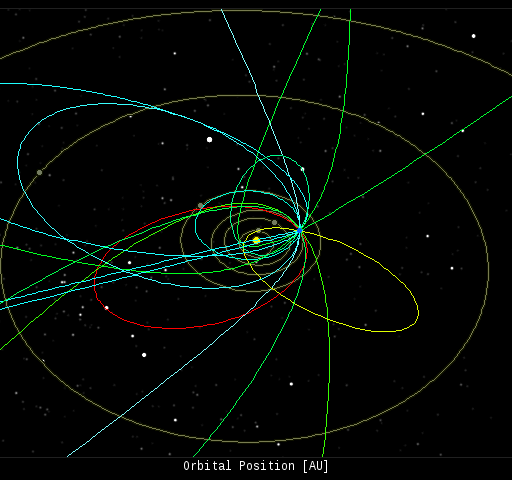 In this diagram of the inner solar system, all of the fireball orbits intersect at a single point--Earth. The orbits are color-coded by velocity, from slow (red) to fast (blue). [Larger image] [movies] Potentially Hazardous Asteroids ( PHAs) are space rocks larger than approximately 100m that can come closer to Earth than 0.05 AU. None of the known PHAs is on a collision course with our planet, although astronomers are finding new ones all the time. On October 13, 2015 there were potentially hazardous asteroids. Notes: LD means "Lunar Distance." 1 LD = 384,401 km, the distance between Earth and the Moon. 1 LD also equals 0.00256 AU. MAG is the visual magnitude of the asteroid on the date of closest approach. | | The official U.S. government space weather bureau | | | The first place to look for information about sundogs, pillars, rainbows and related phenomena. | | | Researchers call it a "Hubble for the sun." SDO is the most advanced solar observatory ever. | | | 3D views of the sun from NASA's Solar and Terrestrial Relations Observatory | | | Realtime and archival images of the Sun from SOHO. | | | from the NOAA Space Environment Center | | | the underlying science of space weather | | | Web-based high school science course with free enrollment | | 
