 | | | Switch to: Europe, USA, New Zealand, Antarctica Credit: NOAA/Ovation  Planetary K-index Planetary K-index
Now: Kp= 1 quiet
24-hr max: Kp= 2 quiet
explanation | more data
Interplanetary Mag. Field
Btotal: 8.6 nT
Bz: -7.0 nT south
more data: ACE, DSCOVR
Updated: Today at 2347 UT Coronal Holes: 19 Nov 18 
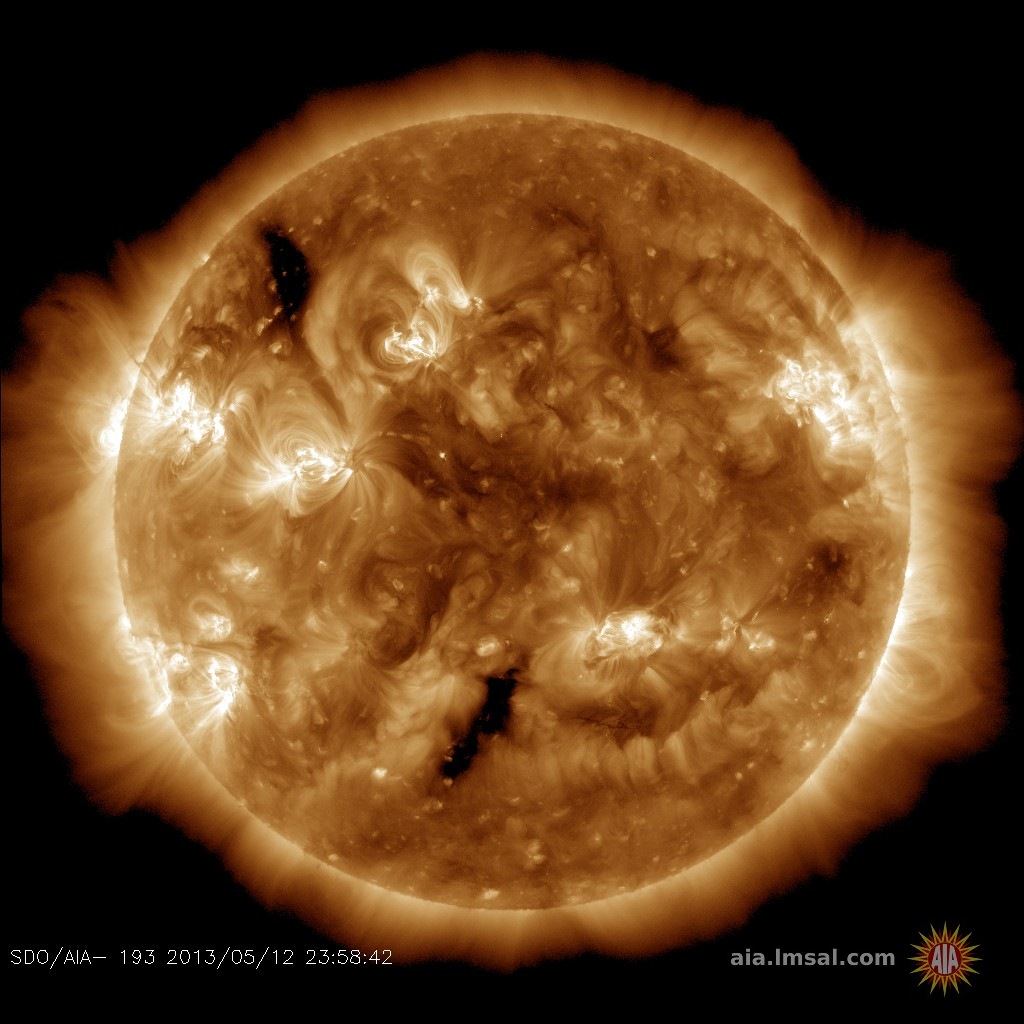
Solar wind flowing from this southern coronal hole could brush against Earth's magnetic field on Nov. 22nd. Credit: SDO/AIA  Noctilucent Clouds The season for noctilucent clouds (NLCs) in the northern hemisphere has come to an end. Images from NASA's AIM spacecraft show no NLCs around the north pole. Switch view: Europe, USA, Asia, Polar Updated at: 09-03-2018 14:55:02 Noctilucent Clouds The season for noctilucent clouds (NLCs) in the northern hemisphere has come to an end. Images from NASA's AIM spacecraft show no NLCs around the north pole. Switch view: Europe, USA, Asia, Polar Updated at: 09-03-2018 14:55:02 SPACE WEATHER
NOAA Forecasts | | Updated at: 2018 Nov 18 2200 UTC FLARE | 0-24 hr | 24-48 hr | CLASS M | 01 % | 01 % | CLASS X | 01 % | 01 % | Geomagnetic Storms:
Probabilities for significant disturbances in Earth's magnetic field are given for three activity levels: active, minor storm, severe storm Updated at: 2018 Nov 18 2200 UTC Mid-latitudes | 0-24 hr | 24-48 hr | ACTIVE | 15 % | 10 % | MINOR | 05 % | 01 % | SEVERE | 01 % | 01 % | High latitudes | 0-24 hr | 24-48 hr | ACTIVE | 15 % | 15 % | MINOR | 25 % | 25 % | SEVERE | 25 % | 20 % | | | |  | | | | | | | | | | | Lights Over Lapland has a brand-new website full of exciting adventures in Abisko National Park, Sweden! Take a look at our aurora activities and book your once-in-a-lifetime trip with us today! | | | MINOR STREAMS OF SOLAR WIND: A minor stream of solar wind is brushing against Earth's magnetic field today, Nov. 19th, but so far it is doing little to cause geomagnetic activity. Another similar stream is following behind it and could arrive on Nov. 22nd. Either stream could spark Arctic auroras before Thanksgiving. Free: Aurora Alerts A SUNSPOT FROM THE NEXT SOLAR CYCLE: Over the weekend, a small sunspot materialized in the sun's northern hemisphere, then, hours later, vanished again. Such an occurrence is hardly unusual during solar minimum when sunspots are naturally small and short-lived. However, this ephemeral spot was noteworthy because its magnetic field was reversed--marking it as a member of the next solar cycle. 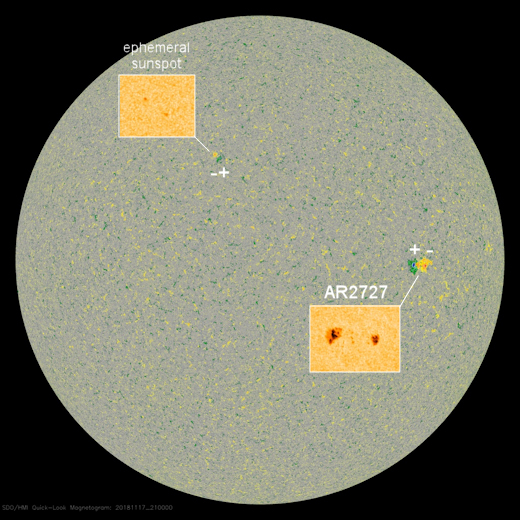
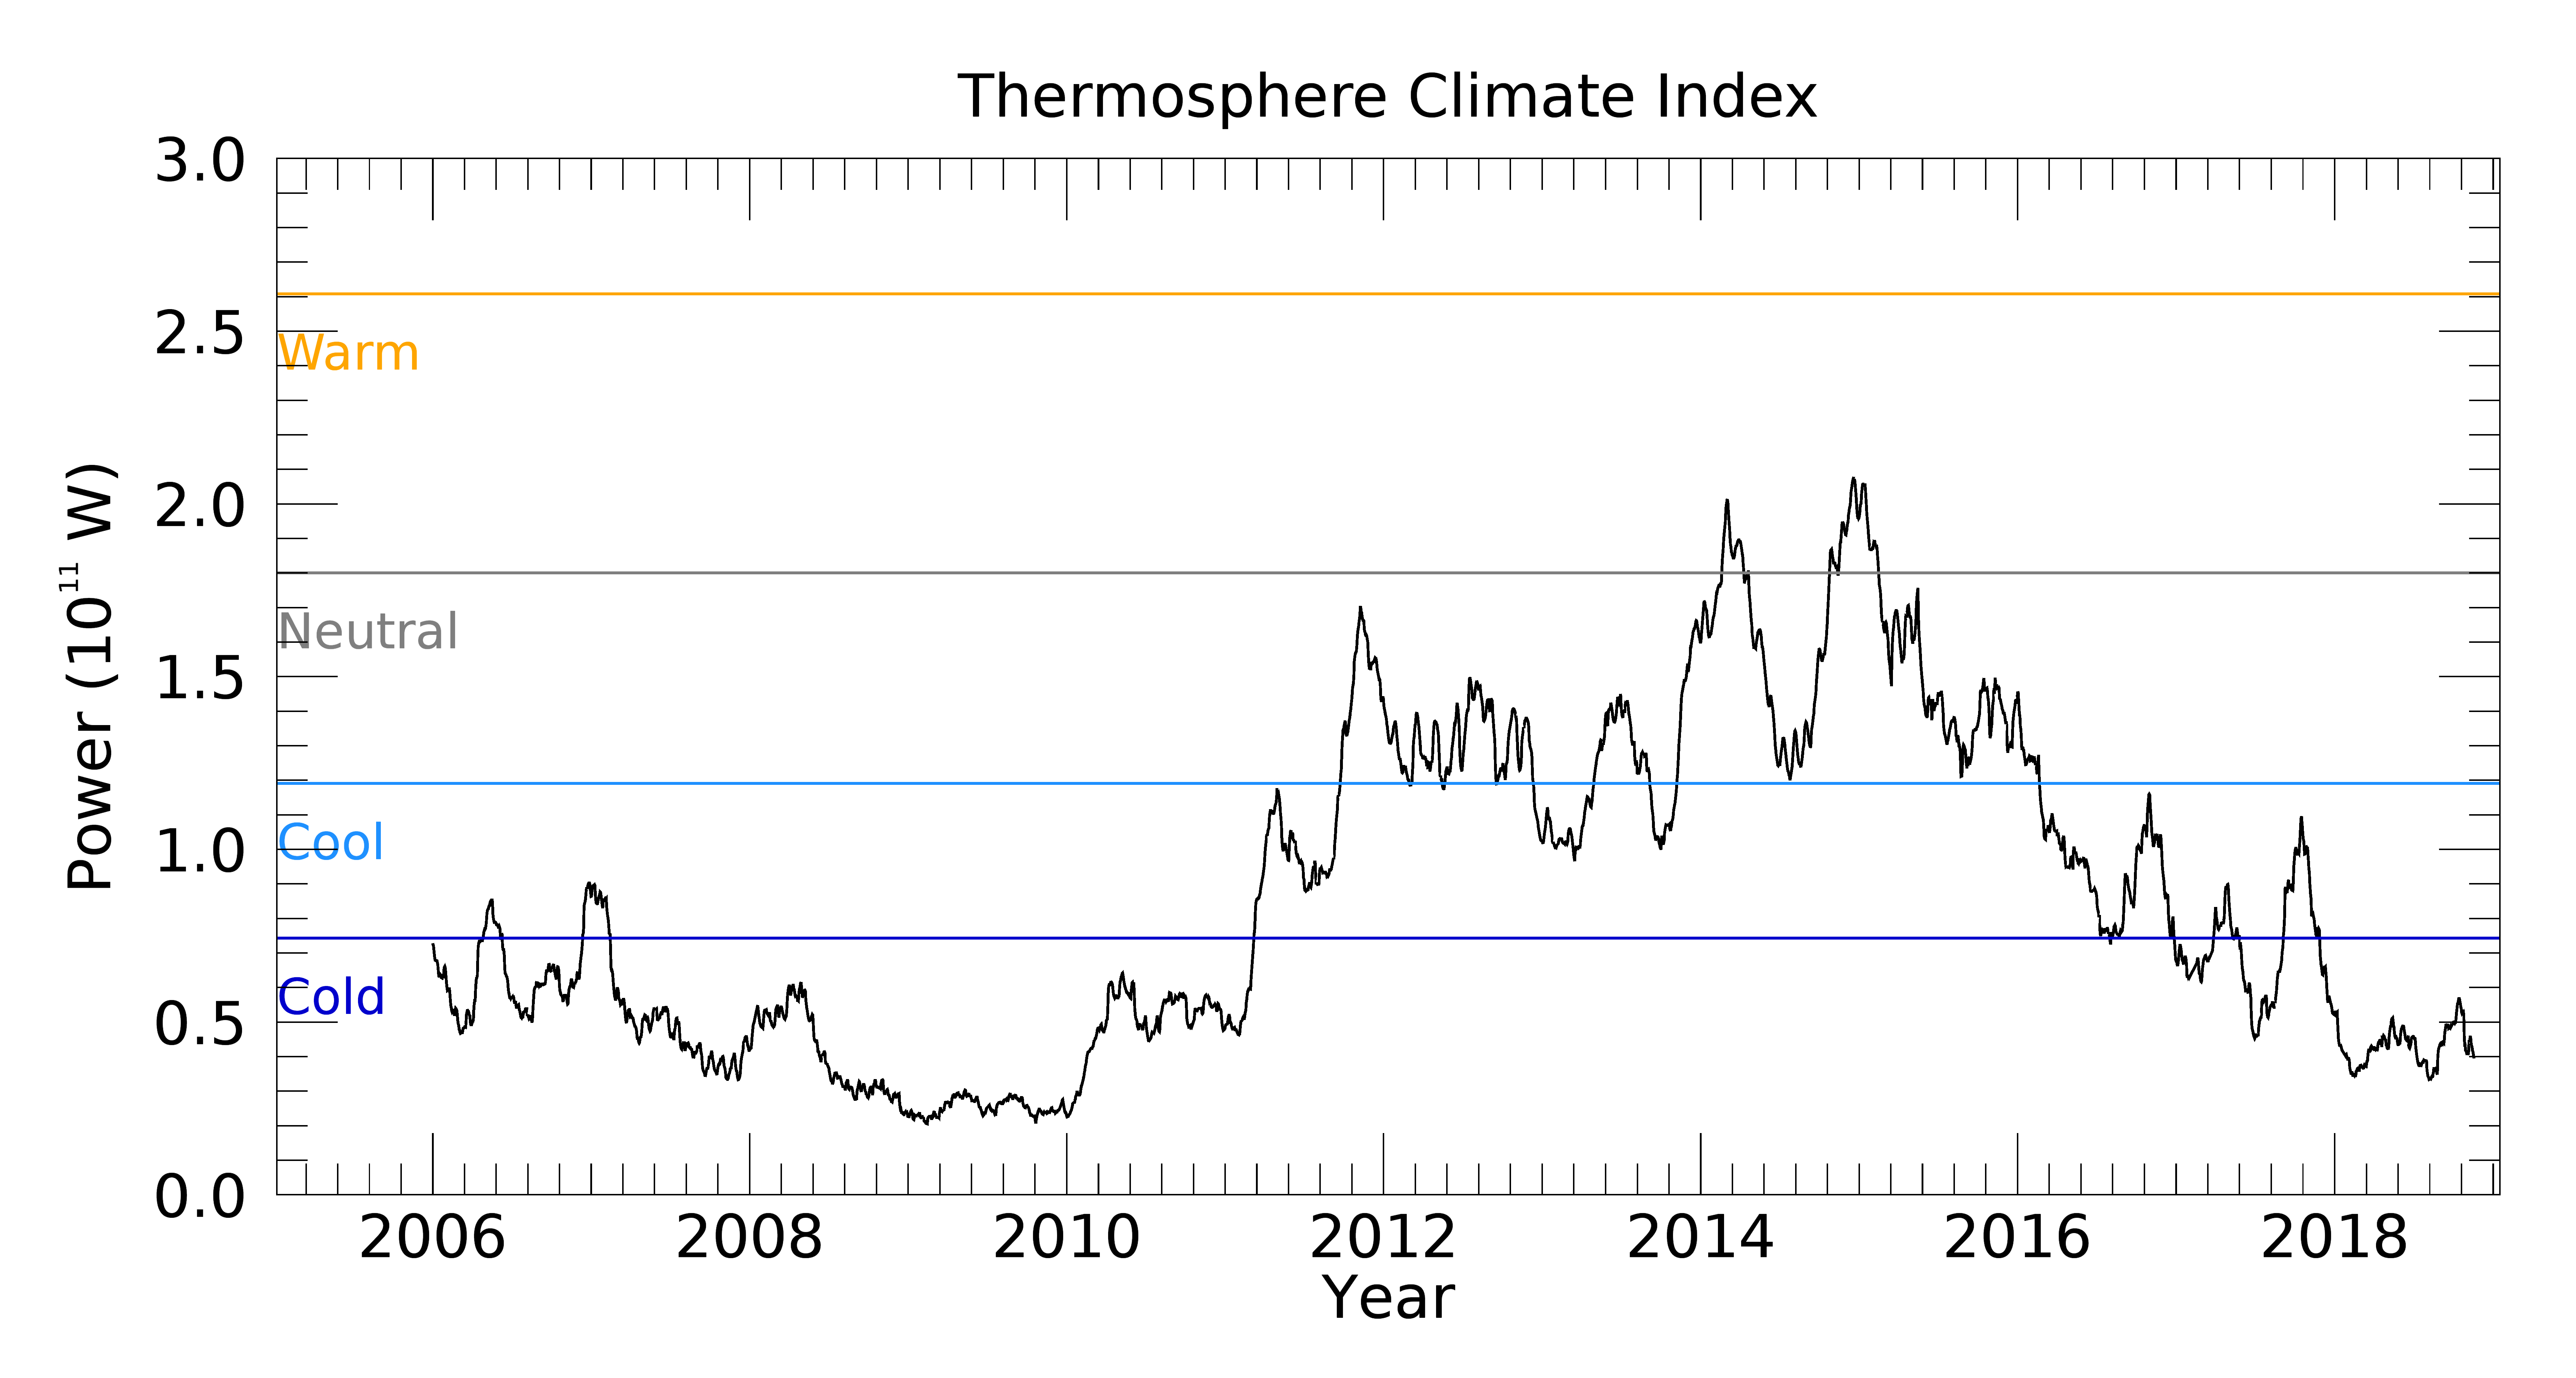
Shown above is a magnetic map of the sun from NASA's Solar Dynamics Observatory on Nov. 17th. Two sunspot groups visible at 21:00 UT are inset. Note sunspot AR2727 just north of the sun's equator. It is a member of decaying Solar Cycle 24, the cycle that peaked back in 2012-2014. Next, compare its magnetic polarity to that of the other, unnumbered sunspot high above it. They are opposite. According to Hale's Law, this means the two sunspots belong to different solar cycles. The high latitude sunspot appears to be a harbinger of Solar Cycle 25. Solar cycles always mix together at their boundaries. Indeed, ephemeral sunspots possibly belonging to Solar Cycle 25 have already been reported on Dec. 20, 2016, and April 8, 2018. Now we can add Nov. 17, 2018, to list. The slow transition between Solar Cycle 24 and Solar Cycle 25 appears to be underway. What does this mean? First, it suggests that the solar cycle is still operative. This contradicts widespread internet buzz that a Grand Minimum is in the offing, with no new sunspots expected for decades as the solar cycle grinds to a halt. Second, if patterns of previous solar cycles hold, Solar Minimum is not finished. It will probably continue to deepen in the year or so ahead even as new Solar Cycle 25 sunspots occasionally pop up, promising an ultimate end to the lassitude. Realtime Space Weather Photo Gallery A GIFT FROM THE EDGE OF SPACE: Once a week, the students of Earth to Sky Calculus launch a cosmic ray balloon to the stratosphere--a regular part of their atmospheric radiation monitoring program. Last week, a spiral galaxy went along for the ride, flying 113,517 feet above the Sierra Nevada mountains of central California: 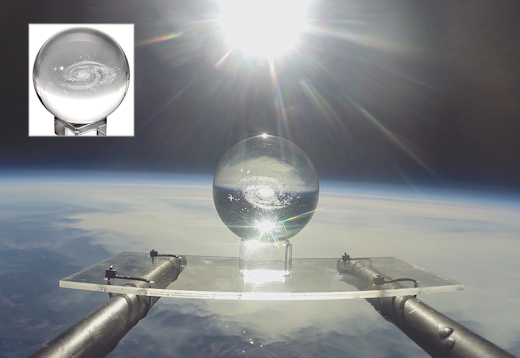
You can have it for $149.95. The students are selling Galaxy Globes to pay their helium bill. Each one comes with a greeting card showing the item in flight and telling the story of its journey to the edge of space. All sales support the Earth to Sky Calculus cosmic ray ballooning program and hands-on STEM research. Far Out Gifts: Earth to Sky Store
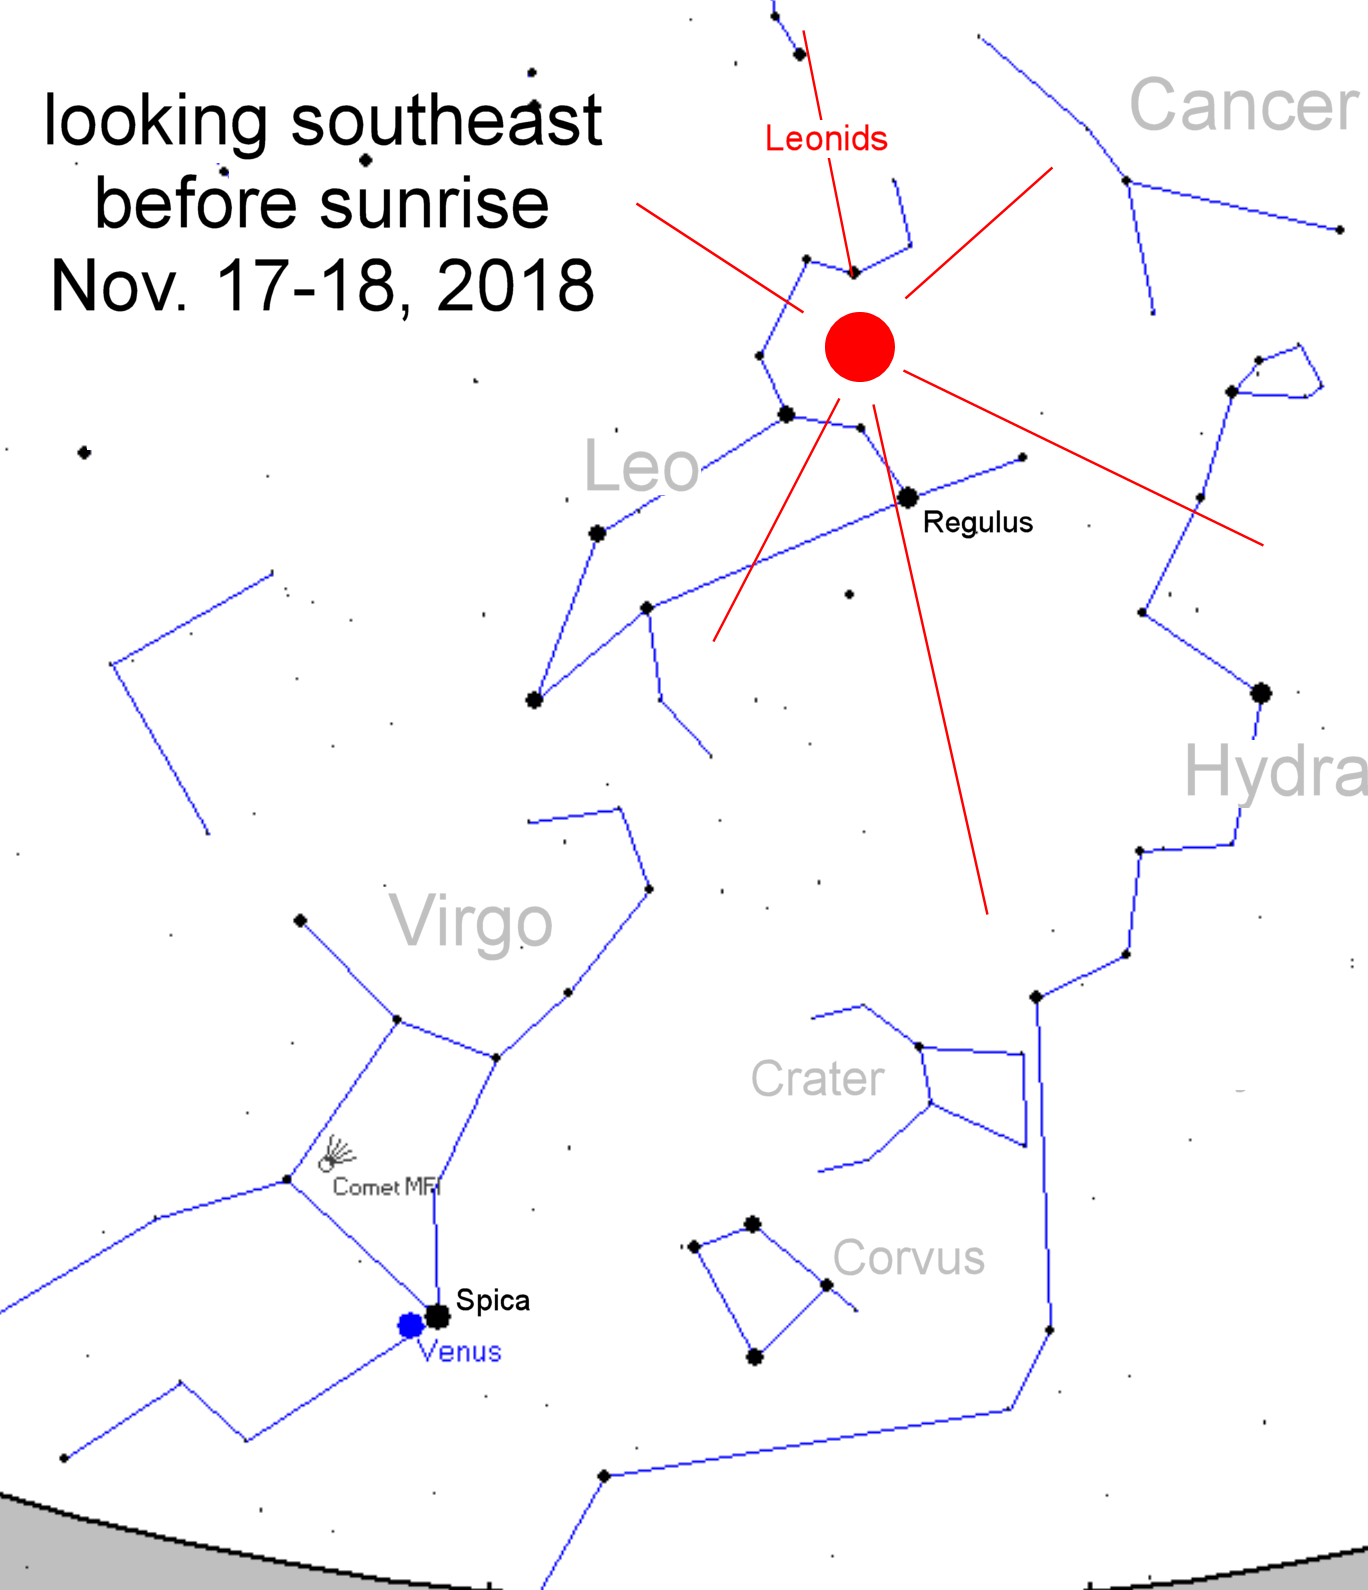
All sales support hands-on STEM education LEONID METEOR SHOWER UPDATE: The 2018 Leonid meteor shower peaked over the weekend when Earth passed through a stream of debris from Comet 55P/Tempel-Tuttle. International Observers reported seeing more than 20 meteors per hour from dark-sky sites, while NASA's network of all-sky meteor cameras recorded 69 Leonid fireballs over the USA. Some of them made observers feel like ducking! Sven Melchert caught this Leonid coming almost straight at him from the head of Leo on Nov. 18th: 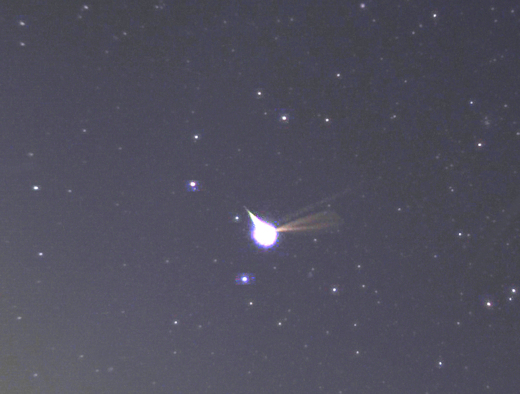
"In the early morning at 04:09:40 UT a bright meteor appeared over Stuttgart, Germany-- obviously one of the Leonid meteors," says Melchert. "This image, a 4 minute exposure, shows the fireball itself plus the debris drifting way after the meteoroid exploded." Meteor rates are expected to drop sharply on Nov. 19th as Earth exits the comet's stream of debris. Did you miss the shower? Browse the Realtime Meteor Gallery for highlights. [sky map] Realtime Meteor Photo Gallery
Realtime Comet Photo Gallery
Realtime Aurora Photo Gallery Every night, a network of NASA all-sky cameras scans the skies above the United States for meteoritic fireballs. Automated software maintained by NASA's Meteoroid Environment Office calculates their orbits, velocity, penetration depth in Earth's atmosphere and many other characteristics. Daily results are presented here on Spaceweather.com. On Nov. 19, 2018, the network reported 96 fireballs.
(48 Leonids, 42 sporadics, 5 Northern Taurids, 1 November omega Orionid)  In this diagram of the inner solar system, all of the fireball orbits intersect at a single point--Earth. The orbits are color-coded by velocity, from slow (red) to fast (blue). [Larger image] [movies] Potentially Hazardous Asteroids ( PHAs) are space rocks larger than approximately 100m that can come closer to Earth than 0.05 AU. None of the known PHAs is on a collision course with our planet, although astronomers are finding new ones all the time. On November 19, 2018 there were 1936 potentially hazardous asteroids.
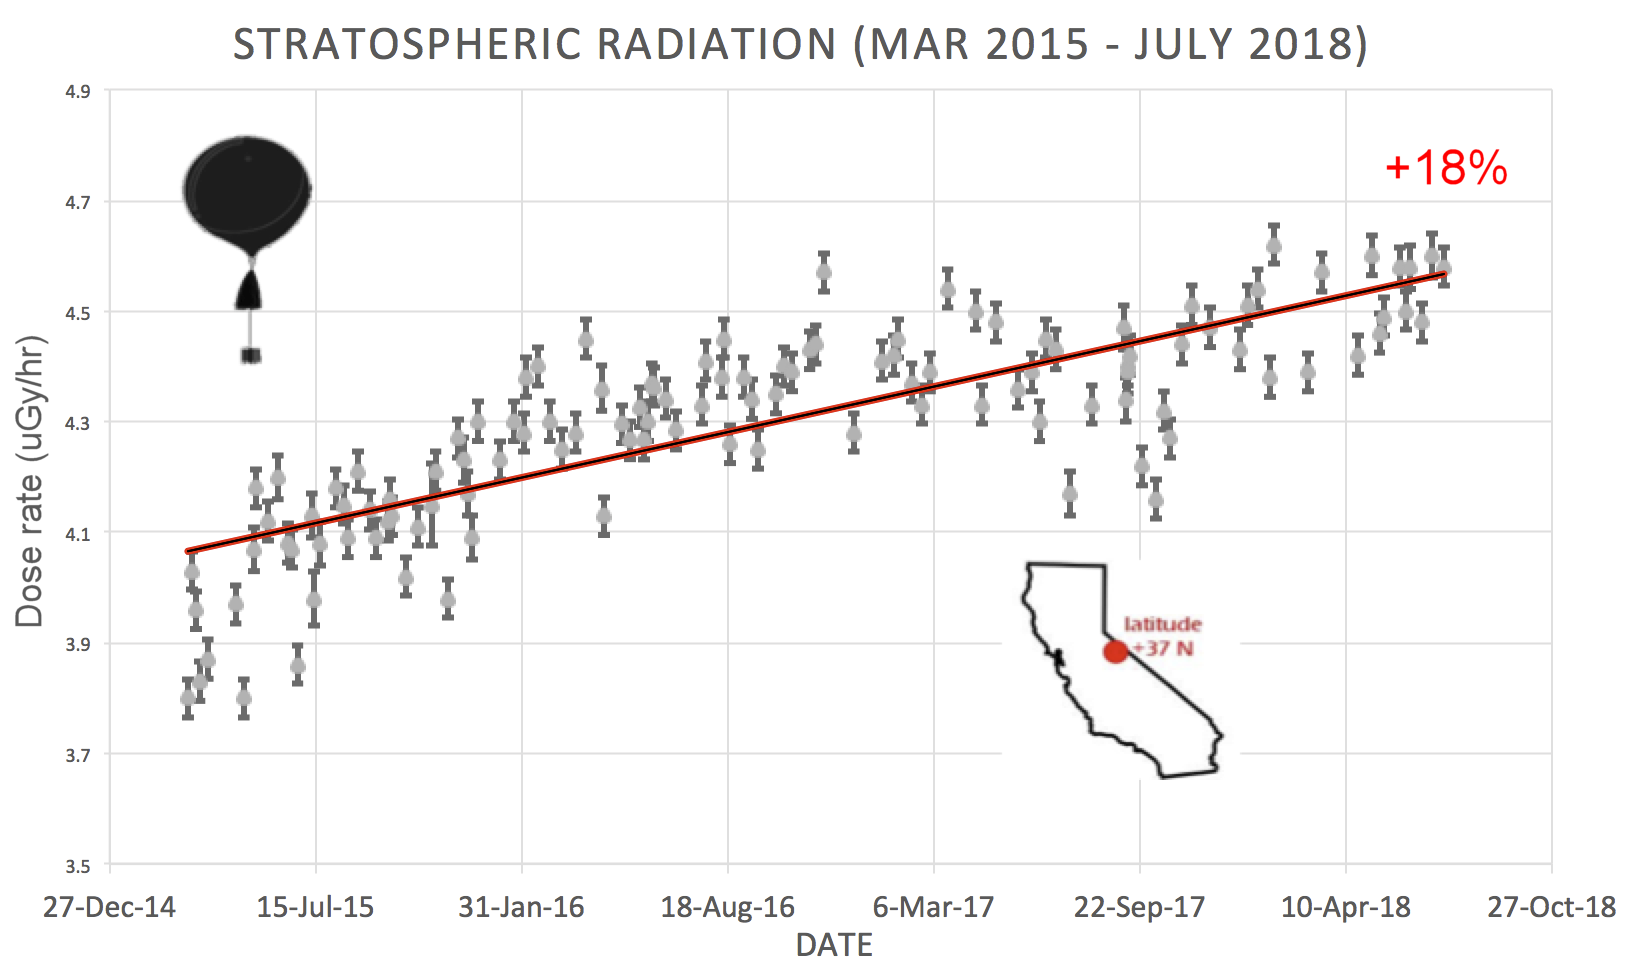
 | Recent & Upcoming Earth-asteroid encounters: | Asteroid | Date(UT) | Miss Distance | Velocity (km/s) | Diameter (m) | | 2018 VC7 | 2018-Nov-13 | 0.9 LD | 4.5 | 12 | | 2008 WS62 | 2018-Nov-13 | 5.2 LD | 8.9 | 32 | | 2018 VR6 | 2018-Nov-13 | 8 LD | 9.5 | 12 | | 2018 VF5 | 2018-Nov-13 | 9.7 LD | 6.8 | 11 | | 2018 UQ1 | 2018-Nov-13 | 9.4 LD | 12.3 | 146 | | 2018 VU7 | 2018-Nov-13 | 6.4 LD | 9.4 | 13 | | 2018 VO3 | 2018-Nov-14 | 4.1 LD | 7.7 | 15 | | 2018 VX5 | 2018-Nov-14 | 3.6 LD | 8.3 | 26 | | 2018 VK1 | 2018-Nov-14 | 10.2 LD | 2.3 | 12 | | 2018 VW4 | 2018-Nov-14 | 9.8 LD | 12.5 | 45 | | 2018 VD7 | 2018-Nov-14 | 9.1 LD | 11 | 26 | | 2018 VR8 | 2018-Nov-14 | 18.9 LD | 12.3 | 28 | | 2018 VQ8 | 2018-Nov-14 | 18 LD | 9.7 | 38 | | 2018 VJ10 | 2018-Nov-14 | 0.5 LD | 13.5 | 7 | | 2007 UL12 | 2018-Nov-15 | 16.4 LD | 25.8 | 235 | | 2018 VV7 | 2018-Nov-15 | 12.2 LD | 8.3 | 21 | | 2018 VT8 | 2018-Nov-16 | 10.3 LD | 6.2 | 58 | | 2018 WH | 2018-Nov-16 | 0.5 LD | 7.8 | 4 | | 2018 WG | 2018-Nov-16 | 0.1 LD | 11.8 | 5 | | 2018 VS8 | 2018-Nov-17 | 2 LD | 9.2 | 13 | | 2018 VT4 | 2018-Nov-18 | 11.1 LD | 4.4 | 18 | | 2018 VH10 | 2018-Nov-18 | 4.4 LD | 14 | 35 | | 2018 WF | 2018-Nov-18 | 6.8 LD | 10.6 | 18 | | 2018 WE | 2018-Nov-18 | 0.6 LD | 12.8 | 8 | | 2018 WC | 2018-Nov-19 | 15.2 LD | 19.9 | 87 | | 2018 WJ | 2018-Nov-19 | 0.3 LD | 18.7 | 10 | | 2018 VQ6 | 2018-Nov-20 | 11.4 LD | 7.9 | 21 | | 2018 VP7 | 2018-Nov-20 | 7.7 LD | 5.7 | 16 | | 2018 WD | 2018-Nov-24 | 4.5 LD | 13.6 | 54 | | 2009 WB105 | 2018-Nov-25 | 15.2 LD | 18.9 | 71 | | 2018 VT7 | 2018-Nov-25 | 8.2 LD | 2.3 | 10 | | 2008 WD14 | 2018-Nov-27 | 7.4 LD | 9.3 | 93 | | 2001 WO15 | 2018-Nov-28 | 13.6 LD | 11.7 | 107 | | 2018 VE4 | 2018-Nov-30 | 15 LD | 4.8 | 29 | | 2018 TG6 | 2018-Dec-02 | 3.9 LD | 1.4 | 13 | | 2013 VX4 | 2018-Dec-09 | 4.1 LD | 6.6 | 65 | | 2018 VX6 | 2018-Dec-10 | 16.5 LD | 11.2 | 68 | | 2015 XX169 | 2018-Dec-13 | 17 LD | 5.8 | 12 | | 2018 VO9 | 2018-Dec-15 | 2.6 LD | 2.9 | 16 | | 2017 XQ60 | 2018-Dec-21 | 11.3 LD | 15.6 | 47 | | 163899 | 2018-Dec-22 | 7.4 LD | 6.2 | 1232 | | 418849 | 2018-Dec-23 | 16.6 LD | 17.6 | 269 | | 2014 AD16 | 2019-Jan-04 | 12.9 LD | 9.4 | 12 | | 2016 AZ8 | 2019-Jan-07 | 11.6 LD | 9.1 | 224 | | 2013 YM2 | 2019-Jan-09 | 7.3 LD | 4.3 | 20 | Notes: LD means "Lunar Distance." 1 LD = 384,401 km, the distance between Earth and the Moon. 1 LD also equals 0.00256 AU. MAG is the visual magnitude of the asteroid on the date of closest approach. | | Cosmic Rays in the Atmosphere | SOMETHING NEW! We have developed a new predictive model of aviation radiation. It's called E-RAD--short for Empirical RADiation model. We are constantly flying radiation sensors onboard airplanes over the US and and around the world, so far collecting more than 22,000 gps-tagged radiation measurements. Using this unique dataset, we can predict the dosage on any flight over the USA with an error no worse than 15%. E-RAD lets us do something new: Every day we monitor approximately 1400 flights criss-crossing the 10 busiest routes in the continental USA. Typically, this includes more than 80,000 passengers per day. E-RAD calculates the radiation exposure for every single flight. The Hot Flights Table is a daily summary of these calculations. It shows the 5 charter flights with the highest dose rates; the 5 commercial flights with the highest dose rates; 5 commercial flights with near-average dose rates; and the 5 commercial flights with the lowest dose rates. Passengers typically experience dose rates that are 20 to 70 times higher than natural radiation at sea level. To measure radiation on airplanes, we use the same sensors we fly to the stratosphere onboard Earth to Sky Calculus cosmic ray balloons: neutron bubble chambers and X-ray/gamma-ray Geiger tubes sensitive to energies between 10 keV and 20 MeV. These energies span the range of medical X-ray machines and airport security scanners. Column definitions: (1) The flight number; (2) The maximum dose rate during the flight, expressed in units of natural radiation at sea level; (3) The maximum altitude of the plane in feet above sea level; (4) Departure city; (5) Arrival city; (6) Duration of the flight. SPACE WEATHER BALLOON DATA: Approximately once a week, Spaceweather.com and the students of Earth to Sky Calculus fly space weather balloons to the stratosphere over California. These balloons are equipped with radiation sensors that detect cosmic rays, a surprisingly "down to Earth" form of space weather. Cosmic rays can seed clouds, trigger lightning, and penetrate commercial airplanes. Furthermore, there are studies ( #1, #2, #3, #4) linking cosmic rays with cardiac arrhythmias and sudden cardiac death in the general population. Our latest measurements show that cosmic rays are intensifying, with an increase of more than 18% since 2015: 
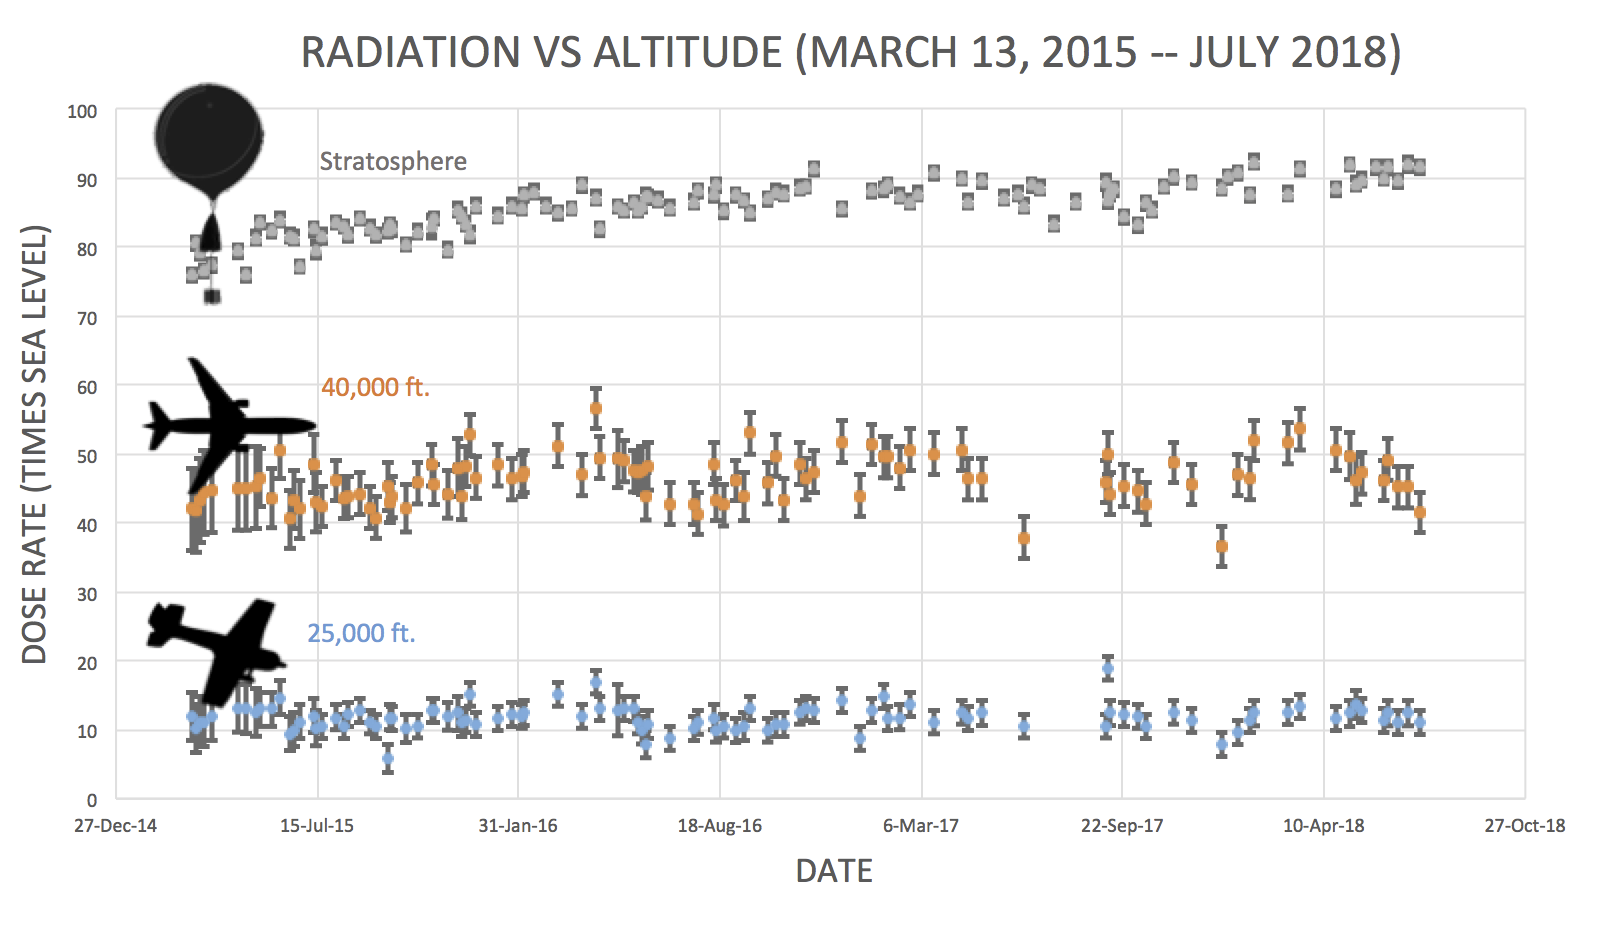
The data points in the graph above correspond to the peak of the Reneger-Pfotzer maximum, which lies about 67,000 feet above central California. When cosmic rays crash into Earth's atmosphere, they produce a spray of secondary particles that is most intense at the entrance to the stratosphere. Physicists Eric Reneger and Georg Pfotzer discovered the maximum using balloons in the 1930s and it is what we are measuring today. En route to the stratosphere, our sensors also pass through aviation altitudes: 
In this plot, dose rates are expessed as multiples of sea level. For instance, we see that boarding a plane that flies at 25,000 feet exposes passengers to dose rates ~10x higher than sea level. At 40,000 feet, the multiplier is closer to 50x. The radiation sensors onboard our helium balloons detect X-rays and gamma-rays in the energy range 10 keV to 20 MeV. These energies span the range of medical X-ray machines and airport security scanners. Why are cosmic rays intensifying? The main reason is the sun. Solar storm clouds such as coronal mass ejections (CMEs) sweep aside cosmic rays when they pass by Earth. During Solar Maximum, CMEs are abundant and cosmic rays are held at bay. Now, however, the solar cycle is swinging toward Solar Minimum, allowing cosmic rays to return. Another reason could be the weakening of Earth's magnetic field, which helps protect us from deep-space radiation. | | The official U.S. government space weather bureau | | | The first place to look for information about sundogs, pillars, rainbows and related phenomena. | | | Researchers call it a "Hubble for the sun." SDO is the most advanced solar observatory ever. | | | 3D views of the sun from NASA's Solar and Terrestrial Relations Observatory | | | Realtime and archival images of the Sun from SOHO. | | | from the NOAA Space Environment Center | | | fun to read, but should be taken with a grain of salt! Forecasts looking ahead more than a few days are often wrong. | | | from the NOAA Space Environment Center | | | the underlying science of space weather |  | If you are a Youtuber and want to buy real Youtube views than try out Buyrealsocial.com for the best results possible! | | To find reviews of new online casino sites in the UK try The Casino DB where there are hundreds of online casino reviews complete with bonuses and ratings. Looking for a new online casino? Try Casimpo the new site dedicated to making online casino simple and easy for all. | | | These links help Spaceweather.com stay online. Thank you to our supporters! | | | | | | | | |  | | |  | ©2018 Spaceweather.com. All rights reserved. This site is penned daily by Dr. Tony Phillips. | |


