Lights Over Lapland is excited to announce that we now have TWO aurora webcams covering nearly a 200° view of Abisko National Park in Sweden! Watch the auroras dance live, all season long here. | | |
GEOMAGNETIC STORM PREDICTED: NOAA forecasters say there is a 50% chance of G1-class geomagnetic storms on Jan. 1, 2018, when a stream of solar wind engulfs Earth's magnetic field. Arctic sky watchers should be alert for auroras mixed with bright moonlight. Happy New Year! Free: Aurora alerts.
LUNAR FOGBOW VS. NORTHERN LIGHTS: Deep inside the Arctic Circle, aurora tour guide Tim Nordström of Abisko, Sweden, routinely sees green curtains hanging down from the sky. On Dec. 28th, he saw something different: a pale arc reaching out of the ground:
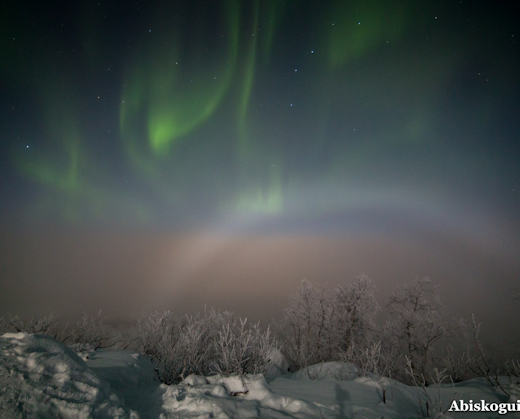
"It was amazing," says Nordström. "We were hiking through a frost-covered forest. The air was cold (-25 C) and crisp. At first the fog was thick above us, but after a while it started to thin out so we could see the green auroras overhead. A bright shaft of moonlight lanced through the fog --and that's when we saw the fogbow."
Fogbows are cousins of rainbows and they are formed in essentially the same way: light bounces in and out of water droplets to produce a luminous arc. In this case, the droplets were supercooled (to remain liquid in the freezing air) and much smaller than typical raindrops. Tiny droplets cause a diffraction effect not seen in ordinary rainbows; as a result, the colors are smeared together resulting in a nearly-white arc.
Realtime Space Weather Photo Gallery
FALSE AURORAS: The space weather forecast did not call for auroras in New Hampshire last night. Yet when Stephanie Graudons of Lebanon NH looked outside at 3 am, the sky was filled with colorful lights. "An unexpected sight," she says, "these light pillars were so amazing that I dragged my fiance out of bed and out into the -14 degree night to photograph them!"
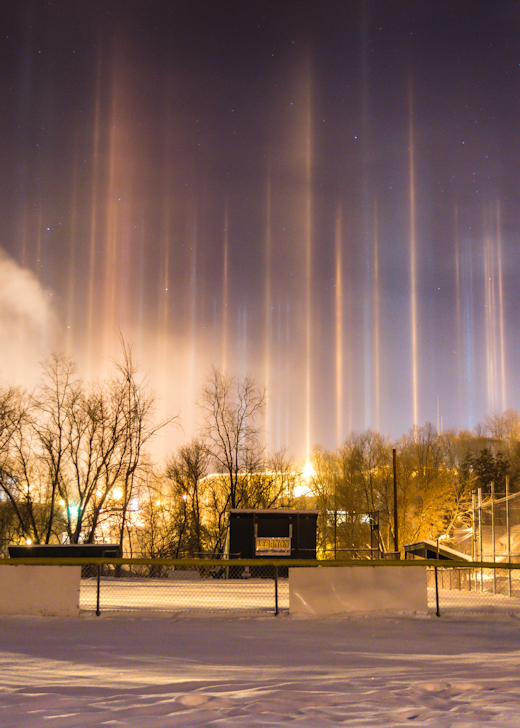
"Shivering in a foot of new snow in a nearby baseball field, we watched until they faded away," says Graudons. "It was well worth the lack of sleep."
Sometimes called "false auroras," light pillars are caused by ice crystals in the air. The crystals' flat faces intercept urban lights and spread them into colorful columns. No solar activity is required for the phenomenon. The only ingredients are ice and light pollution.
The different colors of the pillars are caused by various color temperatures of street lights. Warm orange pillars come from traditional high pressure sodium lamps, while bright white pillars come from newer LED lamps.
Realtime Aurora Photo Gallery
EXTENDED! STUDENT CHRISTMAS SPECIAL: For the holiday season only, we're reducing the cost of payload space on Earth to Sky Calculus balloons from $500 to only $299. Buy a ticket to space on or before Jan. 1st and your student can send an experiment, photo, or keepsake item to the stratosphere, completely supported by an Earth to Sky Calculus launch and recovery team.

This is not only a great Christmas gift, but also a good kickstarter for science fair projects. Experiments will be flown and returned along with video footage, GPS tracking, temperature, pressure, altimetry and radiation data.
To take advantage of the discounted rate, payment must be received before Jan. 1st. However, the flight can take place at any time in the next 12 months.
Conditions: No mammals. Plants and non-pathogenic microbes are allowed. Generally speaking, experiments should weigh less than a few hundred grams and occupy a volume less than that of a school lunchbox. A brainstorming session is included with each certificate. Dr. Tony Phillips and other members of the Earth to Sky team will chat with recipients to help them craft an experiment that will work in the harsh environment of the stratosphere.
Far Out Gifts: Earth to Sky Store
All proceeds support hands-on STEM education
Every night, a network of
NASA all-sky cameras scans the skies above the United States for meteoritic fireballs. Automated software maintained by NASA's Meteoroid Environment Office calculates their orbits, velocity, penetration depth in Earth's atmosphere and many other characteristics. Daily results are presented here on Spaceweather.com.
On Dec. 30, 2017, the network reported 15 fireballs.
(12 sporadics, 2 December Leonis Minorids, 1 Quadrantid)
In this diagram of the inner solar system, all of the fireball orbits intersect at a single point--Earth. The orbits are color-coded by velocity, from slow (red) to fast (blue). [Larger image] [movies]
Potentially Hazardous Asteroids (
PHAs) are space rocks larger than approximately 100m that can come closer to Earth than 0.05 AU. None of the known PHAs is on a collision course with our planet, although astronomers are finding
new ones all the time.
On December 30, 2017 there were 1872 potentially hazardous asteroids.
 |
Recent & Upcoming Earth-asteroid encounters: | Asteroid | Date(UT) | Miss Distance | Velocity (km/s) | Diameter (m) |
| 2017 YK5 | 2017-Dec-24 | 13.8 LD | 13.1 | 59 |
| 2017 YS1 | 2017-Dec-24 | 1.9 LD | 3.4 | 6 |
| 2017 WZ14 | 2017-Dec-24 | 7.6 LD | 4.9 | 34 |
| 2017 YR3 | 2017-Dec-25 | 8.5 LD | 6.5 | 30 |
| 2017 YR4 | 2017-Dec-25 | 18.3 LD | 6.7 | 51 |
| 2017 YQ1 | 2017-Dec-26 | 5.1 LD | 21.1 | 43 |
| 2017 YV4 | 2017-Dec-26 | 17.3 LD | 9 | 39 |
| 2017 YQ6 | 2017-Dec-27 | 1.9 LD | 12.3 | 9 |
| 2017 YD2 | 2017-Dec-27 | 2.2 LD | 8.3 | 6 |
| 2017 YZ4 | 2017-Dec-28 | 0.6 LD | 9.6 | 9 |
| 2017 YB6 | 2017-Dec-29 | 6.1 LD | 12.3 | 11 |
| 2017 YP6 | 2017-Dec-29 | 14.2 LD | 16 | 34 |
| 2017 XG1 | 2017-Dec-29 | 16.3 LD | 9.9 | 38 |
| 2017 QL33 | 2017-Dec-30 | 13.3 LD | 8.2 | 196 |
| 2017 YU1 | 2017-Dec-30 | 7.8 LD | 7.6 | 21 |
| 2017 YL5 | 2017-Dec-31 | 16.4 LD | 19.6 | 61 |
| 2017 YD | 2018-Jan-01 | 19.1 LD | 4.1 | 30 |
| 2015 RT1 | 2018-Jan-02 | 20 LD | 9 | 30 |
| 2017 YX4 | 2018-Jan-08 | 15 LD | 7.3 | 64 |
| 2017 XT61 | 2018-Jan-08 | 11.3 LD | 10.8 | 84 |
| 2004 FH | 2018-Jan-10 | 20 LD | 8.5 | 26 |
| 2017 YU3 | 2018-Jan-14 | 18 LD | 12.9 | 53 |
| 306383 | 2018-Jan-22 | 14.4 LD | 17.4 | 178 |
| 2002 CB19 | 2018-Feb-02 | 10.5 LD | 15.6 | 36 |
| 276033 | 2018-Feb-04 | 11 LD | 34 | 646 |
| 2015 BN509 | 2018-Feb-09 | 12.9 LD | 17.7 | 257 |
| 1991 VG | 2018-Feb-11 | 18.4 LD | 2.1 | 7 |
| 2014 WQ202 | 2018-Feb-11 | 15.1 LD | 19.8 | 62 |
| 2016 CO246 | 2018-Feb-22 | 15.3 LD | 5.4 | 21 |
| 2017 DR109 | 2018-Feb-24 | 3.7 LD | 7.4 | 11 |
| 2016 FU12 | 2018-Feb-26 | 13.2 LD | 4.5 | 15 |
| 2014 EY24 | 2018-Feb-27 | 14.8 LD | 8 | 54 |
Notes: LD means "Lunar Distance." 1 LD = 384,401 km, the distance between Earth and the Moon. 1 LD also equals 0.00256 AU. MAG is the visual magnitude of the asteroid on the date of closest approach. | | Cosmic Rays in the Atmosphere |
Readers, thank you for your patience while we continue to develop this new section of Spaceweather.com. We've been working to streamline our data reduction, allowing us to post results from balloon flights much more rapidly, and we have developed a new data product, shown here:

This plot displays radiation measurements not only in the stratosphere, but also at aviation altitudes. Dose rates are expessed as multiples of sea level. For instance, we see that boarding a plane that flies at 25,000 feet exposes passengers to dose rates ~10x higher than sea level. At 40,000 feet, the multiplier is closer to 50x. These measurements are made by our usual cosmic ray payload as it passes through aviation altitudes en route to the stratosphere over California.
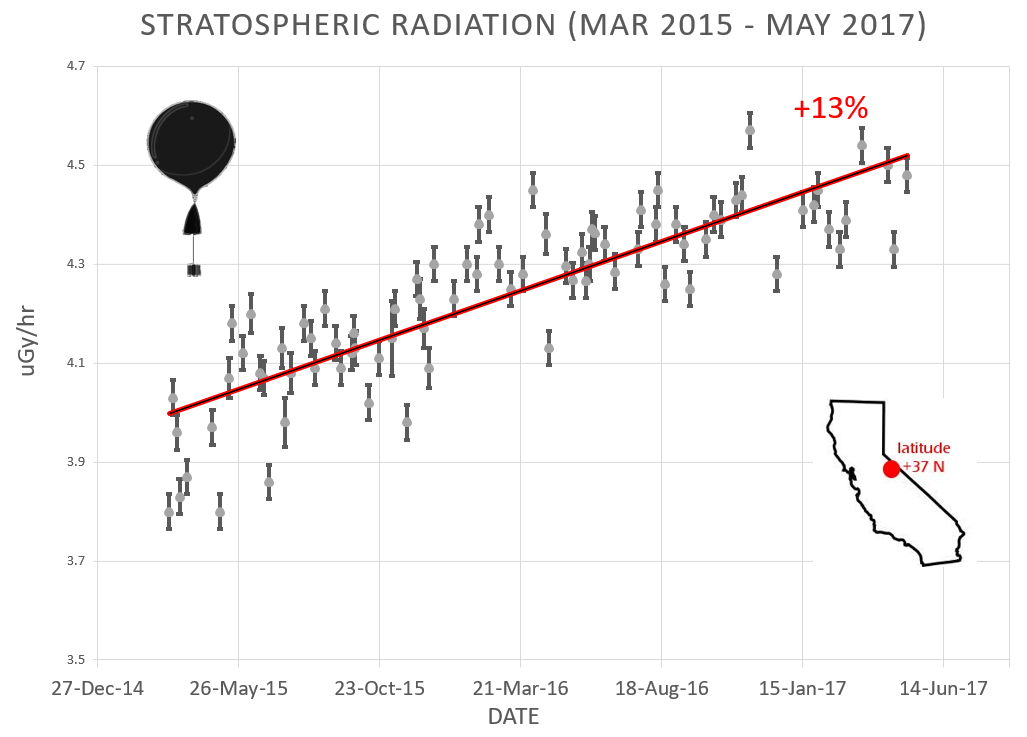
What is this all about? Approximately once a week, Spaceweather.com and the students of Earth to Sky Calculus fly space weather balloons to the stratosphere over California. These balloons are equipped with radiation sensors that detect cosmic rays, a surprisingly "down to Earth" form of space weather. Cosmic rays can seed clouds, trigger lightning, and penetrate commercial airplanes. Furthermore, there are studies ( #1, #2, #3, #4) linking cosmic rays with cardiac arrhythmias and sudden cardiac death in the general population. Our latest measurements show that cosmic rays are intensifying, with an increase of more than 13% since 2015:
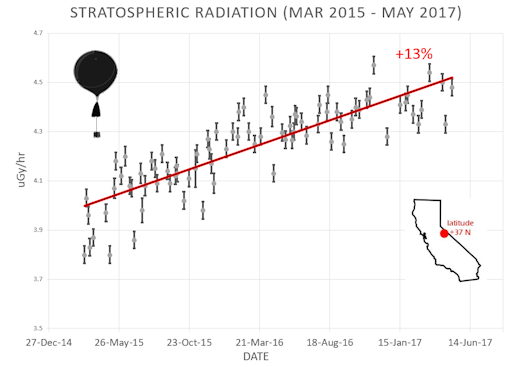
Why are cosmic rays intensifying? The main reason is the sun. Solar storm clouds such as coronal mass ejections (CMEs) sweep aside cosmic rays when they pass by Earth. During Solar Maximum, CMEs are abundant and cosmic rays are held at bay. Now, however, the solar cycle is swinging toward Solar Minimum, allowing cosmic rays to return. Another reason could be the weakening of Earth's magnetic field, which helps protect us from deep-space radiation.
The radiation sensors onboard our helium balloons detect X-rays and gamma-rays in the energy range 10 keV to 20 MeV. These energies span the range of medical X-ray machines and airport security scanners.
The data points in the graph above correspond to the peak of the Reneger-Pfotzer maximum, which lies about 67,000 feet above central California. When cosmic rays crash into Earth's atmosphere, they produce a spray of secondary particles that is most intense at the entrance to the stratosphere. Physicists Eric Reneger and Georg Pfotzer discovered the maximum using balloons in the 1930s and it is what we are measuring today.
| | The official U.S. government space weather bureau |
| | The first place to look for information about sundogs, pillars, rainbows and related phenomena. |
| | Researchers call it a "Hubble for the sun." SDO is the most advanced solar observatory ever. |
| | 3D views of the sun from NASA's Solar and Terrestrial Relations Observatory |
| | Realtime and archival images of the Sun from SOHO. |
| | from the NOAA Space Environment Center |
| | fun to read, but should be taken with a grain of salt! Forecasts looking ahead more than a few days are often wrong. |
| | from the NOAA Space Environment Center |
| | the underlying science of space weather |
 | Reviews here can help you to pick up best memory foam mattresses. |
| | These links help Spaceweather.com stay online. Thank you to our supporters! |
| | | | | | |


