We've Turned Starlink into a Planetary Barometer
Starlink has many downsides. The megaconstellation interferes with astronomy, pollutes the atmosphere with metallic re-entry debris, and has pushed Low Earth Orbit to the brink of the Kessler Syndrome.
On the other hand, it makes a terrific barometer.
Earth is absolutely surrounded by Starlink satellites. More than 11,000 of them are circling our planet right now. Without exception, they all skim the outermost layers of our atmosphere, and so they experience aerodynamic drag. Drag pulls them down, and they have to fight back with thrusters. This makes them ad hoc detectors of air pressure. Every day, we read those detectors and boil the result down to one number: the sink rate.
What the number means
The sink rate is the answer to a simple question. If a typical Starlink at 480 km switched off its thrusters today, how many meters of altitude would it lose in a day? A value of, say, 30 m/day means it would sink 30 meters. Why 480 km? Because that's where most Starlinks are.
The number changes every day in response to solar activity. In 2026 it has ranged from 19.7 m/day on Aug. 10th, the quietest air of the year, to 127.6 m/day on Jan. 20th, during the year's biggest geomagnetic storm. That's a factor of six. The satellites didn't change; the air did.
Here's a way to feel the numbers. At 40 m/day, a dead satellite at 480 km would take roughly four years to fall out of orbit. At the January storm rate it would come down in a little over one year. These are paces, not forecasts, because the air never stays the same for a year. But they show why space weather matters to anyone who owns a satellite.
Strictly speaking, drag measures the density of the air, not its pressure. We call it a barometer anyway. When the upper atmosphere heats up, pressure and density rise together, and "densitometer" is not a word anyone wants to read.
2026 so far
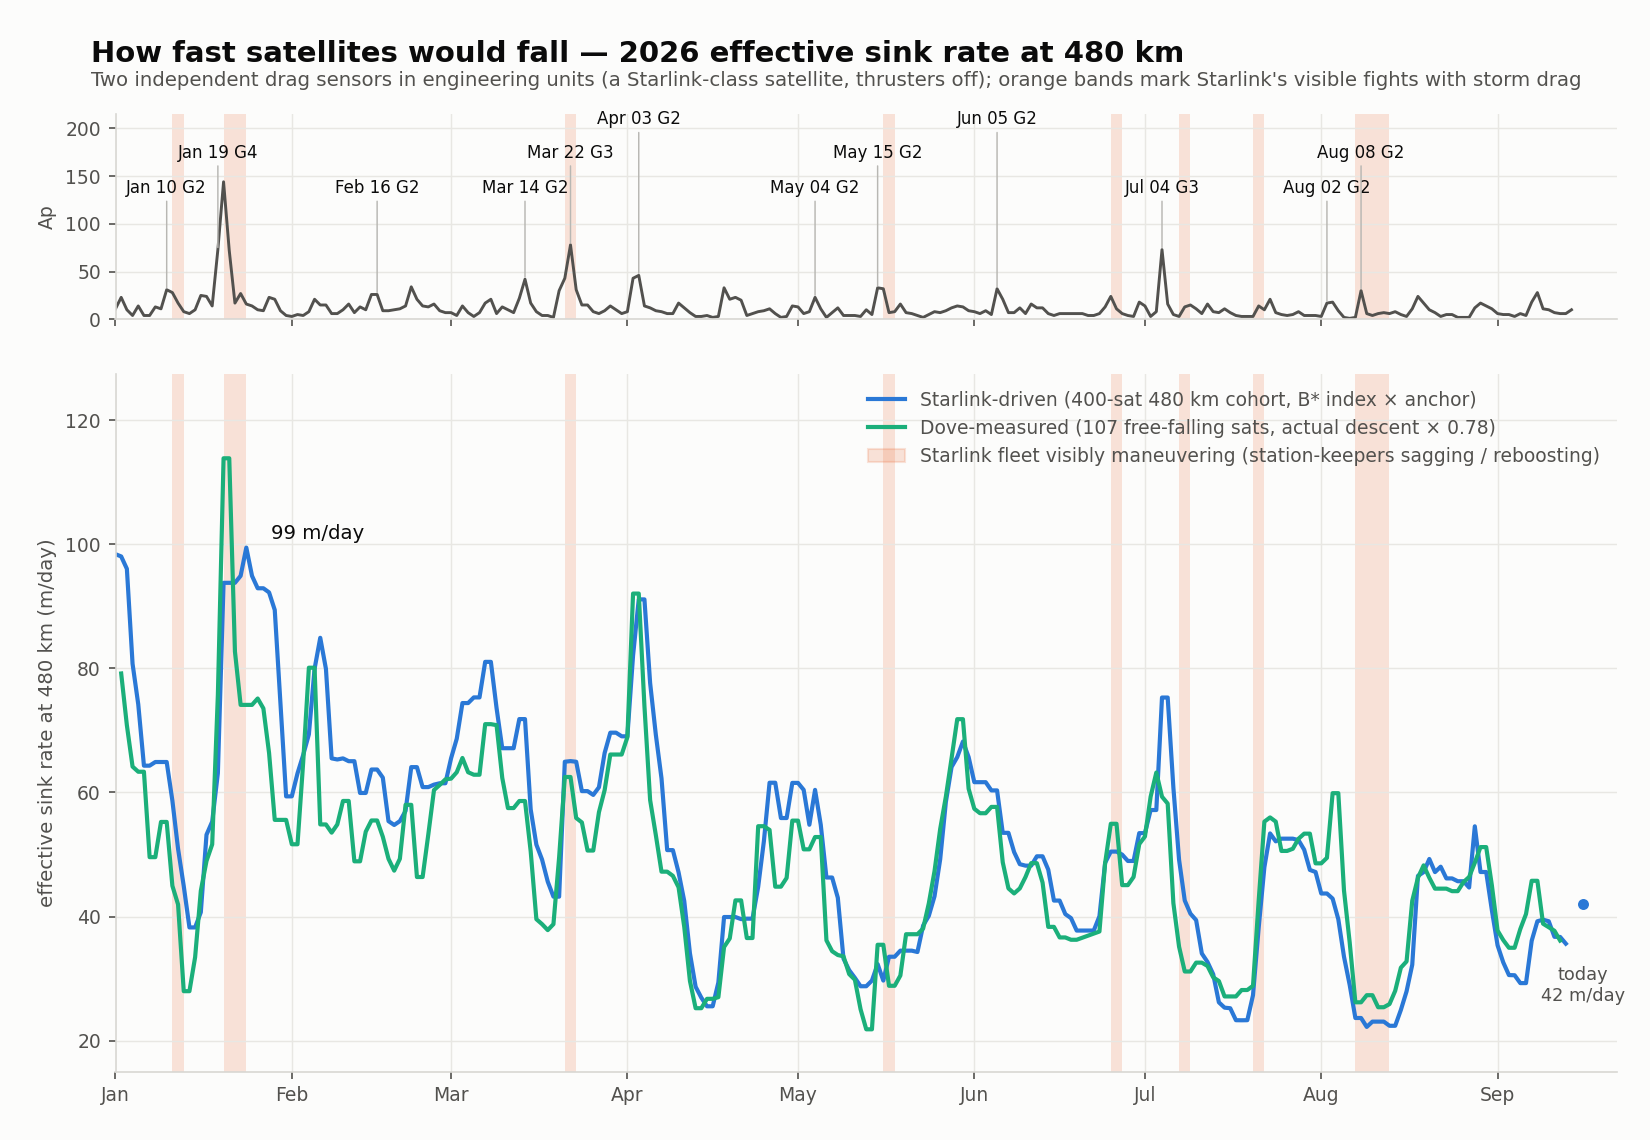
The year opened with a bang. On Jan. 19-21 a G4 geomagnetic storm (Kp 9-, Ap 144 on the 20th) heated the thermosphere and the sink rate jumped to 127.6 m/day, about five times the quiet-day floor. It took two weeks for the air to settle down. Smaller storms in March (G3 on the 22nd), April, May, June and July (G3 on the 4th) each produced a sharp spike. Storms weaker than about Ap 45 are buried in the background.
Then came summer. As Solar Cycle 25 continued its decline, the air thinned to the year's minimum on Aug. 10th. Starlinks were sinking only 19.7 meters a day.
Look closely at the orange bands. Each one marks a stretch of days when the Starlink fleet's median altitude sagged by more than 8 m/day or rebounded by more than 10 m/day. That's SpaceX fighting back. There were eight such episodes in 2026, and every one of them sits on or just after a spike in Ap. We didn't feed the storm calendar into the software. The maneuvers found it on their own.
How we do it
Monitoring is easy, because someone else does the hard part. Using radar, the US Space Force's 18th Space Defense Squadron tracks every object in orbit and, two or three times a day, publishes fresh orbital elements (also known as "TLEs") for each one. They are distributed through Space-Track and CelesTrak.
Buried in each TLE is a drag term, called B* ("B-star"). Here's the trick: the orbit model that reads a TLE assumes a fixed atmosphere. When the real atmosphere swells, the satellite slows down more than the model expects, and the fitted B* has to grow to keep the orbit matching the tracking. B* is where the air density ends up.
Any one satellite's B* is noisy. The fits are blurred over one to three days, and station-keeping burns corrupt them. So we never trust a single satellite. We follow a fixed sample of 1,000 Starlinks launched before 2026, and for each one we compare today's B* to that satellite's own quiet-air floor. Then we take the median across the whole cohort. The median of hundreds of satellites is the instrument. The noise of any one of them falls away.
That gives a ratio: how many times denser the air is today than on a quiet day. One calibration constant turns it into meters per day, and the Planet Labs Doves supplied it. In a quiet week of May 2026 their measured fall, scaled to 480 km, fixed the value at 35.7 m/day per unit of the index. Then came the check. During the January storm week, the Doves' actual decay rose 2.74-fold and the Starlink index rose 2.71-fold. Two independent methods agreed to one percent.
Every morning we fetch the newest TLEs, compute the day's value, and post it in the SATELLITE DRAG box on the home page. TLEs are typically a day old, so the number describes yesterday's air.
The three checks
Starlinks aren't the only ones we're tracking. We monitor three other independent constellations: Planet Labs' SuperDoves (107), Amazon's Kuiper satellites (391), and Eutelsat's OneWeb satellites (651). Each one answers a different question.
The SuperDoves, orbiting at 400-500 km, have no thrusters at all. They cannot fight the atmosphere, so they really do sink. Their measured descent is our ground truth. In 2026 a typical Dove has been losing about 62 meters a day; between Jan. 1st and late August, the median Dove fell 15.5 km. They are exquisitely sensitive.
Amazon's Kuiper satellites, at about 630 km, belong to a different company. Their maneuvers have nothing to do with SpaceX's. Anything the two fleets do in unison is the atmosphere, and they do a lot in unison: day to day, Kuiper and Starlink agree with a correlation of 0.94.
OneWeb orbits at 1,200 km, where the air is so thin that sunlight pressure matters more than drag. They are our null control, flat all year. Yet even OneWeb twitched during the January storm, rising 1.3-fold. The exosphere felt it too.
The atmosphere breathes
Using this new data stream, we can watch the atmosphere breathe. The envelope of air around our planet expands and contracts in response to solar activity. Solar ultraviolet heats the thermosphere, and the sink rate tracks the sun's 10.7 cm radio flux with a two-day lag: the upper atmosphere takes about two days to answer a change in the sun. Big geomagnetic storms puff up the atmosphere faster than that and cause sharp spikes in the sink rate.
Because our satellites fly at six different heights, we can watch the puff happen layer by layer. For the January storm, here is how much the drag rose at each altitude (storm days compared to the five quiet days before):
| Altitude | Constellation | Storm / quiet |
|---|---|---|
| 350 km | Starlink, low shell | 1.5× |
| 480 km | Starlink, main shell | 2.1× |
| 555 km | Starlink, high shell | 3.0× |
| 630 km | Amazon Kuiper | 2.0× |
| 1,200 km | OneWeb | 1.3× |
The response climbs with altitude to about 550 km, then turns over and is nearly gone by 1,200 km. Heated oxygen expands upward until it thins out into the exosphere. Textbooks predict the climb. The turnover is the kind of thing you only see with sensors at six heights.
Why it matters
The density of the thermosphere is the largest uncertainty in orbit prediction and collision avoidance. The standard atmosphere models err by 20-30% on ordinary days and by much more during storms. A measured daily number can calibrate them, day by day.
Research groups have used Starlink orbits before, most famously to dissect the February 2022 storm that killed 38 newly launched Starlinks at their 210 km insertion altitude. What's new here is a running, public, daily index with three independent constellations checking the answer. It's the sort of thing nobody publishes daily. Now somebody does.
No instrument was launched for this. The swarm itself is the sensor, read from public tracking data.
Caveats
The index is relative. It measures air density as a multiple of each satellite's quiet floor, converted to meters per day with one calibration constant. Absolute density still needs a model.
TLE fits blur over one to three days, so sharp events lag and smear a little.
SpaceX turns its satellites edge-on during storms to cut drag. Storm peaks read from Starlink are therefore lower bounds. The Doves, which cannot duck, are the check.
The measured record began Jan. 1, 2026. Scaling by solar flux, we estimate that solar-minimum air would give roughly 13 m/day, and quiet days at the 2024 solar maximum roughly 150. Those are estimates, not measurements.
Data
Daily series for 2026: drag_sink_2026.csv (date, meters per day). Full-size chart: effective_sink_2026.png.