 | | |  SPACE WEATHER
NOAA Forecasts | | Updated at: 2026 Jul 31 2200 UTC FLARE | 0-24 hr | 24-48 hr | CLASS M | 35 % | 35 % | CLASS X | 05 % | 05 % |  Geomagnetic Storms: Geomagnetic Storms:
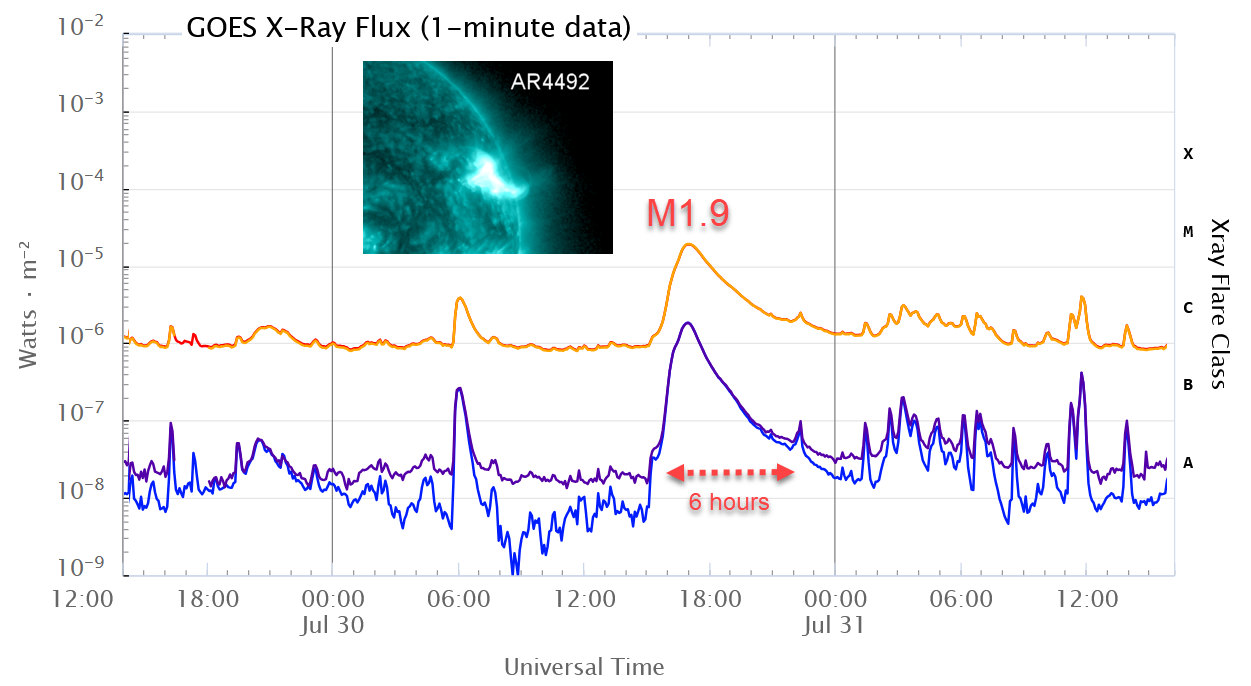
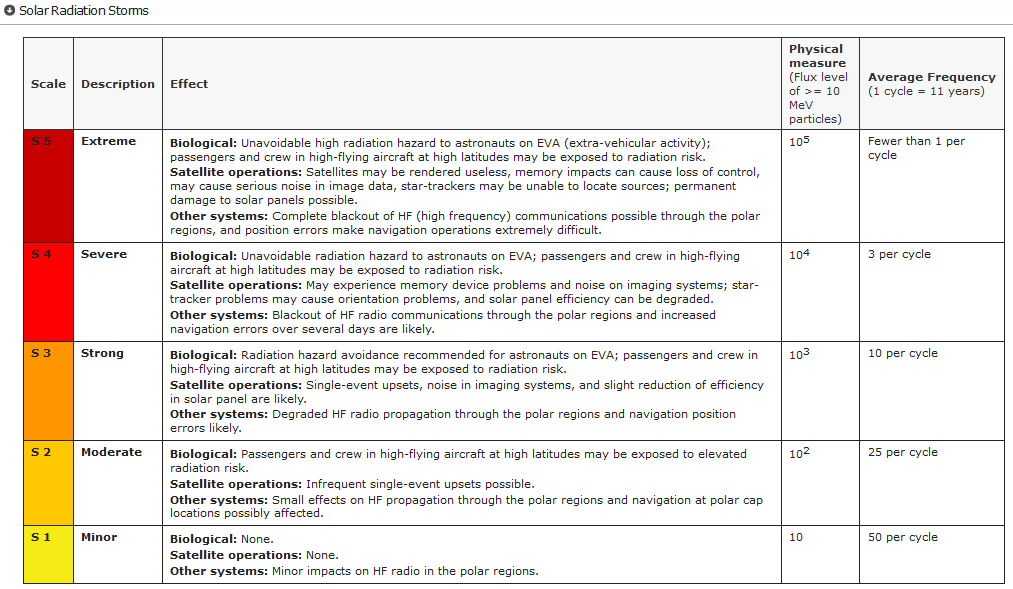
Probabilities for significant disturbances in Earth's magnetic field are given for three activity levels: active, minor storm, severe storm Updated at: 2026 Jul 31 2200 UTC Mid-latitudes | 0-24 hr | 24-48 hr | ACTIVE | 25 % | 30 % | MINOR | 05 % | 35 % | SEVERE | 01 % | 15 % | High latitudes | 0-24 hr | 24-48 hr | ACTIVE | 15 % | 10 % | MINOR | 20 % | 20 % | SEVERE | 20 % | 50 % | | | |  | | | | | | | | | | | This is an AI Free Zone: AI writing is everywhere -- except here. Spaceweather.com is written 100% by Dr. Tony Phillips, a carbon-based lifeform with 30 yrs of forecasting experience. If you find a mistake, rest assured it was made by a real human being. | | | PROTONS ARE RAINING DOWN ON EARTH: Yesterday's long-duration solar flare from sunspot 4492 accelerated a stream of energetic protons toward Earth. They are striking our atmosphere now. This is called a "solar radiation storm." Current storm levels are minor (S1-class), which means the protons pose no significant threat to astronauts or air travelers. However, the storm is causing a shortwave radio blackout inside the Arctic Circle. Solar flare alerts: SMS Text. A BIG CME JUST LEFT THE SUN: And it might hit Earth. NOAA's CCOR-1 coronagraph recorded the CME on July 30th: 
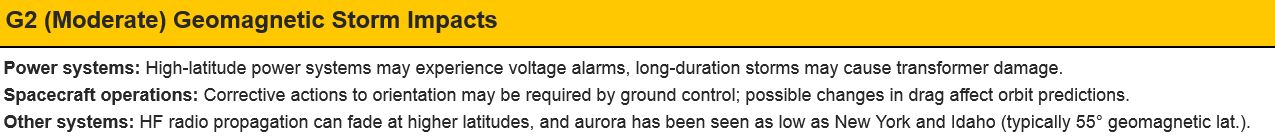
The CME was launched by an M1.9-class solar flare from sunspot 4492 (movie). Technically, the flare's peak was not very strong (only M1.9), but the explosion lasted for hours, long enough to lift a significant CME out of the sun's atmosphere. A NASA model suggests this CME will graze Earth on Aug. 2nd--and a new NOAA model agrees. The glancing blow could spark a G2-class geomagnetic storm with high-latitude auroras. CME impact alerts: SMS Text. Realtime Space Weather Photo Gallery
Free: Space Weather Newsletter ALPHA CAPRICORNID FIREBALLS: The alpha Capricornid meteor shower is underway. Last night in New York, Brian Mcdonough observed a classic alpha Cap fireball: 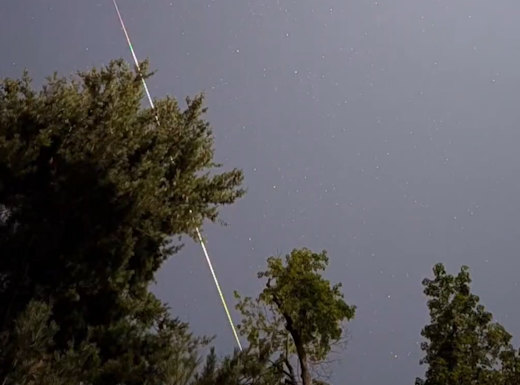
"The fireball splintered into a number of smaller pieces," says Mcdonough. "It took over 3 seconds to cross the sky and was brighter than Vega. One of the most amazing meteors I've ever seen." Although this shower produces only a handful of meteors per hour, many are fireballs. Look for them tonight between midnight and dawn. The alpha Capricornids peak on July 30-31. Realtime Alpha Capricornid Photo Gallery
Free: Space Weather Newsletter STERLING SILVER HANGING CAT: Are you looking for a far-out gift? Consider the Sterling Silver Hanging Cat Pendant. On July 22nd, the students of Earth to Sky Calculus launched it to the stratosphere onboard a cosmic ray research balloon: 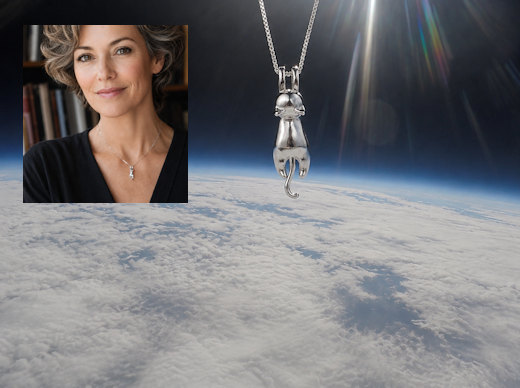
You can have it for $139.95. This feline astronaut is made of genuine sterling silver and hangs from a matching 18-inch sterling silver chain. It is a purrfect birthday, anniversary or belated graduation gift. The students are selling space pendants to pay the helium bill for their cosmic ray ballooning program. Each one comes with a greeting card showing the jewelry in flight and telling the story of its trip to the stratosphere and back again. Far Out Gifts: Earth to Sky Store
All sales support hands-on STEM education
Realtime Aurora Photo Gallery
Free: Spaceweather.com Newsletter
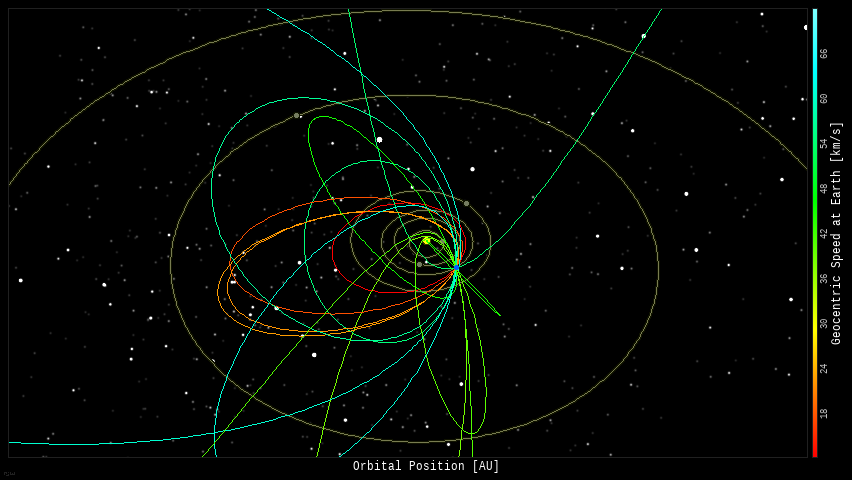
Every night, a network of NASA all-sky cameras scans the skies above the United States for meteoritic fireballs. Automated software maintained by NASA's Meteoroid Environment Office calculates their orbits, velocity, penetration depth in Earth's atmosphere and many other characteristics. Daily results are presented here on Spaceweather.com. On July 31, 2026, the network reported 21 fireballs.
(14 sporadics, 3 Perseids, 2 alpha Capricornids, 1 psi Cassiopeids, 1 Southern delta Aquariid) 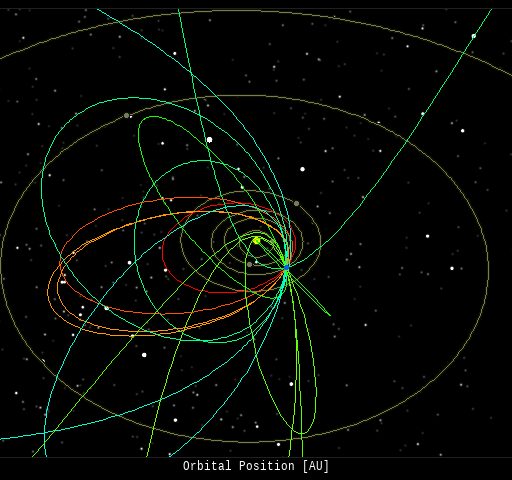 In this diagram of the inner solar system, all of the fireball orbits intersect at a single point--Earth. The orbits are color-coded by velocity, from slow (red) to fast (blue). [Larger image] [movies] Potentially Hazardous Asteroids ( PHAs) are space rocks larger than approximately 100m that can come closer to Earth than 0.05 AU. None of the known PHAs is on a collision course with our planet, although astronomers are finding new ones all the time. On July 31, 2026 there were 2349 potentially hazardous asteroids.
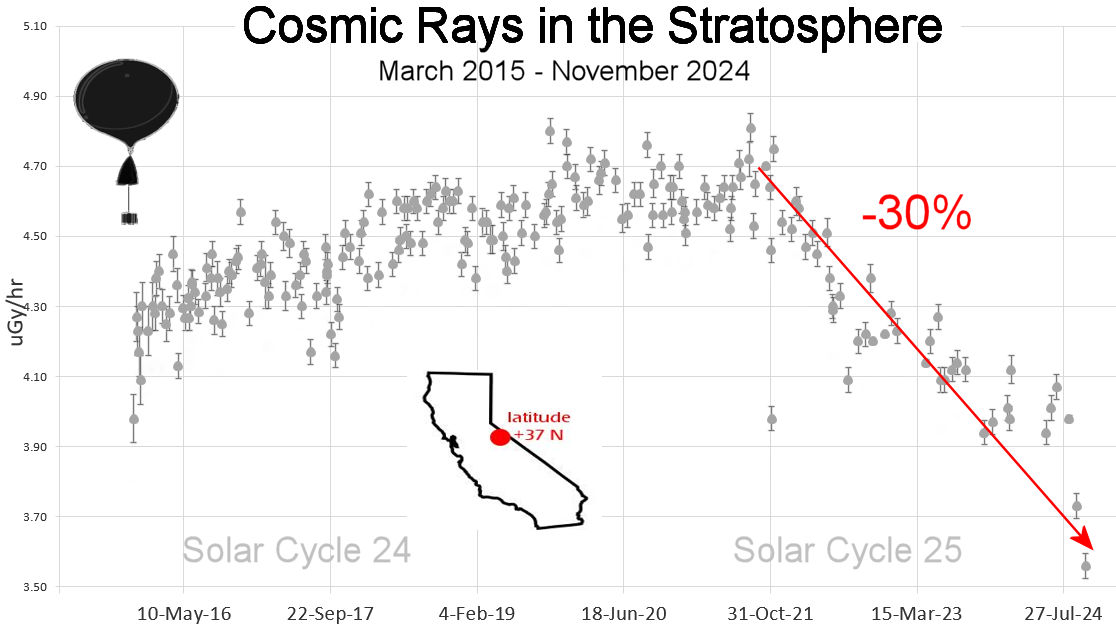
 | Recent & Upcoming Earth-asteroid encounters: | Asteroid | Date(UT) | Miss Distance | Velocity (km/s) | Diameter (m) | | 2015 BF | 2026-Jul-26 | 17.3 LD | 12.5 | 17 | | 2026 OA3 | 2026-Jul-27 | 4.9 LD | 5.2 | 23 | | 2026 OL | 2026-Jul-27 | 15.9 LD | 15.9 | 87 | | 2026 OX3 | 2026-Jul-27 | 0.7 LD | 9.5 | 14 | | 2026 OR | 2026-Jul-28 | 10.4 LD | 10.4 | 16 | | 2025 OW | 2026-Jul-30 | 16.1 LD | 20.1 | 70 | | 2026 OS | 2026-Aug-01 | 3.1 LD | 5.8 | 9 | | 2024 RM10 | 2026-Aug-05 | 13.6 LD | 7.5 | 24 | | 2026 OE1 | 2026-Aug-07 | 7.6 LD | 10.2 | 51 | | 173561 | 2026-Aug-09 | 13.1 LD | 16.2 | 756 | | 2019 NY2 | 2026-Aug-10 | 6.6 LD | 9.6 | 195 | | 2013 QC11 | 2026-Aug-13 | 14.5 LD | 19 | 172 | | 2026 NY | 2026-Aug-13 | 12.3 LD | 8.1 | 101 | | 2025 AL2 | 2026-Aug-16 | 2.2 LD | 12.4 | 100 | | 2025 DU7 | 2026-Aug-19 | 8.7 LD | 2.9 | 5 | | 2025 FY11 | 2026-Aug-20 | 19.2 LD | 3.5 | 6 | | 2023 RL | 2026-Aug-25 | 12.9 LD | 4.8 | 7 | | 523609 | 2026-Aug-27 | 18.5 LD | 22.7 | 441 | | 2025 QM9 | 2026-Aug-28 | 15.2 LD | 11.1 | 20 | | 221455 | 2026-Aug-28 | 9.4 LD | 19 | 443 | | 2017 BP31 | 2026-Aug-28 | 11.2 LD | 20.5 | 382 | | 2007 EK | 2026-Aug-30 | 10.9 LD | 9.1 | 5 | | 2017 RH16 | 2026-Aug-31 | 8.7 LD | 12.1 | 21 | | 2025 CL3 | 2026-Sep-01 | 9.6 LD | 13.5 | 30 | | 2018 RD2 | 2026-Sep-01 | 19.5 LD | 9.6 | 14 | | 2025 QV5 | 2026-Sep-02 | 14.2 LD | 7.3 | 12 | | 2020 YA5 | 2026-Sep-06 | 19.5 LD | 10.4 | 47 | | 2022 RK | 2026-Sep-06 | 13.7 LD | 8.6 | 24 | | 2024 RV12 | 2026-Sep-09 | 5.6 LD | 12.1 | 22 | | 2026 OH3 | 2026-Sep-11 | 12.4 LD | 20.2 | 198 | | 2025 RQ2 | 2026-Sep-11 | 17.5 LD | 12.1 | 17 | | 2010 FX9 | 2026-Sep-14 | 9.4 LD | 11.1 | 55 | | 2025 SC | 2026-Sep-14 | 19.2 LD | 1.9 | 3 | | 2024 RP12 | 2026-Sep-16 | 17.9 LD | 6.6 | 51 | | 2026 NT2 | 2026-Sep-17 | 16.1 LD | 12.5 | 279 | Notes: LD means "Lunar Distance." 1 LD = 384,401 km, the distance between Earth and the Moon. 1 LD also equals 0.00256 AU. | | Cosmic Rays in the Atmosphere | SPACE WEATHER BALLOON DATA: Almost once a week, Spaceweather.com and the students of Earth to Sky Calculus fly space weather balloons to the stratosphere over California. These balloons are equipped with sensors that detect secondary cosmic rays, a form of radiation from space that can penetrate all the way down to Earth's surface. Our monitoring program has been underway without interruption for 10 years, resulting in a unique dataset of in situ atmospheric measurements. Latest results (Nov. 2024): Atmospheric radiation is sharply decreasing in 2024. Our latest measurements in November registered a 10-year low: 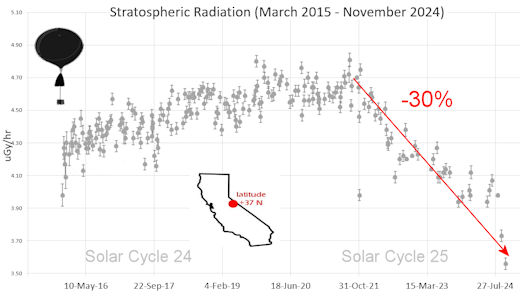
What's going on? Ironically, the radiation drop is caused by increasing solar activity. Solar Cycle 25 has roared to life faster than forecasters expected. The sun's strengthening and increasingly tangled magnetic field repels cosmic rays from deep space. In addition, solar coronal mass ejections (CMEs) sweep aside cosmic rays, causing sharp reductions called "Forbush Decreases." The two effects blend together to bring daily radiation levels down. .Who cares? Cosmic rays are a surprisingly "down to Earth" form of space weather. They can alter the chemistry of the atmosphere, trigger lightning, and penetrate commercial airplanes. According to a study from the Harvard T.H. Chan school of public health, crews of aircraft have higher rates of cancer than the general population. The researchers listed cosmic rays, irregular sleep habits, and chemical contaminants as leading risk factors. A number of controversial studies (#1, #2, #3, #4) go even further, linking cosmic rays with cardiac arrhythmias and sudden cardiac death. Technical notes: The radiation sensors onboard our helium balloons detect X-rays and gamma-rays in the energy range 10 keV to 20 MeV. These energies span the range of medical X-ray machines and airport security scanners. Data points in the graph labeled "Stratospheric Radiation" correspond to the peak of the Regener-Pfotzer maximum, which lies about 67,000 feet above central California. When cosmic rays crash into Earth's atmosphere, they produce a spray of secondary particles that is most intense at the entrance to the stratosphere. Physicists Eric Regener and Georg Pfotzer discovered the maximum using balloons in the 1930s and it is what we are measuring today. | | The official U.S. government space weather bureau | | | The first place to look for information about sundogs, pillars, rainbows and related phenomena. | | | Researchers call it a "Hubble for the sun." SDO is the most advanced solar observatory ever. | | | 3D views of the sun from NASA's Solar and Terrestrial Relations Observatory | | | Realtime and archival images of the Sun from SOHO. | | | information about sunspots based on the latest NOAA/USAF Active Region Summary | | | current counts of failed and deployed Starlink satellites from Jonathan's Space Page. See also, all satellite statistics. | | | Authoritative predictions of space junk and satellite re-entries | | | from the NOAA Space Environment Center | | | fun to read, but should be taken with a grain of salt! Forecasts looking ahead more than a few days are often wrong. | | | from the NOAA Space Environment Center | | | the underlying science of space weather |  | Got a chipped or cracked windshield that prevents you from seeing space weather events while driving? Get windshield replacement from SR Windows & Glass with free mobile auto glass service anywhere in the Phoenix area. | | | These links help Spaceweather.com stay online. Thank you to our supporters! | | | | | | | | |  | | |  | ©2021 Spaceweather.com. All rights reserved. This site is penned daily by Dr. Tony Phillips. |


