 | | |  Solar wind Solar wind
speed: 427.3 km/sec
density: 6.6 protons/cm3
explanation | more data
Updated: Today at 2347 UT X-ray Solar Flares
6-hr max: A7 1933 UT Nov06
24-hr: A7 1933 UT Nov06
explanation | more data
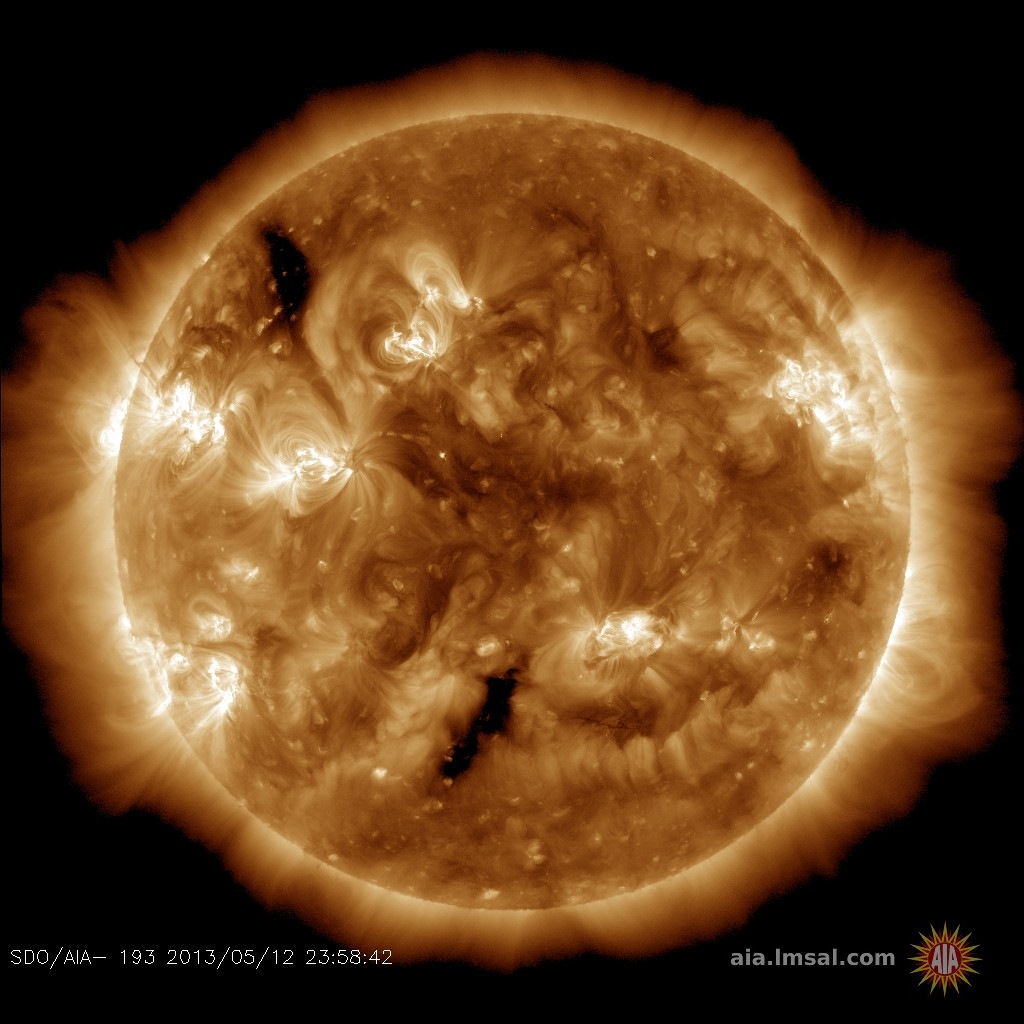
Updated: Today at: 2300 UT  Daily Sun: 06 Nov 19 Daily Sun: 06 Nov 19 The sun is blank--no sunspots. Credit: SDO/HMI The sun is blank--no sunspots. Credit: SDO/HMI
 Sunspot number: 0
What is the sunspot number?
Updated 06 Nov 2019
Spotless Days
Current Stretch: 3 days
2019 total: 231 days (75%)
2018 total: 221 days (61%)
2017 total: 104 days (28%)
2016 total: 32 days (9%)
2015 total: 0 days (0%)
2014 total: 1 day (<1%)
2013 total: 0 days (0%)
2012 total: 0 days (0%)
2011 total: 2 days (<1%)
2010 total: 51 days (14%)
2009 total: 260 days (71%)
2008 total: 268 days (73%)
2007 total: 152 days (42%)
2006 total: 70 days (19%)
Updated 06 Nov 2019
Thermosphere Climate Index
today: 4.09x10¹⁰ W Cold
Max: 49.4x10¹⁰ W Hot (10/1957)
Min: 2.05x10¹⁰ W Cold (02/2009)
explanation | more data: gfx, txt
Updated 06 Nov 2019 The Radio Sun
10.7 cm flux: 70 sfu
explanation | more data
Updated 06 Nov 2019 Cosmic Rays Solar minimum is underway. The sun's magnetic field is weak, allowing extra cosmic rays into the solar system. Neutron counts from the University of Oulu's Sodankyla Geophysical Observatory show that cosmic rays reaching Earth in 2019 are near a Space Age peak.
Oulu Neutron Counts
Percentages of the Space Age average:
today: +9.6% High
7-day change: +0.2%
Max: +11.7% Very High (12/2009)
Min: -32.1% Very Low (06/1991)
explanation | more data
Updated 06 Nov 2019 @ 1700 UT 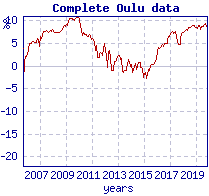
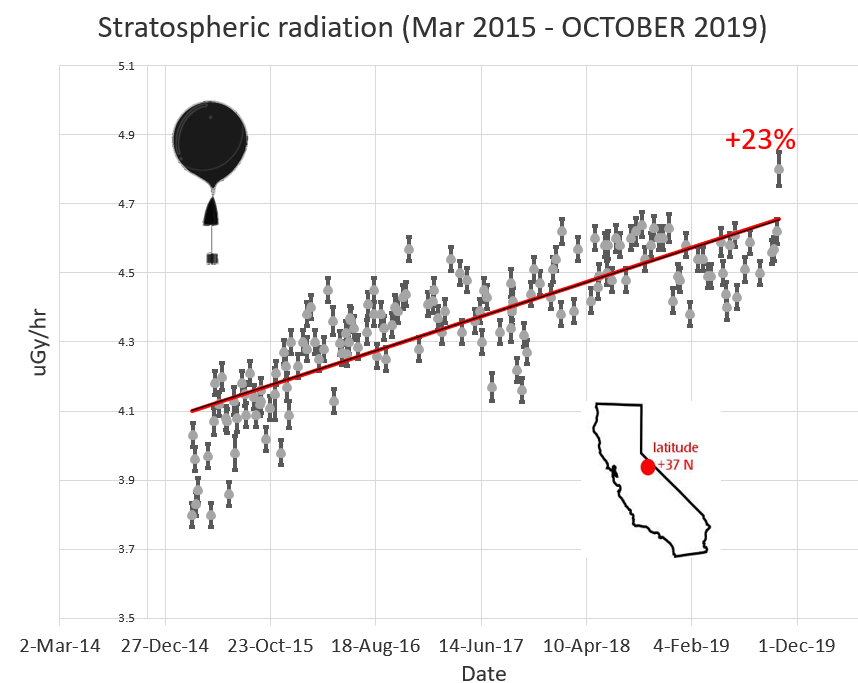
Since 2015, Earth to Sky cosmic ray balloons launched weekly from California have also detected significant increases in atmospheric radiation. Dose rates reported below are in the stratosphere at approx. 100,000 ft.
California Cosmic Ray Balloons
Monitoring started in March 2015
now: 4.64 uGy/hr High
change since 2015: +19%
Max: 4.79 uGy/hr High (10/2019)
Min: 3.80 uGy/hr Low (05/2015)
explanation | more data
Updated 19 Oct 2019 @ 0400 UT Current Auroral Oval: Switch to: Europe, USA, New Zealand, Antarctica Credit: NOAA/Ovation Planetary K-index
Now: Kp= 1 quiet
24-hr max: Kp= 2 quiet
explanation | more data
Interplanetary Mag. Field
Btotal: 2.6 nT
Bz: -1.9 nT south
more data: ACE, DSCOVR
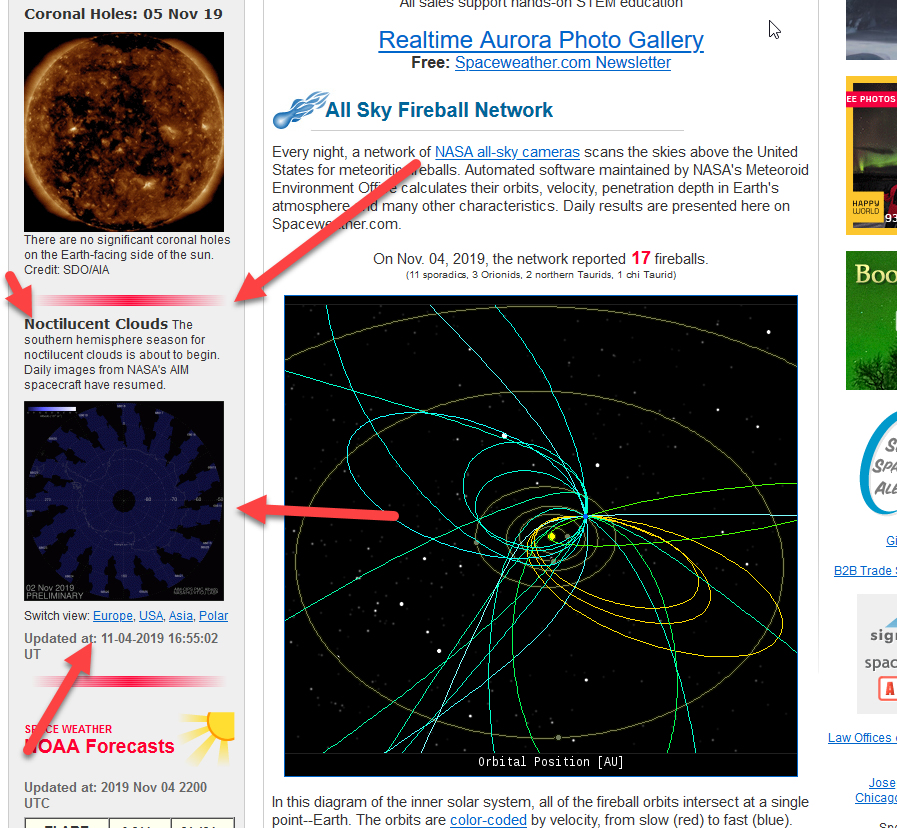
Updated: Today at 2346 UT Coronal Holes: 05 Nov 19 
There are no significant coronal holes on the Earth-facing side of the sun. Credit: SDO/AIA Noctilucent Clouds The southern hemisphere season for noctilucent clouds is about to begin. Daily images from NASA's AIM spacecraft have resumed. Switch view: Europe, USA, Asia, Polar Updated at: 11-06-2019 14:55:07 UT SPACE WEATHER
NOAA Forecasts | | Updated at: 2019 Nov 06 2200 UTC FLARE | 0-24 hr | 24-48 hr | CLASS M | 01 % | 01 % | CLASS X | 01 % | 01 % | Geomagnetic Storms:
Probabilities for significant disturbances in Earth's magnetic field are given for three activity levels: active, minor storm, severe storm Updated at: 2019 Nov 06 2200 UTC Mid-latitudes | 0-24 hr | 24-48 hr | ACTIVE | 20 % | 10 % | MINOR | 05 % | 01 % | SEVERE | 01 % | 01 % | High latitudes | 0-24 hr | 24-48 hr | ACTIVE | 15 % | 15 % | MINOR | 25 % | 15 % | SEVERE | 25 % | 10 % | | | |  | | | | | | | | | | | Marianne’s Arctic tours: Operating in small groups of 7 to 14 persons--all needs supplied for safety, comfort and pleasure. Night & day photography or non-photographic landscape - wildlife tours. Click for details! | | | NOCTILUCENT CLOUDS AROUND THE SOUTH POLE: NASA's AIM spacecraft is monitoring the atmosphere above Antarctica. High-altitude weather patterns there are beginning to favor the formation of noctilucent clouds. The electric-blue clouds have not yet appeared, but they could be just days away. Monitor the latest satellite images right here on Spaceweather.com. Aurora Alerts: SMS Text. PULSATING AURORAS: Living inside the Arctic Circle for a complete 11-year solar cycle, Chad Blakely of Abisko, Sweden, has seen every kind of aurora the sun has to offer. Just before daybreak, on Monday, Nov. 5th, he spotted his favorite: The pulsating aurora. "It wasn't very bright--but it was absolutely amazing," says Blakley. This still image captures one of the pulses: 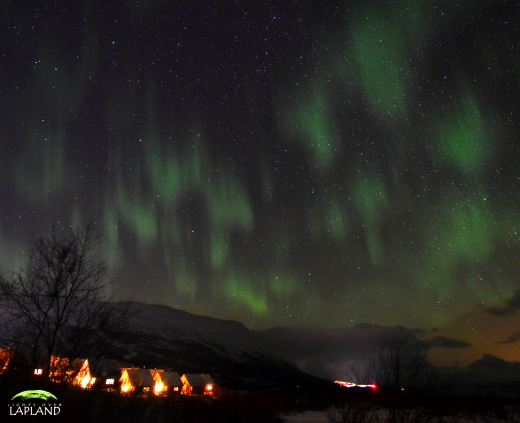
"The best way to describe a pulsating aurora is to imagine the sky as a large checker board," says Blakley. "As the pulsating begins, the black squares on the board would illuminate as a green aurora. Then, in an instant, all the black squares lose their illumination and the red squares on the imaginary checkerboard immediately glow green. I remember seeing lots of these pulsating auroras at the bottom of the last Solar Minimum, and I was always fascinated by the phenomenon," he says.
Pulsating auroras are nothing new. Arctic people have been watching them for hundreds of years. But researchers have only recently figured out what causes them. In the Feb. 14, 2018, issue of Nature, a team led by S. Kasahara of the University of Tokyo conclusively linked pulsating auroras to "chorus waves" in Earth's magnetic field. Chorus waves are electromagnetic oscillations that sound heavenly when played through the loudspeaker of a low frequency radio. Using ground-based cameras and NASA spacecraft, Kasahara's team showed that chorus waves can modulate electrons raining down from space onto Earth's upper atmosphere, causing auroras to blink, pulse and strobe. "It is one of nature’s greatest light shows," says Blakley, and he should know.
Realtime Aurora Photo Gallery
Free: Spaceweather.com Newslette
THE STRATOSPHERIC CLOUD PENDANT: The most beautiful clouds on Earth are located in the stratosphere: Polar Stratospheric Clouds. Their extraordinary colors inspired this authentic Swarovski pendant--and it has been to the stratosphere! On Nov. 2, 2019, it hitched a ride 109,580 feet high on board an Earth to Sky Calculus cosmic ray balloon:
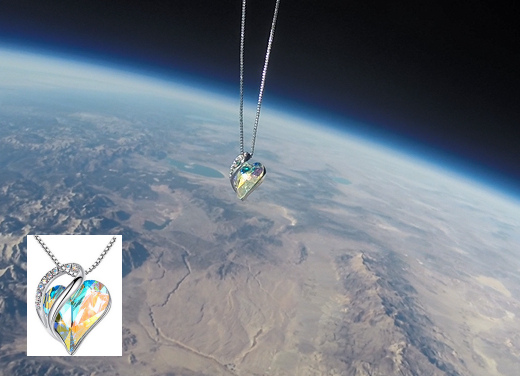
You can have it for $159.95. The students are selling Stratospheric Cloud Pendants to support their cosmic ray ballooning program. Each heart-shaped pendant comes with a card showing it floating through the stratosphere like a real cloud, and telling the story of its journey to the edge of space and back again. Far Out Gifts: Earth to Sky Store
All sales support hands-on STEM education TAURID FIREBALLS: This week, Earth is passing through a stream of debris from Comet Encke, source of the annual Taurid meteor shower. Gravel-sized meteoroids are hitting Earth's upper atmosphere at 65,000 mph, creating a slow drizzle of fireballs emerging from the constellation Taurus. Yuichi Takasaka saw one on Nov. 5th over Silver Star Mountain in Vernon, British Columbia: 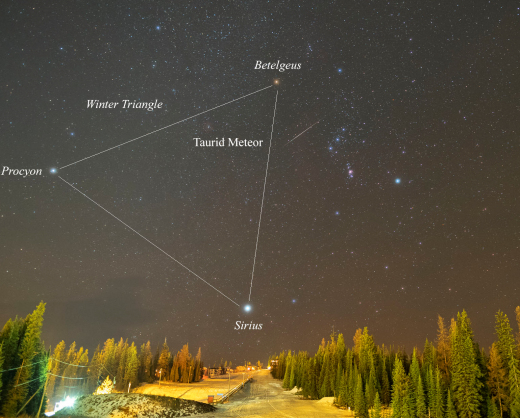
"We saw not only meteors, but also smokey wisps of debris that swirled in the atmosphere for as much as 10 minutes," says Takasaka. Taurids are also called "the Halloween fireballs" because they are most often noticed by crowds outdoors after dark on Halloween. In fact, they may be seen on any night from mid-October to mid-November. The best time to look is during hours around midnight when Taurus is high in the sky. Typical meteor rates are no more than a few per hour, but sometimes just one fireball is enough...
rRealtime Spaceweather Photo Gallery
Free: Spaceweather.com Newsletter
Every night, a network of NASA all-sky cameras scans the skies above the United States for meteoritic fireballs. Automated software maintained by NASA's Meteoroid Environment Office calculates their orbits, velocity, penetration depth in Earth's atmosphere and many other characteristics. Daily results are presented here on Spaceweather.com. On Nov. 06, 2019, the network reported 44 fireballs.
(41 sporadics, 3 northern Taurids)  In this diagram of the inner solar system, all of the fireball orbits intersect at a single point--Earth. The orbits are color-coded by velocity, from slow (red) to fast (blue). [Larger image] [movies] Potentially Hazardous Asteroids ( PHAs) are space rocks larger than approximately 100m that can come closer to Earth than 0.05 AU. None of the known PHAs is on a collision course with our planet, although astronomers are finding new ones all the time. On November 6, 2019 there were 2018 potentially hazardous asteroids.
 | Recent & Upcoming Earth-asteroid encounters: | Asteroid | Date(UT) | Miss Distance | Velocity (km/s) | Diameter (m) | | 2019 VH2 | 2019-Nov-01 | 2.8 LD | 10.9 | 6 | | 2019 VC | 2019-Nov-01 | 2.4 LD | 4.1 | 6 | | 2019 UG12 | 2019-Nov-01 | 4 LD | 11.9 | 20 | | 2019 UP7 | 2019-Nov-01 | 15.5 LD | 9.4 | 25 | | 2019 UM4 | 2019-Nov-01 | 11.1 LD | 9.2 | 20 | | 2019 UD13 | 2019-Nov-01 | 15.3 LD | 23.2 | 72 | | 2019 UG11 | 2019-Nov-01 | 0.5 LD | 10.1 | 17 | | 2019 UR12 | 2019-Nov-02 | 9.8 LD | 6.7 | 45 | | 2019 VV | 2019-Nov-02 | 6.3 LD | 8.7 | 31 | | 2019 VW | 2019-Nov-02 | 5.6 LD | 4 | 16 | | 2019 VA | 2019-Nov-02 | 0.3 LD | 8.6 | 8 | | 2019 UU3 | 2019-Nov-02 | 13.3 LD | 13.9 | 30 | | 2015 JD1 | 2019-Nov-03 | 12.9 LD | 11.9 | 269 | | 2019 VM2 | 2019-Nov-03 | 3.6 LD | 15.1 | 14 | | 2019 UL8 | 2019-Nov-03 | 2.8 LD | 12.8 | 19 | | 2019 UH3 | 2019-Nov-03 | 10.4 LD | 8.5 | 25 | | 2019 VD | 2019-Nov-04 | 0.5 LD | 12 | 12 | | 2019 VR | 2019-Nov-04 | 0.4 LD | 9.6 | 9 | | 2019 UH5 | 2019-Nov-05 | 13.3 LD | 3.5 | 12 | | 2019 VU | 2019-Nov-05 | 2.7 LD | 15.3 | 12 | | 2019 UE13 | 2019-Nov-06 | 8.3 LD | 8.9 | 26 | | 2019 UM13 | 2019-Nov-06 | 11.5 LD | 5.9 | 17 | | 2019 VR1 | 2019-Nov-06 | 2.9 LD | 9.3 | 14 | | 2019 UL4 | 2019-Nov-07 | 16.7 LD | 9 | 30 | | 2019 UO7 | 2019-Nov-07 | 3.8 LD | 4.1 | 10 | | 2019 VM1 | 2019-Nov-08 | 11.3 LD | 6.1 | 19 | | 2019 UM12 | 2019-Nov-08 | 1.3 LD | 13.6 | 43 | | 2019 UR4 | 2019-Nov-08 | 7.3 LD | 4.5 | 15 | | 2019 VE2 | 2019-Nov-09 | 7.1 LD | 5 | 12 | | 2019 UB7 | 2019-Nov-10 | 13.7 LD | 17.5 | 56 | | 2019 VN | 2019-Nov-11 | 3.1 LD | 13.6 | 32 | | 2019 VW1 | 2019-Nov-12 | 15.3 LD | 8.5 | 26 | | 2019 VN2 | 2019-Nov-12 | 16 LD | 3.8 | 14 | | 2010 JG | 2019-Nov-12 | 19.6 LD | 14.9 | 235 | | 2019 UB14 | 2019-Nov-12 | 4.9 LD | 15.4 | 22 | | 2019 UH1 | 2019-Nov-13 | 9.5 LD | 9.1 | 51 | | 2019 UN12 | 2019-Nov-13 | 3.8 LD | 28.8 | 145 | | 2019 VX | 2019-Nov-13 | 4.1 LD | 10.8 | 31 | | 2019 UE8 | 2019-Nov-15 | 7.7 LD | 6.6 | 26 | | 2019 UR2 | 2019-Nov-18 | 18 LD | 13.4 | 126 | | 2019 UK6 | 2019-Nov-20 | 15.4 LD | 7.7 | 63 | | 481394 | 2019-Nov-21 | 11.3 LD | 7.9 | 372 | | 2019 VK | 2019-Nov-21 | 5.8 LD | 7.6 | 42 | | 2008 EA9 | 2019-Nov-23 | 10.5 LD | 2.2 | 10 | | 2019 VF1 | 2019-Nov-25 | 13.4 LD | 17.3 | 89 | | 2017 AP4 | 2019-Dec-03 | 8.5 LD | 7.5 | 15 | | 2018 XW2 | 2019-Dec-07 | 17.4 LD | 13 | 28 | | 216258 | 2019-Dec-20 | 15.3 LD | 11.8 | 324 | | 2013 XY20 | 2019-Dec-21 | 18.4 LD | 1.9 | 28 | | 2017 XQ60 | 2019-Dec-22 | 11 LD | 15.6 | 47 | | 310442 | 2019-Dec-26 | 19 LD | 12.3 | 372 | | 2019 AE3 | 2020-Jan-02 | 4.9 LD | 8.2 | 13 | Notes: LD means "Lunar Distance." 1 LD = 384,401 km, the distance between Earth and the Moon. 1 LD also equals 0.00256 AU. MAG is the visual magnitude of the asteroid on the date of closest approach. | | Cosmic Rays in the Atmosphere | SOMETHING NEW! We have developed a new predictive model of aviation radiation. It's called E-RAD--short for Empirical RADiation model. We are constantly flying radiation sensors onboard airplanes over the US and and around the world, so far collecting more than 22,000 gps-tagged radiation measurements. Using this unique dataset, we can predict the dosage on any flight over the USA with an error no worse than 15%. E-RAD lets us do something new: Every day we monitor approximately 1400 flights criss-crossing the 10 busiest routes in the continental USA. Typically, this includes more than 80,000 passengers per day. E-RAD calculates the radiation exposure for every single flight. The Hot Flights Table is a daily summary of these calculations. It shows the 5 charter flights with the highest dose rates; the 5 commercial flights with the highest dose rates; 5 commercial flights with near-average dose rates; and the 5 commercial flights with the lowest dose rates. Passengers typically experience dose rates that are 20 to 70 times higher than natural radiation at sea level. To measure radiation on airplanes, we use the same sensors we fly to the stratosphere onboard Earth to Sky Calculus cosmic ray balloons: neutron bubble chambers and X-ray/gamma-ray Geiger tubes sensitive to energies between 10 keV and 20 MeV. These energies span the range of medical X-ray machines and airport security scanners. Column definitions: (1) The flight number; (2) The maximum dose rate during the flight, expressed in units of natural radiation at sea level; (3) The maximum altitude of the plane in feet above sea level; (4) Departure city; (5) Arrival city; (6) Duration of the flight. SPACE WEATHER BALLOON DATA: Approximately once a week, Spaceweather.com and the students of Earth to Sky Calculus fly space weather balloons to the stratosphere over California. These balloons are equipped with radiation sensors that detect cosmic rays, a surprisingly "down to Earth" form of space weather. Cosmic rays can seed clouds, trigger lightning, and penetrate commercial airplanes. Furthermore, there are studies ( #1, #2, #3, #4) linking cosmic rays with cardiac arrhythmias and sudden cardiac death in the general population. Our latest measurements show that cosmic rays are intensifying, with an increase of more than 18% since 2015: 
The data points in the graph above correspond to the peak of the Reneger-Pfotzer maximum, which lies about 67,000 feet above central California. When cosmic rays crash into Earth's atmosphere, they produce a spray of secondary particles that is most intense at the entrance to the stratosphere. Physicists Eric Reneger and Georg Pfotzer discovered the maximum using balloons in the 1930s and it is what we are measuring today. En route to the stratosphere, our sensors also pass through aviation altitudes: 
In this plot, dose rates are expessed as multiples of sea level. For instance, we see that boarding a plane that flies at 25,000 feet exposes passengers to dose rates ~10x higher than sea level. At 40,000 feet, the multiplier is closer to 50x. The radiation sensors onboard our helium balloons detect X-rays and gamma-rays in the energy range 10 keV to 20 MeV. These energies span the range of medical X-ray machines and airport security scanners. Why are cosmic rays intensifying? The main reason is the sun. Solar storm clouds such as coronal mass ejections (CMEs) sweep aside cosmic rays when they pass by Earth. During Solar Maximum, CMEs are abundant and cosmic rays are held at bay. Now, however, the solar cycle is swinging toward Solar Minimum, allowing cosmic rays to return. Another reason could be the weakening of Earth's magnetic field, which helps protect us from deep-space radiation. | | The official U.S. government space weather bureau | | | The first place to look for information about sundogs, pillars, rainbows and related phenomena. | | | Researchers call it a "Hubble for the sun." SDO is the most advanced solar observatory ever. | | | 3D views of the sun from NASA's Solar and Terrestrial Relations Observatory | | | Realtime and archival images of the Sun from SOHO. | | | from the NOAA Space Environment Center | | | fun to read, but should be taken with a grain of salt! Forecasts looking ahead more than a few days are often wrong. | | | from the NOAA Space Environment Center | | | the underlying science of space weather |  | To find reviews of new online casino sites in the UK try The Casino DB where there are hundreds of online casino reviews complete with bonuses and ratings. Get a bonus when playing at a new casino in the UK. The Genie got you covered! Looking for a new online casino? Try Casimpo the new site dedicated to making online casino simple and easy for all. | | | These links help Spaceweather.com stay online. Thank you to our supporters! | | | | | | | | |  | | |  | ©2019 Spaceweather.com. All rights reserved. This site is penned daily by Dr. Tony Phillips. | |


