Spotless Days Current Stretch: 12 days 2018 total: 40 days (54%) 2017 total: 104 days (28%) 2016 total: 32 days (9%) 2015 total: 0 days (0%) 2014 total: 1 day (<1%) 2013 total: 0 days (0%) 2012 total: 0 days (0%) 2011 total: 2 days (<1%) 2010 total: 51 days (14%) 2009 total: 260 days (71%) Updated 15 Mar 2018
Planetary K-index Now: Kp= 3 quiet 24-hr max: Kp= 4 unsettled explanation | more data
Interplanetary Mag. Field Btotal: 5.2 nT Bz: 1.3 nT north more data: ACE, DSCOVR Updated: Today at 2355 UT
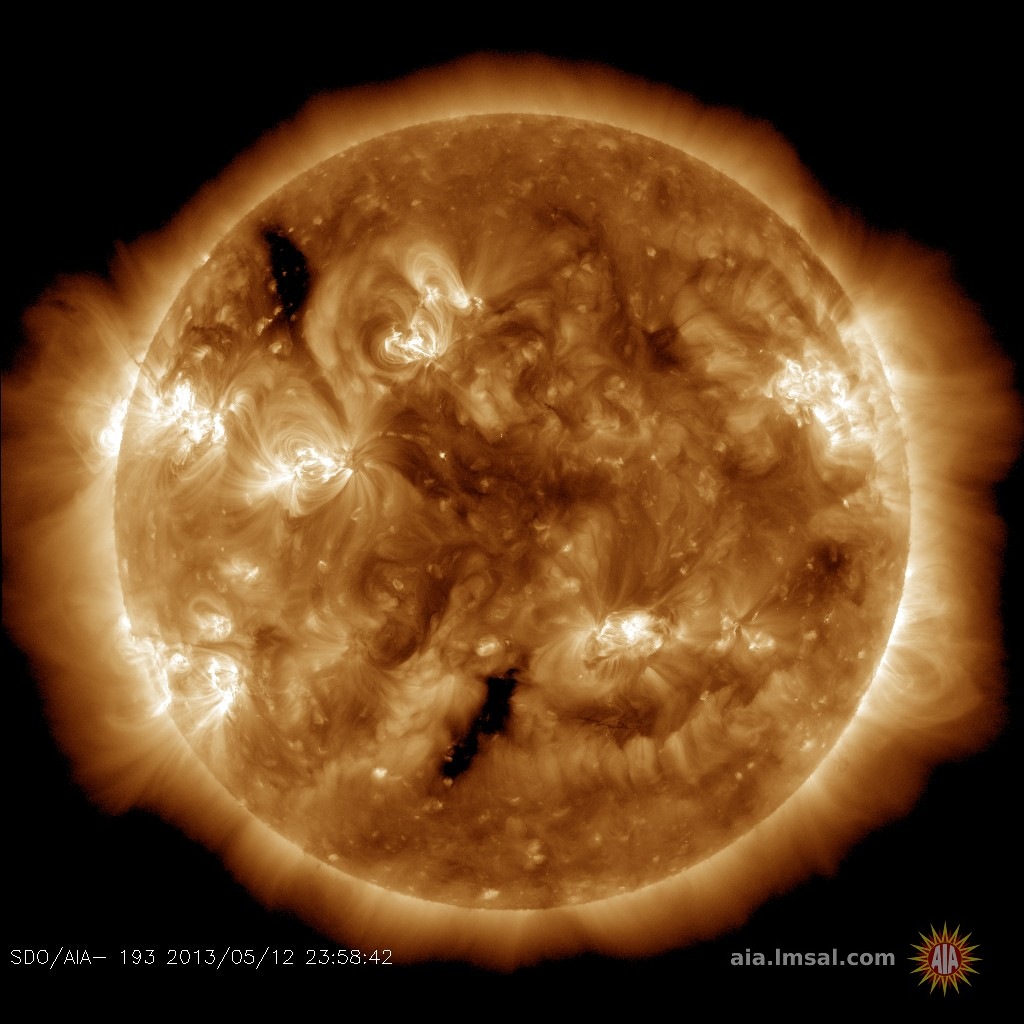
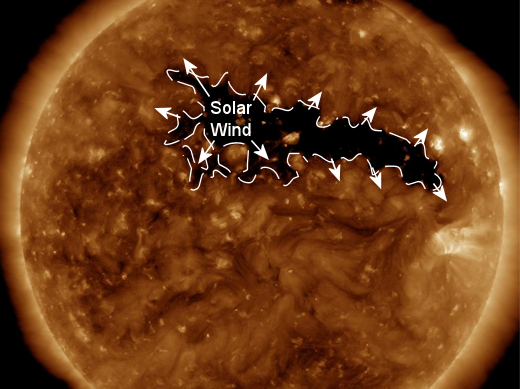
Coronal Holes: 15 Mar 18
Solar wind flowing from this wide coronal hole should reach Earth on March 15-16. Credit: SDO/AIA
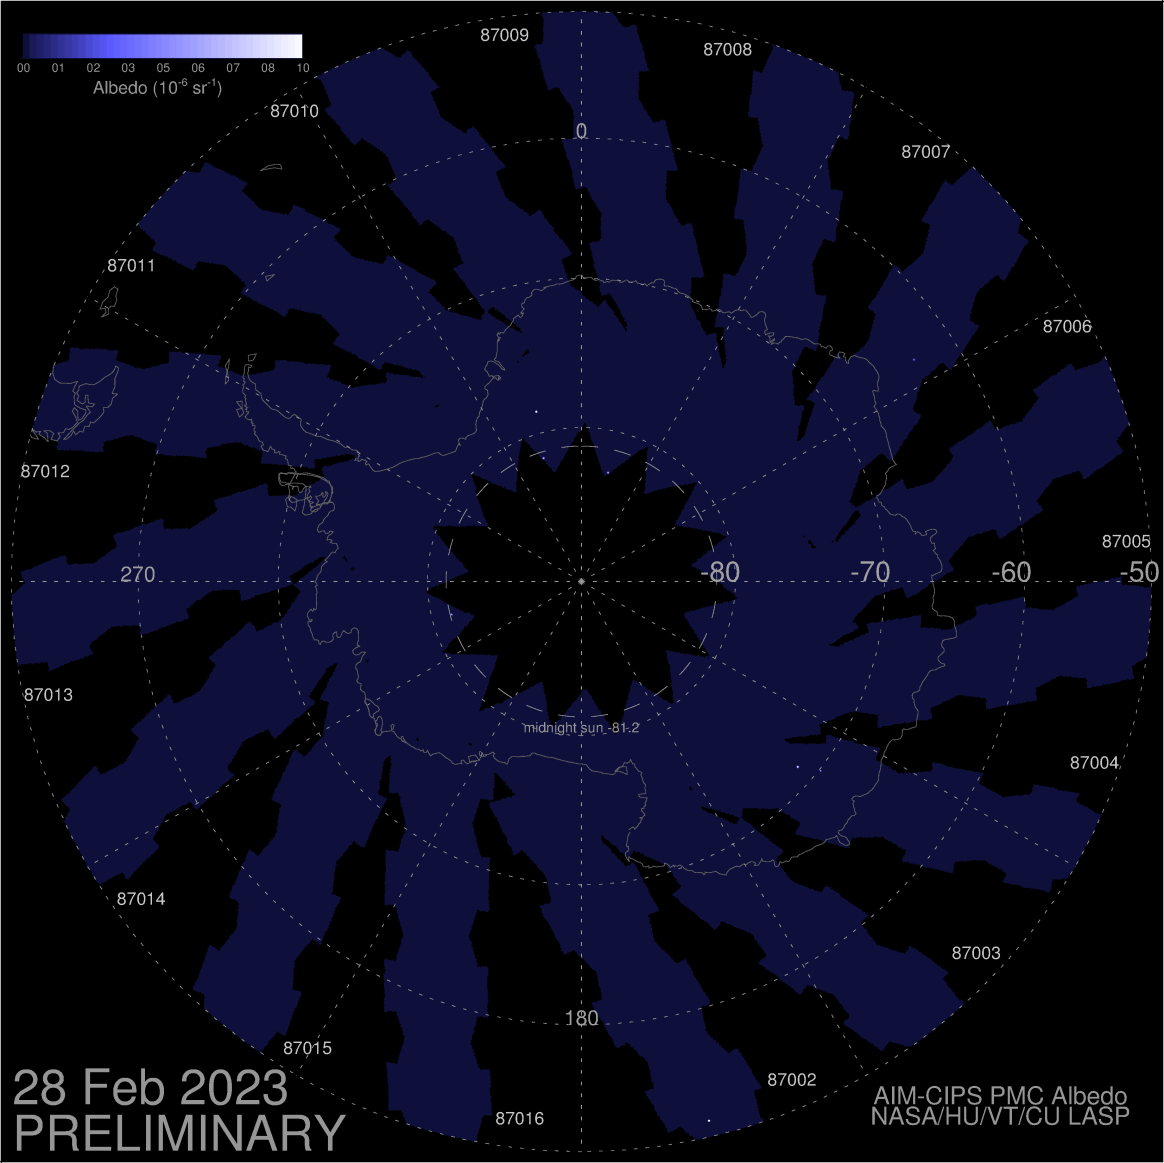
Noctilucent CloudsOur connection with NASA's AIM spacecraft has been restored! New images from AIM show that the southern season for noctilucent clouds (NLCs) is underway. Come back to this spot every day to see AIM's "daily daisy," which reveals the dance of electric-blue NLCs around the Antarctic Circle..
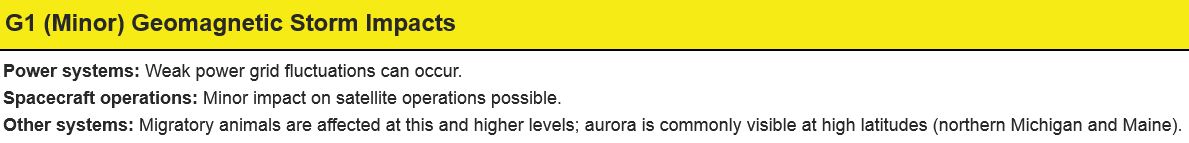
Geomagnetic Storms: Probabilities for significant disturbances in Earth's magnetic field are given for three activity levels: active, minor storm, severe storm
Updated at: 2018 Mar 15 2200 UTC
Mid-latitudes
0-24 hr
24-48 hr
ACTIVE
35 %
35 %
MINOR
15 %
15 %
SEVERE
01 %
01 %
High latitudes
0-24 hr
24-48 hr
ACTIVE
15 %
15 %
MINOR
30 %
30 %
SEVERE
40 %
40 %
Thursday, Mar. 15, 2018
What's up in space
Lights Over Lapland is excited to announce that we now have TWO aurora webcams covering nearly a 200° view of Abisko National Park in Sweden! Watch the auroras dance live, all season long here.
THE SOLAR WIND HAS ARRIVED: Earth is entering a stream of high-speed solar wind flowing from a wide gash in the sun's atmosphere. Around the Arctic Circle, this is causing auroras so bright that some observers are seeing them even before nightfall. NOAA forecasters say there is a 55% chance of G1-class geomagnetic storms developing as Earth moves deeper into the stream. Free:Aurora Alerts
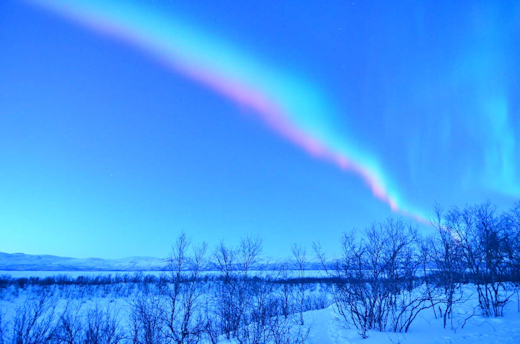
AURORAS IN MOTION: On March 14th, deep inside the Arctic Circle, photographer Oliver Wright stood outside in the cold waiting for the solar wind to arrive. It didn't. Nevertheless, the sky erupted in a swirling cauldron of color--"possibly the best I've ever seen," says Wright, who has been leading aurora tours for years in Abisko, Sweden. Turn up the volume and listen to the cries of delight in Wright's 3 minute video:
"My fingers got so cold taking this video," he says, "but it was worth it."
Watch the video again and pay special attention to the moments after 1:30. Those dynamic swirls of pink are caused by energetic particles reaching unusually deep into Earth's atmosphere, interacting with nitrogen molecules to produce a pink glow so intense that it sometimes appeared white.
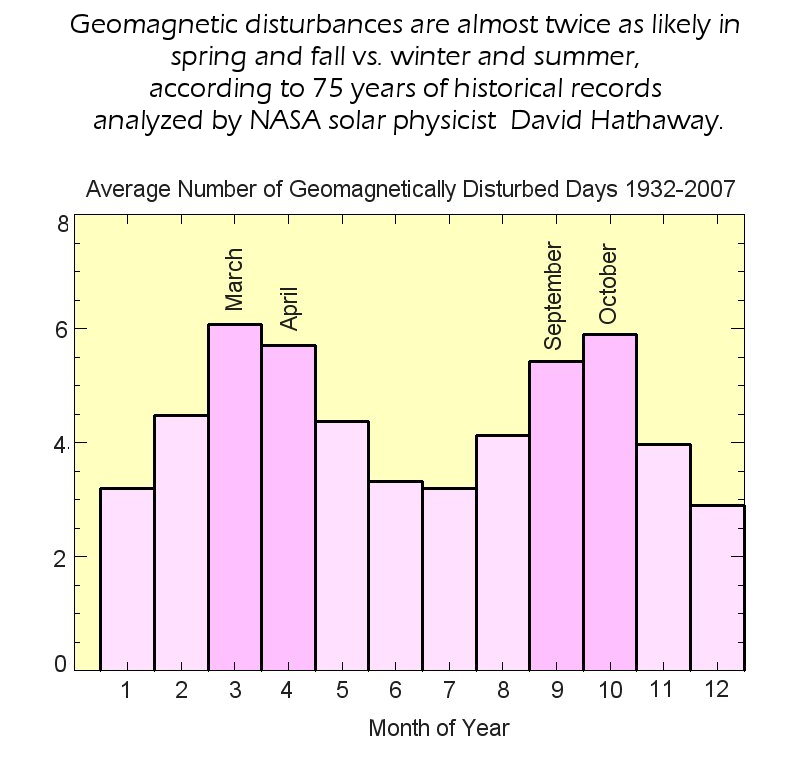
This outburst was caused by a crack forming in Earth's magnetic field. Ambient solar wind (not the high-speed stream Wright expected) poured in to fuel the display. Magnetic cracks occur more frequently than usual during weeks around equinoxes, which make this a great time of year for Arctic lights. Free:Aurora Alerts
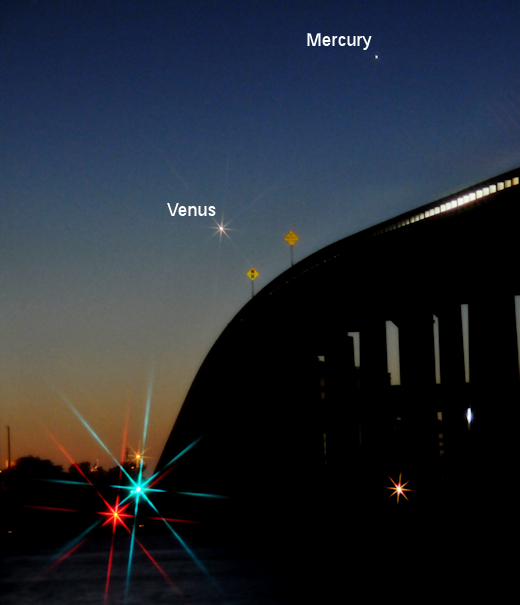
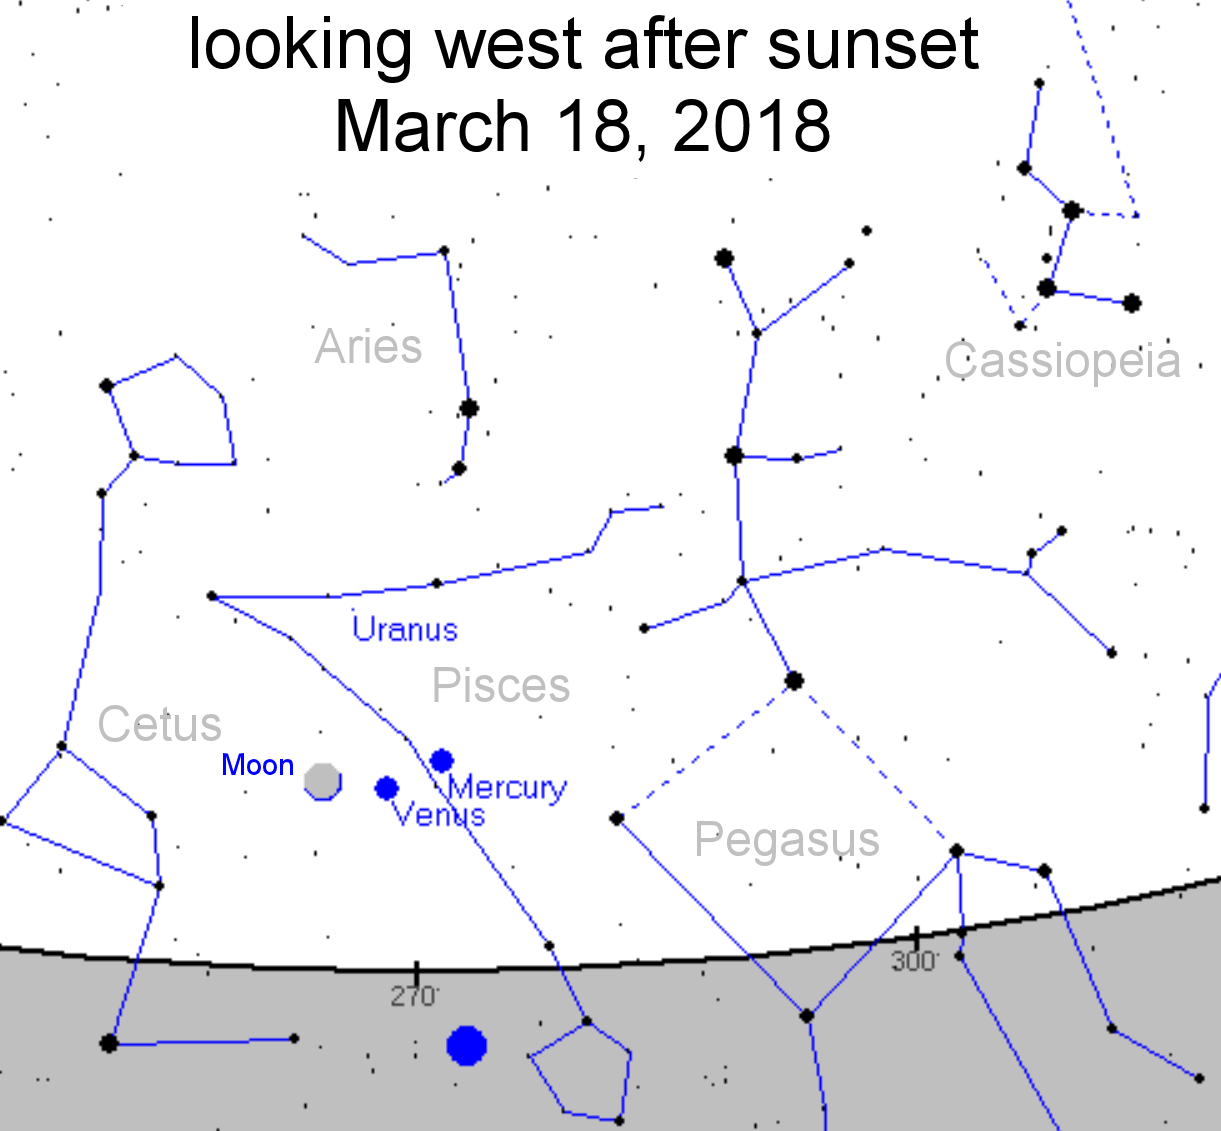
VENUS AND MERCURY: When the sun goes down tonight, step outside and look west. If you have a clear view of the horizon, you'll see Venus and Mercury beaming through the twilight. Mark Marquette sends this picture from Merritt Island, Florida:
"The two planets were easy to see over the Hubert Humphrey Bridge on March 14th," says Marquette. "I plan to watch them closely for the next 7 days as Mercury sinks toward the horizon and brilliant Venus keeps rising higher to dominate the Spring twilight."
A date of special interest is March 18th, when the slender crescent Moon joins Venus and Mercury for a loose but beautiful conjunction in the evening sky. The three will form a slightly bent line less than 8 degrees long--about the size of the bowl of the Big Dipper. Mark your calendar! [sky map]
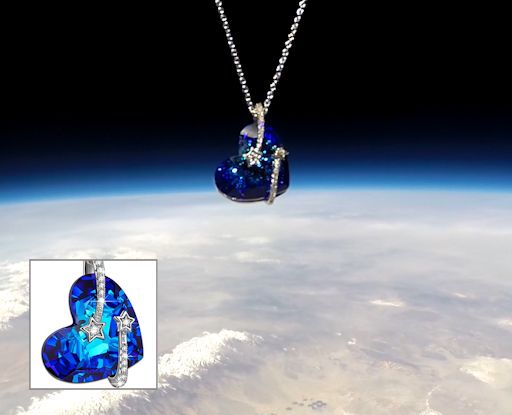
THESE PENDANTS HAVE TOUCHED SPACE: On Feb. 15, 2018, the students of Earth to Sky Calculus flew a payload full of heart-shaped Venus pendants to the stratosphere onboard a high-altitude cosmic ray balloon. Here's one, 111,550 feet above the Sierras of central California:
You have have one for $199.95. These blue jewels make great birthday and anniversary gifts. Each glittering pendant comes with a greeting card showing the jewelry in flight and telling the story of its journey to the stratosphere and back again. All proceeds support hands-on STEM research and atmospheric radiation monitoring.
Every night, a network of NASA all-sky cameras scans the skies above the United States for meteoritic fireballs. Automated software maintained by NASA's Meteoroid Environment Office calculates their orbits, velocity, penetration depth in Earth's atmosphere and many other characteristics. Daily results are presented here on Spaceweather.com.
On Mar. 15, 2018, the network reported 14 fireballs. (14 sporadics)
In this diagram of the inner solar system, all of the fireball orbits intersect at a single point--Earth. The orbits are color-coded by velocity, from slow (red) to fast (blue). [Larger image] [movies]
Near Earth Asteroids
Potentially Hazardous Asteroids (PHAs) are space rocks larger than approximately 100m that can come closer to Earth than 0.05 AU. None of the known PHAs is on a collision course with our planet, although astronomers are finding new ones all the time.
On March 15, 2018 there were 1882 potentially hazardous asteroids.
Notes: LD means "Lunar Distance." 1 LD = 384,401 km, the distance between Earth and the Moon. 1 LD also equals 0.00256 AU. MAG is the visual magnitude of the asteroid on the date of closest approach.
Cosmic Rays in the Atmosphere
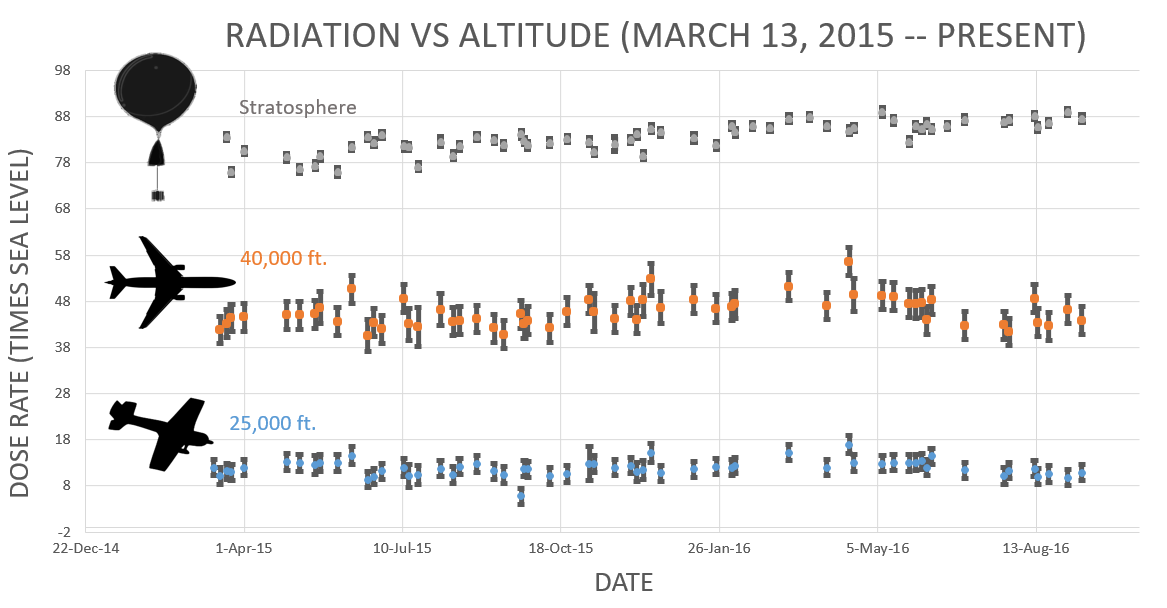
Readers, thank you for your patience while we continue to develop this new section of Spaceweather.com. We've been working to streamline our data reduction, allowing us to post results from balloon flights much more rapidly, and we have developed a new data product, shown here:
This plot displays radiation measurements not only in the stratosphere, but also at aviation altitudes. Dose rates are expessed as multiples of sea level. For instance, we see that boarding a plane that flies at 25,000 feet exposes passengers to dose rates ~10x higher than sea level. At 40,000 feet, the multiplier is closer to 50x. These measurements are made by our usual cosmic ray payload as it passes through aviation altitudes en route to the stratosphere over California.
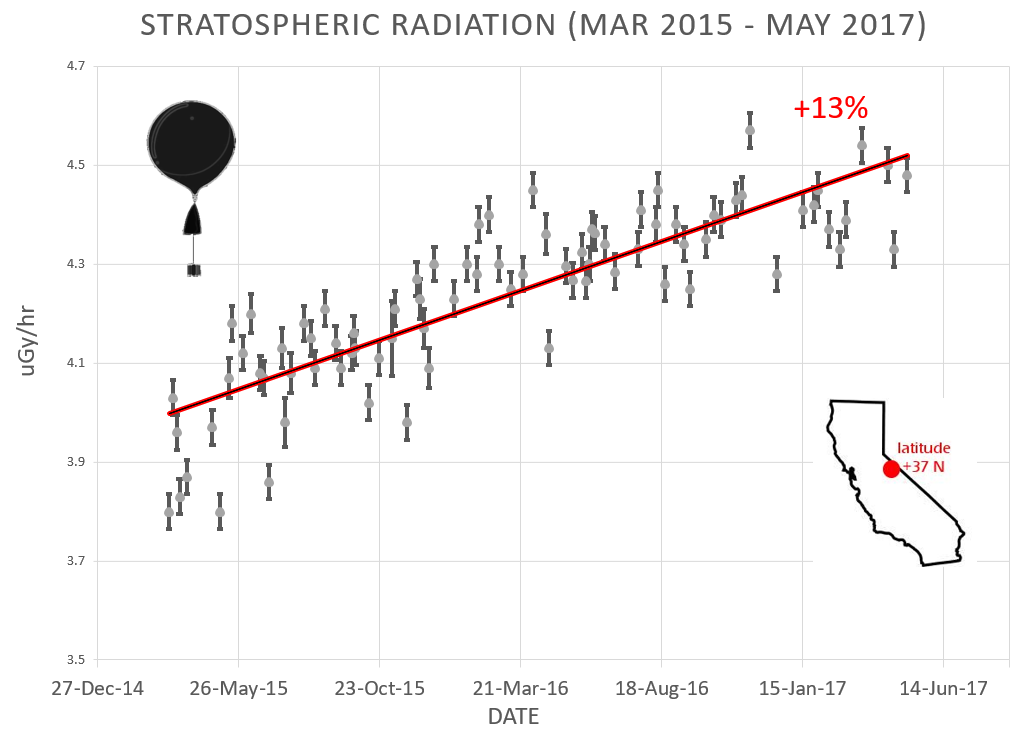
What is this all about? Approximately once a week, Spaceweather.com and the students of Earth to Sky Calculus fly space weather balloons to the stratosphere over California. These balloons are equipped with radiation sensors that detect cosmic rays, a surprisingly "down to Earth" form of space weather. Cosmic rays can seed clouds, trigger lightning, and penetrate commercial airplanes. Furthermore, there are studies ( #1, #2, #3, #4) linking cosmic rays with cardiac arrhythmias and sudden cardiac death in the general population. Our latest measurements show that cosmic rays are intensifying, with an increase of more than 13% since 2015:
Why are cosmic rays intensifying? The main reason is the sun. Solar storm clouds such as coronal mass ejections (CMEs) sweep aside cosmic rays when they pass by Earth. During Solar Maximum, CMEs are abundant and cosmic rays are held at bay. Now, however, the solar cycle is swinging toward Solar Minimum, allowing cosmic rays to return. Another reason could be the weakening of Earth's magnetic field, which helps protect us from deep-space radiation.
The radiation sensors onboard our helium balloons detect X-rays and gamma-rays in the energy range 10 keV to 20 MeV. These energies span the range of medical X-ray machines and airport security scanners.
The data points in the graph above correspond to the peak of the Reneger-Pfotzer maximum, which lies about 67,000 feet above central California. When cosmic rays crash into Earth's atmosphere, they produce a spray of secondary particles that is most intense at the entrance to the stratosphere. Physicists Eric Reneger and Georg Pfotzer discovered the maximum using balloons in the 1930s and it is what we are measuring today.


