Solar minimum is here - but even now strangely beautiful auroras are dancing around the poles. Deep inside the Arctic Circle, the expert guides of Aurora Holidays in Utsjoki, Finland, can help you chase them. Book now! | | |
COSMIC RAYS ARE INCREASING AT AVIATION ALTITUDES: New high-altitude balloon measurements inside the Arctic Circle show that cosmic rays are increasing at aviation altitudes. Commercial flight crews and passengers traveling over Earth's poles now experience as much as 12% more radiation than they did just a few years ago. Check out the data and get the full story right here.
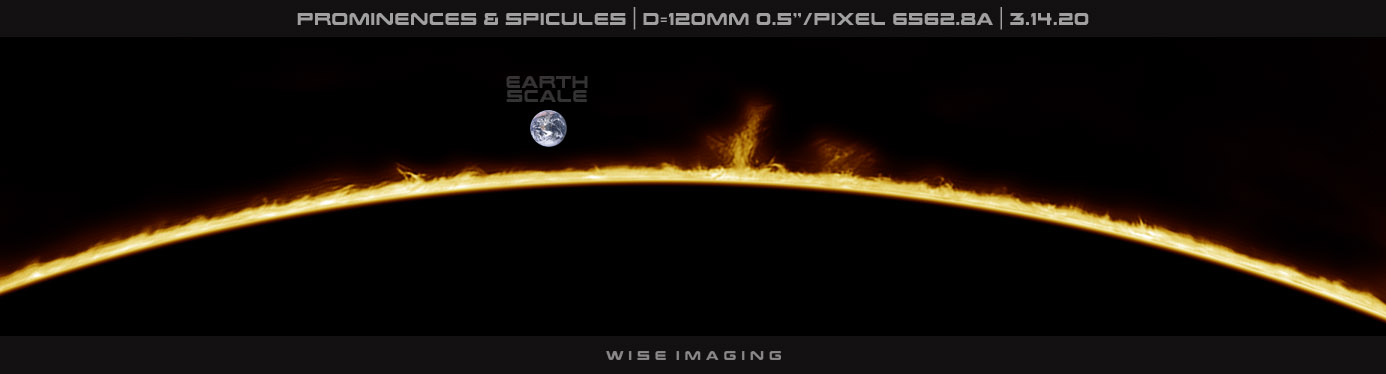
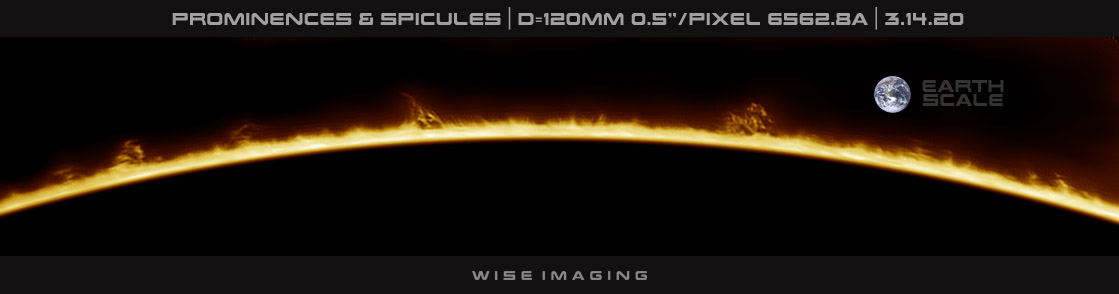
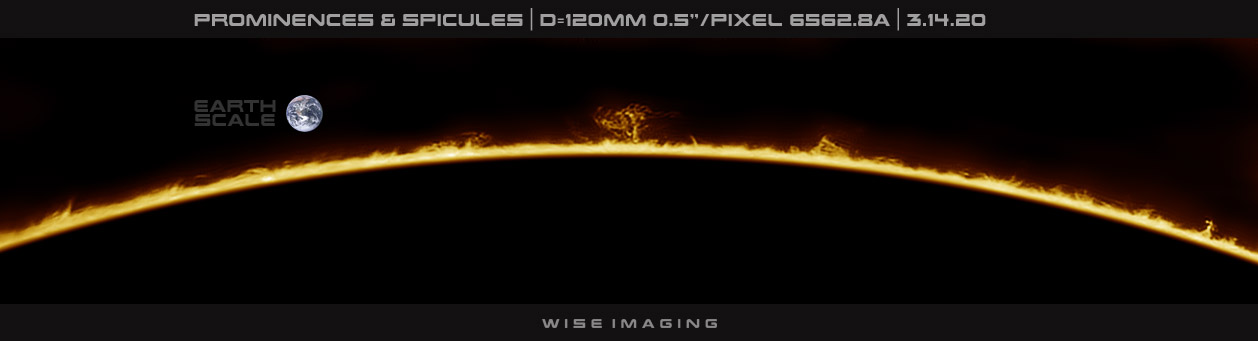
WHY DOES THE SUN LOOK LIKE SHAG CARPET? Yesterday, amateur astronomer Martin Wise of Trenton, Florida, pointed his H-alpha telescope at the sun. There were no sunspots. Instead, this is what he saw:
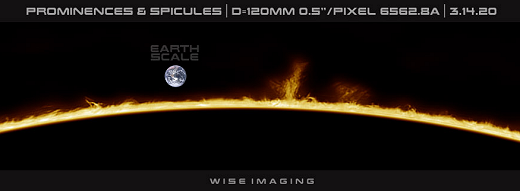
It looks a bit like shag carpet. All along the edge are hundreds of little orange "fibers" reminiscent of 1970s flooring. The shaggy threads are called spicules, Texas-sized jets of gas shooting up from the sun's surface. Because spicules rise and fall in only a few minutes, each snapshot looks a little different.
The big wild thread near the middle is not a spicule but a prominence. Prominences are clouds of hydrogen held above the sun's surface by magnetic fields. They are larger than spicules, and much longer lasting.
Realtime Space Weather Photo Gallery
Free: Spaceweather.com Newsletter
HOW CORONAVIRUS AFFECTS STARTRAILS: Something has changed in the night skies of Italy. For years, Paolo Bardelli has enjoyed photographing star trails from his home in Sumirago. "We're only about 15 km from the Milan Malpensa International Airport," he says. "Normally, my images are criss-crossed by many airplanes. When I took this photo on March 11th, however, there were only two."
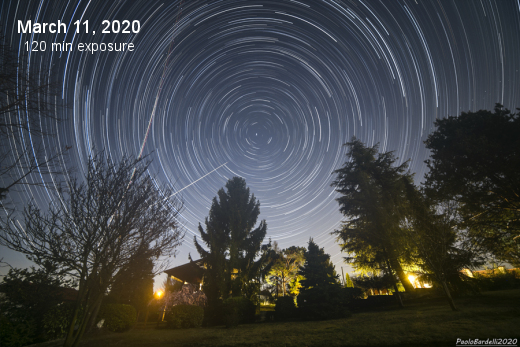
What happened? "Unfortunately," says Bardelli, "the absence of planes in the sky is the result of the COVID-19 virus, which has forced us into isolation."
One of the world's most popular tourist destinations, Italy is under a strict lockdown in which people are only allowed to leave their homes when it is absolutely necessary. Any Italian who wants to travel has to get permission from authorities. Eerie photos of empty airports are circulating the Internet.
"Here is a comparison image from Jan. 29, 2020," he says. "It shows what the traffic was like before the lockdown began."
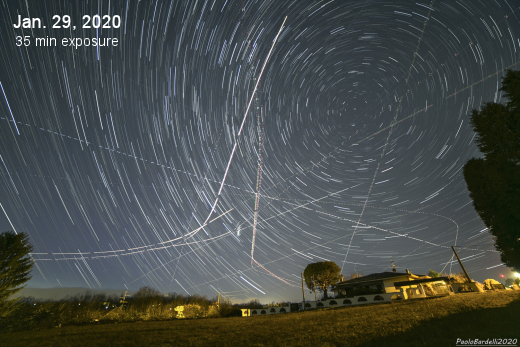
The difference is even more striking when you consider that the January image was only 35 minutes long vs. 120 minutes for the March exposure. "We are all staying at home waiting for an improvement in the situation," adds Bardelli, who is still able to walk out in his backyard. "Luckily we have the sky!"
Best wishes from Spaceweather.com to people around the world affected by COVID-19. Hopefully life and skies will soon return to normal.
Realtime Space Weather Photo Gallery
Free: Spaceweather.com Newsletter
MR. SPOCK BOBBLEHEAD IN THE STRATOSPHERE: If you would like to support the Earth to Sky Calculus cosmic ray ballooning program, there's a logical way to do it. Puchase this Mr. Spock collector's item. Here is the green-blooded science officer floating 32.2 km (112,200 ft) above Death Valley National Park in central California:
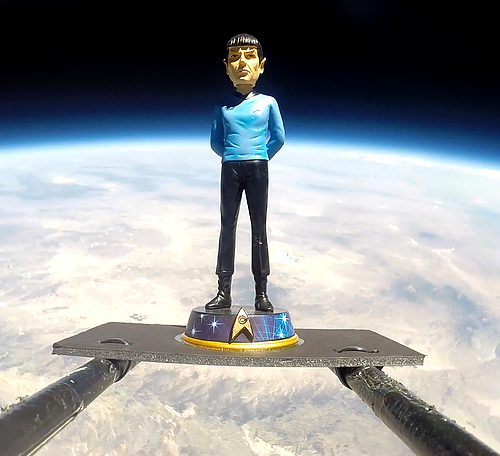
You can have him for $170.10. The price, in case you're wondering, is the serial number of the Enterprise, NGC1701, divided by 10. The students are selling Spock to buy more helium! He comes with a greeting card showing the high-quality resin bobblehead in flight and telling the story of his journey to the stratosphere and back again.
Far Out Gifts: Earth to Sky Store
All sales support hands-on STEM education
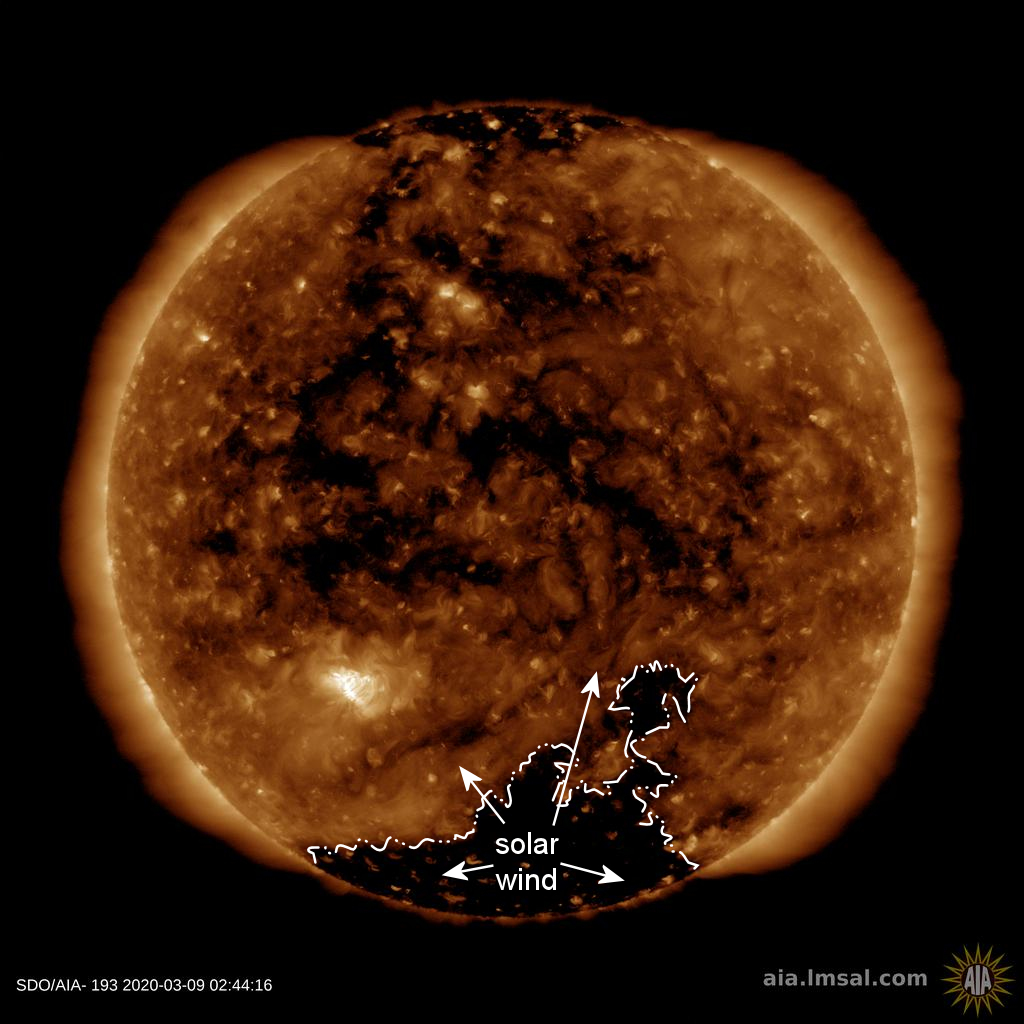
FRIDAY THE 13TH AURORAS: Friday the 13th was a lucky day for some Arctic sky watchers. A solar wind stream almost missed Earth, but didn't. Gaseous material flowing from a southern hole in the sun's atmosphere grazed our planet's magnetic field, sparkingauroras over Alaska, Canada and Finland. No more solar wind streams are due to arrive for at least a week. Aurora alerts: SMS Text.
Realtime Aurora Photo Gallery
Free: Spaceweather.com Newsletter
Every night, a network of
NASA all-sky cameras scans the skies above the United States for meteoritic fireballs. Automated software maintained by NASA's Meteoroid Environment Office calculates their orbits, velocity, penetration depth in Earth's atmosphere and many other characteristics. Daily results are presented here on Spaceweather.com.
On Mar. 15, 2020, the network reported 2 fireballs.
(2 sporadics)
In this diagram of the inner solar system, all of the fireball orbits intersect at a single point--Earth. The orbits are color-coded by velocity, from slow (red) to fast (blue). [Larger image] [movies]
Potentially Hazardous Asteroids (
PHAs) are space rocks larger than approximately 100m that can come closer to Earth than 0.05 AU. None of the known PHAs is on a collision course with our planet, although astronomers are finding
new ones all the time.
On March 15, 2020 there were 2018 potentially hazardous asteroids.
 |
Recent & Upcoming Earth-asteroid encounters: | Asteroid | Date(UT) | Miss Distance | Velocity (km/s) | Diameter (m) |
| 2018 RF6 | 2020-Mar-10 | 11.2 LD | 12.6 | 36 |
| 2020 EE | 2020-Mar-10 | 4.8 LD | 7.9 | 14 |
| 2020 CA3 | 2020-Mar-10 | 13.7 LD | 6.3 | 33 |
| 2020 ED | 2020-Mar-11 | 7.6 LD | 8.5 | 15 |
| 2008 UB95 | 2020-Mar-11 | 18.5 LD | 7.6 | 41 |
| 2020 EO | 2020-Mar-12 | 2.4 LD | 5.8 | 23 |
| 2018 GY | 2020-Mar-15 | 6.2 LD | 9.5 | 39 |
| 2020 EF | 2020-Mar-19 | 16.6 LD | 4.5 | 18 |
| 2020 DP4 | 2020-Mar-22 | 3.5 LD | 8.1 | 33 |
| 2012 XA133 | 2020-Mar-27 | 17.4 LD | 23.7 | 235 |
| 2010 GD35 | 2020-Mar-29 | 15.3 LD | 12 | 43 |
| 2006 FH36 | 2020-Mar-30 | 11.3 LD | 5.1 | 93 |
| 2019 GM1 | 2020-Apr-02 | 9 LD | 4.2 | 14 |
| 2015 FC35 | 2020-Apr-04 | 10.5 LD | 13.8 | 148 |
| 2020 DT3 | 2020-Apr-05 | 17.6 LD | 11.8 | 188 |
| 2019 HM | 2020-Apr-10 | 7.2 LD | 3.2 | 23 |
| 363599 | 2020-Apr-11 | 19.2 LD | 24.5 | 224 |
| 2019 HS2 | 2020-Apr-26 | 13.6 LD | 12.6 | 17 |
| 2019 GF1 | 2020-Apr-27 | 18.7 LD | 3.2 | 12 |
| 52768 | 2020-Apr-29 | 16.4 LD | 8.7 | 2457 |
| 2020 DM4 | 2020-May-01 | 18.4 LD | 6.4 | 162 |
| 438908 | 2020-May-07 | 8.9 LD | 12.8 | 282 |
| 2016 HP6 | 2020-May-07 | 4.3 LD | 5.7 | 31 |
| 388945 | 2020-May-10 | 7.3 LD | 8.8 | 295 |
| 2000 KA | 2020-May-12 | 8.9 LD | 13.5 | 162 |
Notes: LD means "Lunar Distance." 1 LD = 384,401 km, the distance between Earth and the Moon. 1 LD also equals 0.00256 AU. MAG is the visual magnitude of the asteroid on the date of closest approach. | | Cosmic Rays in the Atmosphere |
SOMETHING NEW! We have developed a new predictive model of aviation radiation. It's called E-RAD--short for Empirical RADiation model. We are constantly flying radiation sensors onboard airplanes over the US and and around the world, so far collecting more than 22,000 gps-tagged radiation measurements. Using this unique dataset, we can predict the dosage on any flight over the USA with an error no worse than 15%.
E-RAD lets us do something new: Every day we monitor approximately 1400 flights criss-crossing the 10 busiest routes in the continental USA. Typically, this includes more than 80,000 passengers per day. E-RAD calculates the radiation exposure for every single flight.
The Hot Flights Table is a daily summary of these calculations. It shows the 5 charter flights with the highest dose rates; the 5 commercial flights with the highest dose rates; 5 commercial flights with near-average dose rates; and the 5 commercial flights with the lowest dose rates. Passengers typically experience dose rates that are 20 to 70 times higher than natural radiation at sea level.
To measure radiation on airplanes, we use the same sensors we fly to the stratosphere onboard Earth to Sky Calculus cosmic ray balloons: neutron bubble chambers and X-ray/gamma-ray Geiger tubes sensitive to energies between 10 keV and 20 MeV. These energies span the range of medical X-ray machines and airport security scanners.
Column definitions: (1) The flight number; (2) The maximum dose rate during the flight, expressed in units of natural radiation at sea level; (3) The maximum altitude of the plane in feet above sea level; (4) Departure city; (5) Arrival city; (6) Duration of the flight.
SPACE WEATHER BALLOON DATA: Approximately once a week, Spaceweather.com and the students of Earth to Sky Calculus fly space weather balloons to the stratosphere over California. These balloons are equipped with radiation sensors that detect cosmic rays, a surprisingly "down to Earth" form of space weather. Cosmic rays can seed clouds, trigger lightning, and penetrate commercial airplanes. Furthermore, there are studies ( #1, #2, #3, #4) linking cosmic rays with cardiac arrhythmias and sudden cardiac death in the general population. Our latest measurements show that cosmic rays are intensifying, with an increase of more than 18% since 2015:

The data points in the graph above correspond to the peak of the Regener-Pfotzer maximum, which lies about 67,000 feet above central California. When cosmic rays crash into Earth's atmosphere, they produce a spray of secondary particles that is most intense at the entrance to the stratosphere. Physicists Eric Reneger and Georg Pfotzer discovered the maximum using balloons in the 1930s and it is what we are measuring today.
En route to the stratosphere, our sensors also pass through aviation altitudes:

In this plot, dose rates are expessed as multiples of sea level. For instance, we see that boarding a plane that flies at 25,000 feet exposes passengers to dose rates ~10x higher than sea level. At 40,000 feet, the multiplier is closer to 50x.
The radiation sensors onboard our helium balloons detect X-rays and gamma-rays in the energy range 10 keV to 20 MeV. These energies span the range of medical X-ray machines and airport security scanners.
Why are cosmic rays intensifying? The main reason is the sun. Solar storm clouds such as coronal mass ejections (CMEs) sweep aside cosmic rays when they pass by Earth. During Solar Maximum, CMEs are abundant and cosmic rays are held at bay. Now, however, the solar cycle is swinging toward Solar Minimum, allowing cosmic rays to return. Another reason could be the weakening of Earth's magnetic field, which helps protect us from deep-space radiation.
| | The official U.S. government space weather bureau |
| | The first place to look for information about sundogs, pillars, rainbows and related phenomena. |
| | Researchers call it a "Hubble for the sun." SDO is the most advanced solar observatory ever. |
| | 3D views of the sun from NASA's Solar and Terrestrial Relations Observatory |
| | Realtime and archival images of the Sun from SOHO. |
| | from the NOAA Space Environment Center |
| | fun to read, but should be taken with a grain of salt! Forecasts looking ahead more than a few days are often wrong. |
| | from the NOAA Space Environment Center |
| | the underlying science of space weather |
 | To find reviews of new online casino sites in the UK try The Casino DB where there are hundreds of online casino reviews complete with bonuses and ratings. Get a bonus when playing at a new casino in the UK. The Genie got you covered! Looking for a new online casino? Try Casimpo the new site dedicated to making online casino simple and easy for all. |
| | These links help Spaceweather.com stay online. Thank you to our supporters! |
| | | | | | |


