Marianne’s Arctic tours: Operating in small groups of 7 to 14 persons--all needs supplied for safety, comfort and pleasure. Night & day photography or non-photographic landscape - wildlife tours. Click for details! | | |
SOLAR CYCLE 25 IS INTENSIFYING: Don't get too excited; Solar Minimum is still underway. However, new Solar Cycle 25 is showing signs of life. There are currently two new-cycle sunspots on the sun: AR2762 and AR2763. So far in 2020, 78% of all sunspots have come from Solar Cycle 25, a sharp increase from only 17% in 2019 and 0% in 2018. Aurora Alerts: SMS Text.
REFLECTED TSUNAMIS AND SPACE WEATHER: When the Earth trembles, even the edge of space moves. Researchers have known for decades that earthquakes and tsunamis send waves of air pressure to the very top of Earth’s atmosphere. Up there, in the ionosphere, the waves scramble GPS signals and interfere with radio communications much like solar flares do. Earthquakes, it turns out, can mimic space weather.
A new paper published in the research journal Space Weather shows that earthquakes and tsunamis may, in fact, affect the ionosphere much more than previously thought.
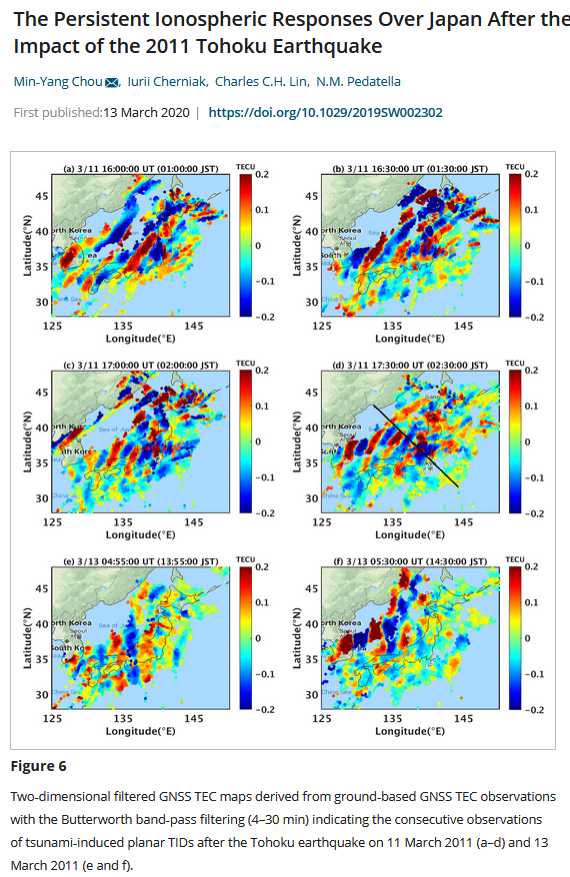
"On 11 March 2011, a magnitude 9.0 earthquake occurred near the east coast of Honshu, Japan, unleashing a savage tsunami as well as unprecedented ripples at the space‐atmosphere interaction region," report the authors, led by Min-Yang Chou of the University Corporation for Atmospheric Research (UCAR) in Boulder, CO.
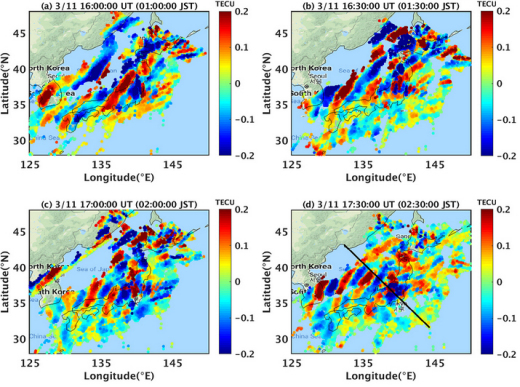
Above: Ionospheric disturbances over Japan on March 11, 2011. Full Caption
Using satellites and ground-based GPS receivers, Chou and colleagues took a close look at what happened to the ionosphere over Japan in the aftermath of the earthquake. As expected, it was disturbed. Surprisingly, though, the ionospheric disturbances didn’t peter out after the initial quake and tsunami; they kept going for many more hours.
The reason: Reflected tsunamis.
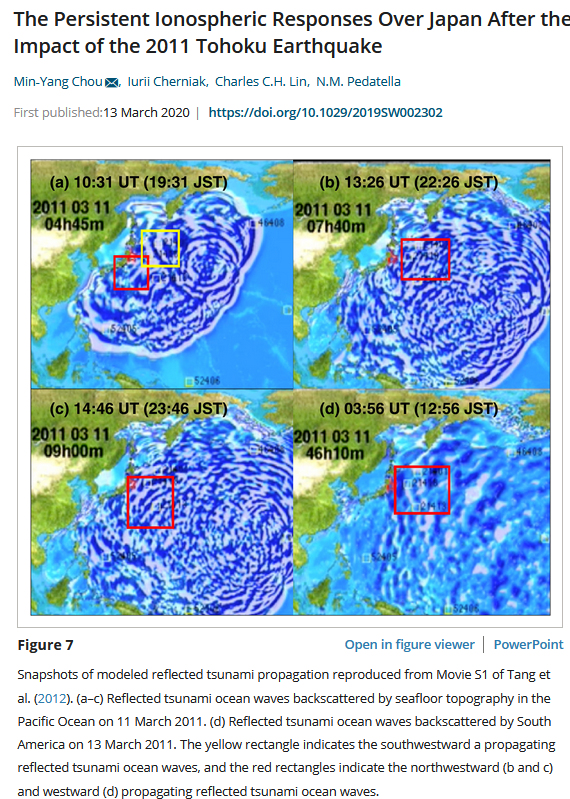
"The tsunami was reflected by multiple sources such as seamounts, islands and ridges," says Chou. "These reflections created multiple concentric tsunami wave patterns in the ocean." Bouncing back and forth across the Pacific, reflected tsunamis kept the ionosphere above Japan disturbed for as much as 46 hours.
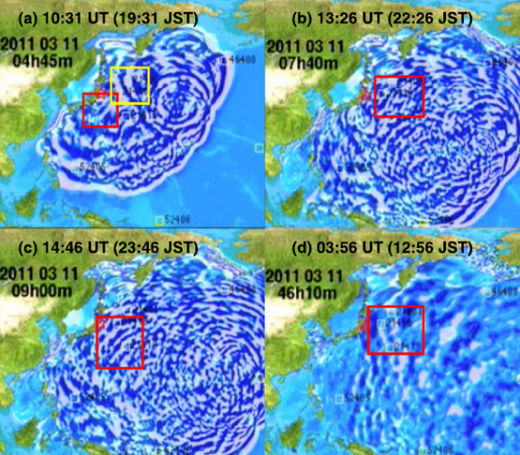
Above: Tsunami waves reflected from sea floor topography on March 11-13, 2011. Full caption.
Researchers once thought that only the sun could disturb the ionosphere so much. Solar flares bathe the top of our atmosphere with ultraviolet and X-radiation, sending waves of ionization rippling through the ionosphere. Sound familiar? Earthquakes and tsunamis have the same effect. In fact, Chou says, the disturbances over Japan were akin to a series of strong X-class solar flares.
In some ways, tsunamis are even worse. The disturbances they produce last for days and, because of reflections, can be very complicated. Reflected waves near Japan in 2011 caused chaotic nighttime "twinkling" of GPS satellite signals–enough to cause some GPS devices to completely lose lock.
As 2020 unfolds, the sun is experiencing one of the deepest Solar Minima of the past century. There are no solar flares. At a time like this, earthquakes and tsunamis rule, mimicking stormy space weather in the absence of the real thing.
Now more than ever, "understanding how natural hazards [such as tsunamis] impact our upper atmosphere and cause variations in the space environment around Earth is crucial," says Chou.
A sharable version of this story is available here.
Realtime Space Weather Photo Gallery
Free: Spaceweather.com Newsletter
MOTHER'S DAY IS LESS THAN TWO WEEKS AWAY! Are you looking for an out-of-this world Mother's Day gift? Consider this: Every time the students of Earth to Sky Calculus launch a cosmic ray balloon, they include something extra in the payload--something Mom will love:

Every item in the Earth to Sky Store has flown to the edge of space and comes with a greeting card showing the item in flight. The interior of the card tells the story of the gift's journey from launch to landing. Mom-satisfaction guaranteed!
Far Out Gifts: Earth to Sky Store
All sales support hands-on STEM education
Realtime Aurora Photo Gallery
Free: Spaceweather.com Newsletter
Every night, a network of
NASA all-sky cameras scans the skies above the United States for meteoritic fireballs. Automated software maintained by NASA's Meteoroid Environment Office calculates their orbits, velocity, penetration depth in Earth's atmosphere and many other characteristics. Daily results are presented here on Spaceweather.com.
On May 01, 2020, the network reported 15 fireballs.
(14 sporadics, 1 eta Aquarid)
In this diagram of the inner solar system, all of the fireball orbits intersect at a single point--Earth. The orbits are color-coded by velocity, from slow (red) to fast (blue). [Larger image] [movies]
Potentially Hazardous Asteroids (
PHAs) are space rocks larger than approximately 100m that can come closer to Earth than 0.05 AU. None of the known PHAs is on a collision course with our planet, although astronomers are finding
new ones all the time.
On May 1, 2020 there were 2018 potentially hazardous asteroids.
 |
Recent & Upcoming Earth-asteroid encounters: | Asteroid | Date(UT) | Miss Distance | Velocity (km/s) | Diameter (m) |
| 2020 HE7 | 2020-Apr-26 | 5.7 LD | 3.4 | 6 |
| 2020 HN3 | 2020-Apr-26 | 2.3 LD | 4.3 | 4 |
| 2020 HY5 | 2020-Apr-26 | 16.3 LD | 20.8 | 26 |
| 2020 HT8 | 2020-Apr-26 | 0.4 LD | 20 | 8 |
| 2019 HS2 | 2020-Apr-26 | 13.6 LD | 12.6 | 17 |
| 2020 HW6 | 2020-Apr-26 | 2.2 LD | 6.7 | 22 |
| 2019 GF1 | 2020-Apr-27 | 18.7 LD | 3.2 | 12 |
| 2020 FM6 | 2020-Apr-27 | 14.3 LD | 16.9 | 148 |
| 2020 HT7 | 2020-Apr-27 | 1.9 LD | 4.4 | 15 |
| 2020 HC5 | 2020-Apr-27 | 10 LD | 9 | 15 |
| 2020 HP6 | 2020-Apr-27 | 0.3 LD | 12.2 | 9 |
| 2020 HS1 | 2020-Apr-27 | 18 LD | 2 | 24 |
| 2020 HT1 | 2020-Apr-28 | 11.1 LD | 9.7 | 24 |
| 2020 HS7 | 2020-Apr-28 | 0.1 LD | 15.6 | 5 |
| 2020 HP | 2020-Apr-28 | 14.1 LD | 10.4 | 54 |
| 2020 HG3 | 2020-Apr-29 | 12.5 LD | 11 | 22 |
| 2020 HJ6 | 2020-Apr-29 | 1.7 LD | 16.5 | 17 |
| 52768 | 2020-Apr-29 | 16.4 LD | 8.7 | 2457 |
| 2020 HK6 | 2020-Apr-29 | 3.1 LD | 14.9 | 11 |
| 2020 HW2 | 2020-Apr-29 | 18 LD | 9.8 | 38 |
| 2020 HO3 | 2020-Apr-30 | 17.5 LD | 9.3 | 21 |
| 2020 GY2 | 2020-Apr-30 | 17.2 LD | 16.3 | 66 |
| 2020 HB3 | 2020-Apr-30 | 13 LD | 12.2 | 34 |
| 2020 HK3 | 2020-May-01 | 4.4 LD | 23.4 | 51 |
| 2020 HF4 | 2020-May-01 | 9.1 LD | 2.6 | 11 |
| 2020 DM4 | 2020-May-01 | 18.4 LD | 6.4 | 158 |
| 2020 HU2 | 2020-May-01 | 7.4 LD | 5.6 | 17 |
| 2020 HR6 | 2020-May-01 | 12.7 LD | 12.2 | 20 |
| 2020 HN9 | 2020-May-02 | 15 LD | 12.2 | 32 |
| 2020 HZ4 | 2020-May-02 | 16.1 LD | 18.8 | 52 |
| 2020 HN5 | 2020-May-03 | 9.6 LD | 7.1 | 34 |
| 2020 HL1 | 2020-May-03 | 12.6 LD | 12 | 31 |
| 2020 GE3 | 2020-May-04 | 19.1 LD | 5.2 | 22 |
| 2020 HQ3 | 2020-May-04 | 10.8 LD | 9.5 | 29 |
| 2020 HU9 | 2020-May-04 | 16.8 LD | 17.1 | 39 |
| 2020 HV4 | 2020-May-04 | 18.2 LD | 10 | 77 |
| 2020 HS9 | 2020-May-05 | 4.6 LD | 18.1 | 31 |
| 2020 HR8 | 2020-May-05 | 9.1 LD | 9.7 | 14 |
| 2020 HZ6 | 2020-May-05 | 10.2 LD | 21.8 | 34 |
| 2020 HL | 2020-May-05 | 16.7 LD | 9.1 | 35 |
| 2020 HF7 | 2020-May-05 | 9.3 LD | 17.3 | 21 |
| 2020 HL6 | 2020-May-06 | 2.1 LD | 5.4 | 9 |
| 438908 | 2020-May-07 | 8.9 LD | 12.8 | 282 |
| 2020 HM4 | 2020-May-07 | 10.7 LD | 18.1 | 43 |
| 2016 HP6 | 2020-May-07 | 4.3 LD | 5.7 | 31 |
| 2020 HB6 | 2020-May-08 | 9.8 LD | 9.1 | 53 |
| 2020 HC6 | 2020-May-09 | 2.9 LD | 6 | 36 |
| 388945 | 2020-May-10 | 7.3 LD | 8.8 | 295 |
| 2000 KA | 2020-May-12 | 8.9 LD | 13.5 | 162 |
| 2020 HS6 | 2020-May-14 | 15.8 LD | 23 | 125 |
| 478784 | 2020-May-15 | 8.5 LD | 3.6 | 28 |
| 2020 HA9 | 2020-May-15 | 18.2 LD | 15.8 | 31 |
| 2020 HG9 | 2020-May-18 | 15.6 LD | 10.6 | 71 |
| 136795 | 2020-May-21 | 16.1 LD | 11.7 | 892 |
| 163348 | 2020-Jun-06 | 13.3 LD | 11.1 | 339 |
| 2013 XA22 | 2020-Jun-09 | 10.6 LD | 6.5 | 98 |
| 2017 MF7 | 2020-Jun-14 | 3.7 LD | 10.9 | 23 |
| 2018 PD22 | 2020-Jun-19 | 17.2 LD | 14.6 | 56 |
| 441987 | 2020-Jun-24 | 9.8 LD | 12.9 | 186 |
| 2017 FW128 | 2020-Jun-25 | 6.9 LD | 5.4 | 11 |
Notes: LD means "Lunar Distance." 1 LD = 384,401 km, the distance between Earth and the Moon. 1 LD also equals 0.00256 AU. MAG is the visual magnitude of the asteroid on the date of closest approach. | | Cosmic Rays in the Atmosphere |
SOMETHING NEW! We have developed a new predictive model of aviation radiation. It's called E-RAD--short for Empirical RADiation model. We are constantly flying radiation sensors onboard airplanes over the US and and around the world, so far collecting more than 22,000 gps-tagged radiation measurements. Using this unique dataset, we can predict the dosage on any flight over the USA with an error no worse than 15%.
E-RAD lets us do something new: Every day we monitor approximately 1400 flights criss-crossing the 10 busiest routes in the continental USA. Typically, this includes more than 80,000 passengers per day. E-RAD calculates the radiation exposure for every single flight.
The Hot Flights Table is a daily summary of these calculations. It shows the 5 charter flights with the highest dose rates; the 5 commercial flights with the highest dose rates; 5 commercial flights with near-average dose rates; and the 5 commercial flights with the lowest dose rates. Passengers typically experience dose rates that are 20 to 70 times higher than natural radiation at sea level.
To measure radiation on airplanes, we use the same sensors we fly to the stratosphere onboard Earth to Sky Calculus cosmic ray balloons: neutron bubble chambers and X-ray/gamma-ray Geiger tubes sensitive to energies between 10 keV and 20 MeV. These energies span the range of medical X-ray machines and airport security scanners.
Column definitions: (1) The flight number; (2) The maximum dose rate during the flight, expressed in units of natural radiation at sea level; (3) The maximum altitude of the plane in feet above sea level; (4) Departure city; (5) Arrival city; (6) Duration of the flight.
SPACE WEATHER BALLOON DATA: Approximately once a week, Spaceweather.com and the students of Earth to Sky Calculus fly space weather balloons to the stratosphere over California. These balloons are equipped with radiation sensors that detect cosmic rays, a surprisingly "down to Earth" form of space weather. Cosmic rays can seed clouds, trigger lightning, and penetrate commercial airplanes. Furthermore, there are studies ( #1, #2, #3, #4) linking cosmic rays with cardiac arrhythmias and sudden cardiac death in the general population. Our latest measurements show that cosmic rays are intensifying, with an increase of more than 18% since 2015:

The data points in the graph above correspond to the peak of the Regener-Pfotzer maximum, which lies about 67,000 feet above central California. When cosmic rays crash into Earth's atmosphere, they produce a spray of secondary particles that is most intense at the entrance to the stratosphere. Physicists Eric Reneger and Georg Pfotzer discovered the maximum using balloons in the 1930s and it is what we are measuring today.
En route to the stratosphere, our sensors also pass through aviation altitudes:

In this plot, dose rates are expessed as multiples of sea level. For instance, we see that boarding a plane that flies at 25,000 feet exposes passengers to dose rates ~10x higher than sea level. At 40,000 feet, the multiplier is closer to 50x.
The radiation sensors onboard our helium balloons detect X-rays and gamma-rays in the energy range 10 keV to 20 MeV. These energies span the range of medical X-ray machines and airport security scanners.
Why are cosmic rays intensifying? The main reason is the sun. Solar storm clouds such as coronal mass ejections (CMEs) sweep aside cosmic rays when they pass by Earth. During Solar Maximum, CMEs are abundant and cosmic rays are held at bay. Now, however, the solar cycle is swinging toward Solar Minimum, allowing cosmic rays to return. Another reason could be the weakening of Earth's magnetic field, which helps protect us from deep-space radiation.
| | The official U.S. government space weather bureau |
| | The first place to look for information about sundogs, pillars, rainbows and related phenomena. |
| | Researchers call it a "Hubble for the sun." SDO is the most advanced solar observatory ever. |
| | 3D views of the sun from NASA's Solar and Terrestrial Relations Observatory |
| | Realtime and archival images of the Sun from SOHO. |
| | from the NOAA Space Environment Center |
| | fun to read, but should be taken with a grain of salt! Forecasts looking ahead more than a few days are often wrong. |
| | from the NOAA Space Environment Center |
| | the underlying science of space weather |
 | To find reviews of new online casino sites in the UK try The Casino DB where there are hundreds of online casino reviews complete with bonuses and ratings. Get a bonus when playing at a new casino in the UK. The Genie got you covered! Looking for a new online casino? Try Casimpo the new site dedicated to making online casino simple and easy for all. |
| | These links help Spaceweather.com stay online. Thank you to our supporters! |
| | | | | | |


