This is an AI Free Zone! Text created by ChatGPT and other Large Language Models is spreading rapidly across the Internet. It's well-written, artificial, frequently inaccurate. If you find a mistake on Spaceweather.com, rest assured it was made by a real human being. | | |
QUIET WITH A CHANCE OF FLARES: Solar activity has been low for the past three days, but the quiet could be shortlived. There are currently three sunspot groups (3536, 3539, 3540) with unstable 'beta-gamma' magnetic fields. NOAA forecasters estimate a 45% chance of M-class flares and a 10% chance of X-flares on Jan. 8th. Solar flare alerts: SMS Text
THE POLAR VORTEX WOBBLED IN DECEMBER: Last month, sky watchers in Europe saw something rare and beautiful. A giant bank of polar stratospheric clouds (PSCs) escaped the Arctic Circle, and for more than a week they filled skies with rainbow color as far south as Italy. In the Italian commune of Sanfrè (latitude +45N), Pablo Javier Lucero was able to photograph the clouds at all hours of the day:
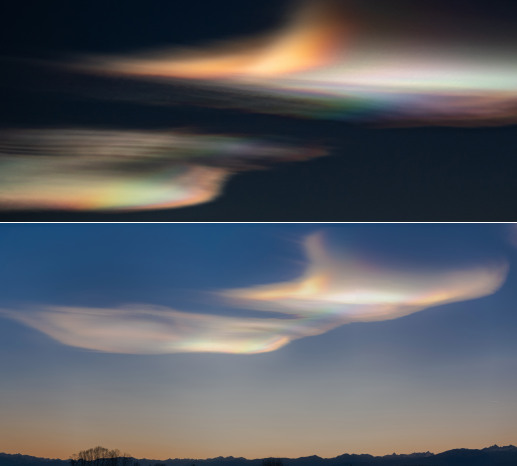
"Utterly incredible!" says Lucero. "I first saw the clouds at sunset on Dec. 22nd. After talking with a friend of mine, Jorgelina Alvarez, a meteorologist, we realized that these clouds weren't ordinary iridescent clouds, but rather Type II polar stratospheric clouds. My surprise was gigantic."
Surprise is the correct reaction. Normally, Earth's stratosphere has no clouds at all. Only when the temperature drops to a staggeringly-low -85 C can widely-spaced water molecules assemble into icy polar stratospheric clouds. With colors that rival auroras, PSCs are considered to be the most beautiful clouds on Earth.
During the outbreak, Spaceweather.com received hundreds of photos of PSCs. Curiously, they all came from Europe. 100%. No photos were received from North America or Asia. Why not?
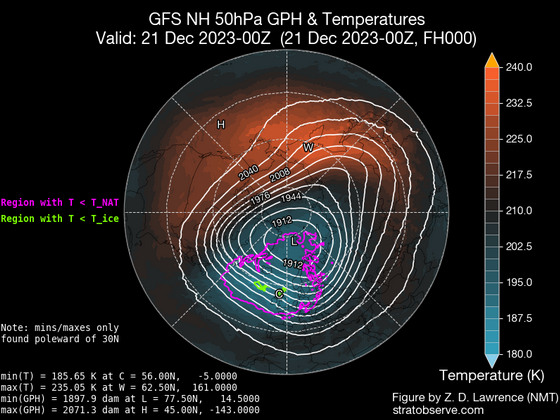
Amy Butler of NOAA's Chemical Sciences Laboratory has the answer: "The polar vortex can wobble like a top, and in December it was displaced towards Europe," she explains. "You can see this in the figure, below, from Zac Lawrence's website stratobserve.com."
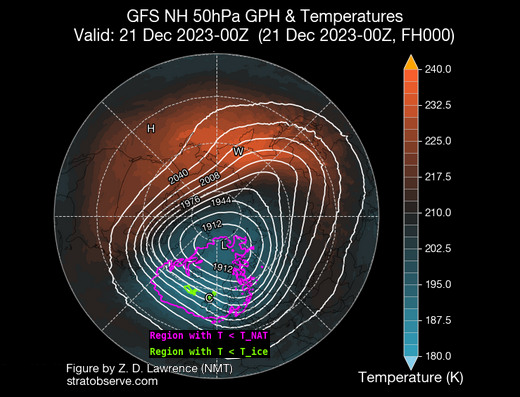
Cold air normally contained over the poles was carried by the wobbling vortex to mid-latitudes. Purple and green contours in the figure show where temperatures were cold enough for Type I and Type II PSCs, respectively.
Since the December outbreak of PSCs, which ended around Christmas, the polar stratosphere has warmed more than 10 degrees. Butler says this is probably the result of "a strong planetary wave breaking in the stratosphere." Wave energy warmed the air and dispersed the rainbow-colored clouds.
It could happen again, though; there's plenty of winter ahead. As January unfolds, the polar stratospheric vortex is still tilted toward the mid-latitudes of Europe. If the stratosphere cools, PSCs could re-appear over populated areas. You can monitor the situation with daily temperature reports right here on Spaceweather.com.
Recommended: Amy Butler writes a great Polar Vortex Blog for NOAA. Check it out!
Realtime Space Weather Photo Gallery
Free: Spaceweather.com Newsletter
VALENTINE'S CRYSTAL BEAR AND ROSE: Valentine's Day is coming. Looking for a far-out gift? This Crystal Bear and Rose flew to the stratosphere onboard a cosmic ray research balloon on Dec. 17th:
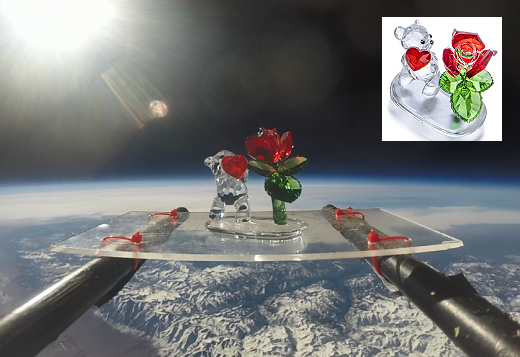
You can have it for $129.95. The students of Earth to Sky Calculus are selling space bears to support their high-altitude ballooning program. Each one comes with a greeting card showing the ursine astronaut in flight and telling the story of its journey to the edge of space and back again.
Far Out Gifts: Earth to Sky Store
All sales support hands-on STEM education
Realtime Aurora Photo Gallery
Free: Spaceweather.com Newsletter
Realtime Comet Photo Gallery
Free: Spaceweather.com Newsletter
Every night, a network of
NASA all-sky cameras scans the skies above the United States for meteoritic fireballs. Automated software maintained by NASA's Meteoroid Environment Office calculates their orbits, velocity, penetration depth in Earth's atmosphere and many other characteristics. Daily results are presented here on Spaceweather.com.
On Jan 06, 2024, the network reported 3 fireballs.
(2 sporadics, 1 December Leonis Minorid)
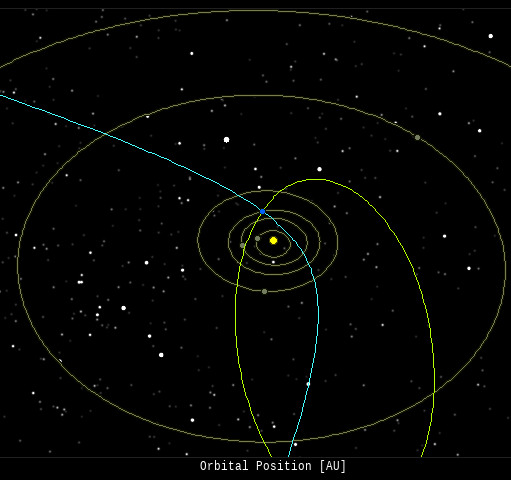
In this diagram of the inner solar system, all of the fireball orbits intersect at a single point--Earth. The orbits are color-coded by velocity, from slow (red) to fast (blue). [Larger image] [movies]
Potentially Hazardous Asteroids (
PHAs) are space rocks larger than approximately 100m that can come closer to Earth than 0.05 AU. None of the known PHAs is on a collision course with our planet, although astronomers are finding
new ones all the time.
On January 8, 2024 there were 2349 potentially hazardous asteroids.
 |
Recent & Upcoming Earth-asteroid encounters: | Asteroid | Date(UT) | Miss Distance | Velocity (km/s) | Diameter (m) |
| 2024 AD | 2024-Jan-04 | 0.6 LD | 9.9 | 6 |
| 2023 YX1 | 2024-Jan-06 | 10.1 LD | 14.3 | 39 |
| 2024 AH1 | 2024-Jan-06 | 9 LD | 9.6 | 22 |
| 2024 AC | 2024-Jan-06 | 6 LD | 6.8 | 27 |
| 2024 AM | 2024-Jan-07 | 3.2 LD | 9 | 10 |
| 2024 AW | 2024-Jan-07 | 11.2 LD | 8.5 | 26 |
| 2002 AY1 | 2024-Jan-08 | 15.2 LD | 17.3 | 230 |
| 2023 XN13 | 2024-Jan-09 | 15.8 LD | 1.4 | 8 |
| 2023 XT14 | 2024-Jan-10 | 12.2 LD | 6.4 | 27 |
| 2024 AN1 | 2024-Jan-10 | 4 LD | 7.9 | 20 |
| 2023 YO1 | 2024-Jan-10 | 6.8 LD | 3.1 | 23 |
| 2020 AC1 | 2024-Jan-11 | 19.3 LD | 5.3 | 7 |
| 2023 WZ3 | 2024-Jan-11 | 16.2 LD | 4 | 35 |
| 2021 CZ2 | 2024-Jan-16 | 8 LD | 14.3 | 113 |
| 2021 BL3 | 2024-Jan-23 | 17.2 LD | 23.4 | 41 |
| 2017 BG92 | 2024-Jan-25 | 11.8 LD | 6.3 | 6 |
| 2011 CQ1 | 2024-Jan-26 | 11.3 LD | 4.6 | 1 |
| 2007 EG | 2024-Jan-30 | 16 LD | 8.6 | 43 |
| 2008 OS7 | 2024-Feb-02 | 7.5 LD | 18.2 | 285 |
| 2019 CC5 | 2024-Feb-04 | 19.2 LD | 15 | 139 |
| 2023 SP1 | 2024-Feb-07 | 14.3 LD | 11.8 | 256 |
| 2020 DK | 2024-Feb-12 | 8.9 LD | 9.9 | 22 |
| 2024 AO | 2024-Feb-16 | 9.2 LD | 7.3 | 53 |
| 2019 DA1 | 2024-Mar-03 | 14.6 LD | 13.4 | 22 |
Notes: LD means "Lunar Distance." 1 LD = 384,401 km, the distance between Earth and the Moon. 1 LD also equals 0.00256 AU. | | Cosmic Rays in the Atmosphere |
SPACE WEATHER BALLOON DATA: Almost once a week, Spaceweather.com and the students of Earth to Sky Calculus fly space weather balloons to the stratosphere over California. These balloons are equipped with sensors that detect secondary cosmic rays, a form of radiation from space that can penetrate all the way down to Earth's surface. Our monitoring program has been underway without interruption for 7 years, resulting in a unique dataset of in situ atmospheric measurements.
Latest results (July 2022): Atmospheric radiation is decreasing in 2022. Our latest measurements in July 2022 registered a 6-year low:
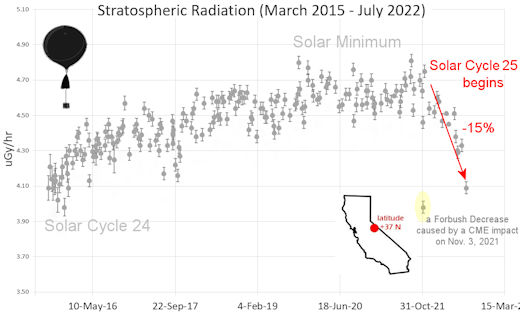
What's going on? Ironically, the radiation drop is caused by increasing solar activity. Solar Cycle 25 has roared to life faster than forecasters expected. The sun's strengthening and increasingly tangled magnetic field repels cosmic rays from deep space. In addition, solar coronal mass ejections (CMEs) sweep aside cosmic rays, causing sharp reductions called "Forbush Decreases." The two effects blend together to bring daily radiation levels down.
.Who cares? Cosmic rays are a surprisingly "down to Earth" form of space weather. They can alter the chemistry of the atmosphere, trigger lightning, and penetrate commercial airplanes. According to a study from the Harvard T.H. Chan school of public health, crews of aircraft have higher rates of cancer than the general population. The researchers listed cosmic rays, irregular sleep habits, and chemical contaminants as leading risk factors. A number of controversial studies (#1, #2, #3, #4) go even further, linking cosmic rays with cardiac arrhythmias and sudden cardiac death.
Technical notes: The radiation sensors onboard our helium balloons detect X-rays and gamma-rays in the energy range 10 keV to 20 MeV. These energies span the range of medical X-ray machines and airport security scanners.
Data points in the graph labeled "Stratospheric Radiation" correspond to the peak of the Regener-Pfotzer maximum, which lies about 67,000 feet above central California. When cosmic rays crash into Earth's atmosphere, they produce a spray of secondary particles that is most intense at the entrance to the stratosphere. Physicists Eric Regener and Georg Pfotzer discovered the maximum using balloons in the 1930s and it is what we are measuring today.
| | The official U.S. government space weather bureau |
| | The first place to look for information about sundogs, pillars, rainbows and related phenomena. |
| | Researchers call it a "Hubble for the sun." SDO is the most advanced solar observatory ever. |
| | 3D views of the sun from NASA's Solar and Terrestrial Relations Observatory |
| | Realtime and archival images of the Sun from SOHO. |
| | information about sunspots based on the latest NOAA/USAF Active Region Summary |
| | current counts of failed and deployed Starlink satellites from Jonathan's Space Page |
| | Authoritative predictions of space junk and satellite re-entries |
| | from the NOAA Space Environment Center |
| | fun to read, but should be taken with a grain of salt! Forecasts looking ahead more than a few days are often wrong. |
| | from the NOAA Space Environment Center |
| | the underlying science of space weather |
 | When looking for casinos to play online when the weather is bad, you can try the SkyCity Online Casino if you are located in New Zealand. If you are not from NZ you can try the Swedish page Svenska casino online to find suitable games, check out svenskacasinoonline.net. Always check your local laws before playing with real money.. |
| BestCSGOGambling is the best site for everything related to CSGO gambling on the web |
| | These links help Spaceweather.com stay online. Thank you to our supporters! |
| | | | | | |


