Solar minimum is here - but even now strangely beautiful auroras are dancing around the poles. Deep inside the Arctic Circle, the expert guides of Aurora Holidays in Utsjoki, Finland, can help you chase them. Book now! | | |
PENUMBRAL LUNAR ECLIPSE--TODAY: A pale shadow has just passed across the face of the full Moon. Sky watchers on the Eurasian side of Earth saw it, a penumbral lunar eclipse. This type of eclipse happens when the Moon passes through Earth's faint outer shadow. Penumbral lunar eclipses are easy to overlook, but they can be quite beautiful. See for yourself in Spaceweather.com's Lunar Eclipse Photo Gallery.
THE FAINTING OF BETELGEUSE: One day, perhaps in our lifetimes, perhaps a million years from now, the red giant Betelgeuse will dim a little–and then explode. The resulting supernova will rival the full Moon and cast shadows after dark, completely transforming the night skies of Earth. No wonder astronomers are closely tracking the current "fainting of Betelgeuse."
"Fainting" is an actual astronomical term. It means dimming, the opposite of brightening. And right now, Betelgeuse is definitely fainting.
Above: Betelgeuse photographed by Brian Ottum of Animas, New Mexico, 4 years apart: more.
Edward Guinan of Villanova University and colleagues caused a sensation among astronomers last month when they reported "[Betelgeuse] has been declining in brightness since October 2019, now reaching a modern all-time low of V = +1.12 mag on 07 December 2019 UT. Currently this is the faintest the star has been during our 25+ years of continuous monitoring."
Little did they know when they issued their telegram in December that Betelgeuse was about to become even fainter. “On 06 January 2020 UT, the magnitude of Betelgeuse was V = +1.37,” reports Guinan. That’s ~20% dimmer than the "modern all-time low" registered the month before.
This 3-year plot of the Villanova team’s data shows Betelgeuse’s rapid decline:
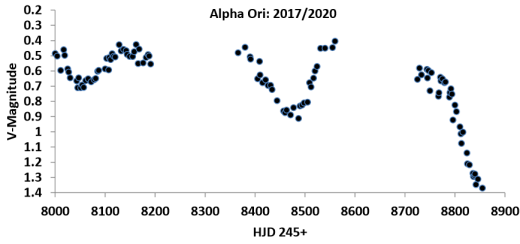
The horizontal axis is Heliospheric Julian Date (HJD). For reference, Jan. 6, 2020, the date of the most recent measurement, has an HJD of 2458855.
The fainting is easy to see with the naked eye. Not long ago, Betelgeuse was the 10th brightest star in the sky. Now it is the 21st. Observers of Orion rising in the east after sunset can’t help but notice that the Hunter’s shoulder is dimmer than it used to be.
Astronomers have long known that Betelgeuse is on the precipice of an energy crisis. It's about to run out of fuel in its core. When that happens, the star will collapse and rebound explosively, producing the first bright supernova in the Milky Way since 1604. Experts in stellar evolution believe Betelgeuse could die at any time during the next million years–a blink of an eye on time scales of astronomy.
Does the current dimming herald that final blast? Probably not. Betelgeuse is a slowly variable star, and this is probably no more than an episode of deeper-than-usual dimming. Of course, one day astronomers will think the same thing … and then the night sky will change forever.
A sharable version of this story is available here.
Realtime Spaceweather Photo Gallery
Free: Spaceweather.com Newsletter
SILK SPACE ROSE FOR VALENTINE'S DAY: Valentine's Day is coming, and nothing says "I love you" like a silk rose from the edge of space. On Jan. 4, 2020, the students of Earth to Sky Calculus launched their first cosmic ray balloon of 2020. This rose went along for the ride, traveling 111,424 feet above the Sierra Nevada mountains of central California:
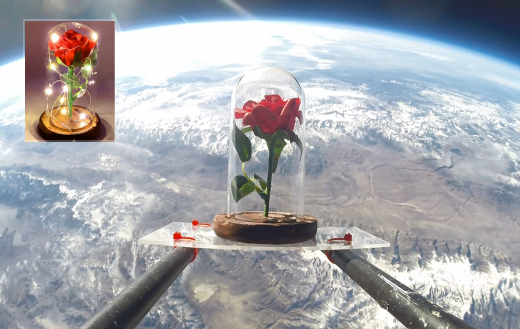
You can have it for $116.65. The students are selling Valentine's space roses to support their cosmic ray ballooning program. Each silk bloom comes with a greeting card showing the rose in flight and telling the story of its journey to the stratosphere and back again. Also included are the glass dome, wooden base, and an LED light kit to make your rose glisten like the stars.
Far Out Gifts: Earth to Sky Store
All sales support hands-on STEM education
SOLAR WIND SPARKS PINK & GREEN AURORAS: As predicted, a stream of solar wind grazed Earth's magnetic field on Jan. 8-9. First contact with the gaseous material sparked "a fantastic display" of auroras over Alaska. "It was the best I've seen in a very long time," reports Sacha Layos, who took this picture outside of Fairbanks:
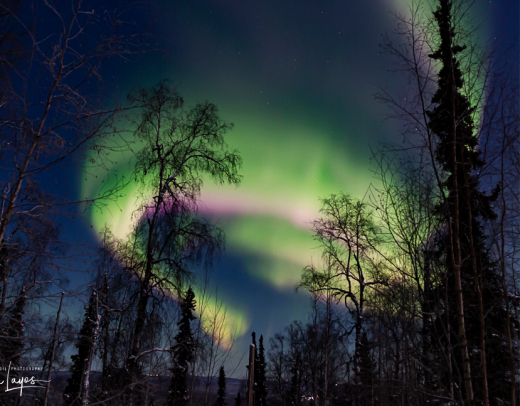
"Our temperatures are hovering around -40, so most folks were smarter than me and stayed inside by their wood stoves," she says. "I braved the cold and it turned out to be a spectacular night!"
Both Layos and another Fairbanks photographer, Thomas McCarty, noticed a pink border fringing the bottom of the green auroras. This is the "nitrogen fringe." Most auroras are green--the color of oxygen atoms being struck by energetic particles 100 km to 300 km above Earth's surface. Pink appears when energetic particles from space descend lower than usual, striking nitrogen molecules at the 100 km level and below.
Earth is still inside the solar wind stream on Jan. 10. Arctic sky watchers should be alert for more pink and green in the hours ahead. Aurora alerts: SMS Text.
Realtime Aurora Photo Gallery
Free: Spaceweather.com Newsletter
Every night, a network of
NASA all-sky cameras scans the skies above the United States for meteoritic fireballs. Automated software maintained by NASA's Meteoroid Environment Office calculates their orbits, velocity, penetration depth in Earth's atmosphere and many other characteristics. Daily results are presented here on Spaceweather.com.
On Jan. 10, 2020, the network reported 8 fireballs.
(7 sporadics, 1 alpha Hydrid)
In this diagram of the inner solar system, all of the fireball orbits intersect at a single point--Earth. The orbits are color-coded by velocity, from slow (red) to fast (blue). [Larger image] [movies]
Potentially Hazardous Asteroids (
PHAs) are space rocks larger than approximately 100m that can come closer to Earth than 0.05 AU. None of the known PHAs is on a collision course with our planet, although astronomers are finding
new ones all the time.
On January 10, 2020 there were 2018 potentially hazardous asteroids.
 |
Recent & Upcoming Earth-asteroid encounters: | Asteroid | Date(UT) | Miss Distance | Velocity (km/s) | Diameter (m) |
| 2020 AU1 | 2020-Jan-06 | 4.1 LD | 6.3 | 18 |
| 2020 AW | 2020-Jan-06 | 4.8 LD | 4.3 | 7 |
| 2019 YT3 | 2020-Jan-07 | 13.2 LD | 7.4 | 25 |
| 2020 AV1 | 2020-Jan-07 | 7.3 LD | 12.1 | 22 |
| 2020 AJ1 | 2020-Jan-07 | 13.6 LD | 22.2 | 81 |
| 2020 AR1 | 2020-Jan-08 | 6.9 LD | 9.6 | 13 |
| 2020 AT1 | 2020-Jan-09 | 2.5 LD | 6.2 | 11 |
| 2019 YV | 2020-Jan-10 | 17.3 LD | 4.5 | 69 |
| 2020 AL2 | 2020-Jan-10 | 6.2 LD | 24.8 | 27 |
| 2019 YF4 | 2020-Jan-10 | 3.7 LD | 2.9 | 15 |
| 2019 UO | 2020-Jan-10 | 11.8 LD | 9.4 | 331 |
| 2019 WC5 | 2020-Jan-11 | 6.4 LD | 13 | 110 |
| 2019 YV5 | 2020-Jan-11 | 16.8 LD | 13.9 | 48 |
| 2020 AO1 | 2020-Jan-12 | 8.5 LD | 17.7 | 65 |
| 2020 AB2 | 2020-Jan-12 | 3.8 LD | 7.9 | 15 |
| 2020 AE | 2020-Jan-13 | 11.7 LD | 6.8 | 25 |
| 2020 AX2 | 2020-Jan-13 | 10 LD | 6.8 | 29 |
| 2020 AS1 | 2020-Jan-13 | 15.8 LD | 5.7 | 17 |
| 2020 AE1 | 2020-Jan-13 | 6.6 LD | 4.2 | 12 |
| 2020 AO | 2020-Jan-14 | 9.3 LD | 19.5 | 48 |
| 2011 EP51 | 2020-Jan-15 | 19.6 LD | 7.1 | 32 |
| 2017 RZ15 | 2020-Jan-15 | 12.1 LD | 7.4 | 14 |
| 2020 AZ1 | 2020-Jan-16 | 8.3 LD | 4 | 17 |
| 2019 YD3 | 2020-Jan-16 | 6.9 LD | 4.8 | 22 |
| 2010 AE30 | 2020-Jan-17 | 11.9 LD | 12.3 | 68 |
| 2019 YG1 | 2020-Jan-17 | 17.5 LD | 4.5 | 32 |
| 2019 YQ3 | 2020-Jan-17 | 18.2 LD | 3.1 | 18 |
| 2020 AD1 | 2020-Jan-17 | 9.1 LD | 4.5 | 19 |
| 2020 AH1 | 2020-Jan-18 | 15.9 LD | 8 | 45 |
| 2009 BH2 | 2020-Jan-18 | 14.6 LD | 17.9 | 118 |
| 2019 YA5 | 2020-Jan-19 | 11.7 LD | 5.2 | 22 |
| 2020 AQ1 | 2020-Jan-20 | 10.6 LD | 27.6 | 135 |
| 2013 DU | 2020-Jan-20 | 14.9 LD | 6.4 | 59 |
| 2019 TF2 | 2020-Jan-23 | 16.2 LD | 1.6 | 18 |
| 2018 BM5 | 2020-Jan-23 | 13.1 LD | 8.6 | 12 |
| 2018 AL12 | 2020-Jan-30 | 18.2 LD | 17.7 | 39 |
| 2017 AE5 | 2020-Feb-01 | 13.6 LD | 9 | 135 |
| 2018 BU1 | 2020-Feb-02 | 19.4 LD | 10 | 41 |
| 163373 | 2020-Feb-15 | 15.1 LD | 15.2 | 589 |
| 2018 CW2 | 2020-Feb-17 | 6 LD | 10.2 | 28 |
| 2019 BE5 | 2020-Feb-20 | 13.9 LD | 14.8 | 34 |
| 2011 DR | 2020-Feb-23 | 14.7 LD | 5.8 | 25 |
| 2016 CO246 | 2020-Feb-23 | 18.4 LD | 5.9 | 23 |
| 2012 DS30 | 2020-Feb-26 | 12.3 LD | 5.4 | 22 |
| 2015 BK509 | 2020-Feb-28 | 18.3 LD | 12.5 | 118 |
| 2017 BM123 | 2020-Mar-01 | 10.5 LD | 8.1 | 65 |
Notes: LD means "Lunar Distance." 1 LD = 384,401 km, the distance between Earth and the Moon. 1 LD also equals 0.00256 AU. MAG is the visual magnitude of the asteroid on the date of closest approach. | | Cosmic Rays in the Atmosphere |
SOMETHING NEW! We have developed a new predictive model of aviation radiation. It's called E-RAD--short for Empirical RADiation model. We are constantly flying radiation sensors onboard airplanes over the US and and around the world, so far collecting more than 22,000 gps-tagged radiation measurements. Using this unique dataset, we can predict the dosage on any flight over the USA with an error no worse than 15%.
E-RAD lets us do something new: Every day we monitor approximately 1400 flights criss-crossing the 10 busiest routes in the continental USA. Typically, this includes more than 80,000 passengers per day. E-RAD calculates the radiation exposure for every single flight.
The Hot Flights Table is a daily summary of these calculations. It shows the 5 charter flights with the highest dose rates; the 5 commercial flights with the highest dose rates; 5 commercial flights with near-average dose rates; and the 5 commercial flights with the lowest dose rates. Passengers typically experience dose rates that are 20 to 70 times higher than natural radiation at sea level.
To measure radiation on airplanes, we use the same sensors we fly to the stratosphere onboard Earth to Sky Calculus cosmic ray balloons: neutron bubble chambers and X-ray/gamma-ray Geiger tubes sensitive to energies between 10 keV and 20 MeV. These energies span the range of medical X-ray machines and airport security scanners.
Column definitions: (1) The flight number; (2) The maximum dose rate during the flight, expressed in units of natural radiation at sea level; (3) The maximum altitude of the plane in feet above sea level; (4) Departure city; (5) Arrival city; (6) Duration of the flight.
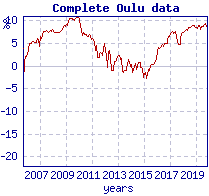
SPACE WEATHER BALLOON DATA: Approximately once a week, Spaceweather.com and the students of Earth to Sky Calculus fly space weather balloons to the stratosphere over California. These balloons are equipped with radiation sensors that detect cosmic rays, a surprisingly "down to Earth" form of space weather. Cosmic rays can seed clouds, trigger lightning, and penetrate commercial airplanes. Furthermore, there are studies ( #1, #2, #3, #4) linking cosmic rays with cardiac arrhythmias and sudden cardiac death in the general population. Our latest measurements show that cosmic rays are intensifying, with an increase of more than 18% since 2015:

The data points in the graph above correspond to the peak of the Reneger-Pfotzer maximum, which lies about 67,000 feet above central California. When cosmic rays crash into Earth's atmosphere, they produce a spray of secondary particles that is most intense at the entrance to the stratosphere. Physicists Eric Reneger and Georg Pfotzer discovered the maximum using balloons in the 1930s and it is what we are measuring today.
En route to the stratosphere, our sensors also pass through aviation altitudes:

In this plot, dose rates are expessed as multiples of sea level. For instance, we see that boarding a plane that flies at 25,000 feet exposes passengers to dose rates ~10x higher than sea level. At 40,000 feet, the multiplier is closer to 50x.
The radiation sensors onboard our helium balloons detect X-rays and gamma-rays in the energy range 10 keV to 20 MeV. These energies span the range of medical X-ray machines and airport security scanners.
Why are cosmic rays intensifying? The main reason is the sun. Solar storm clouds such as coronal mass ejections (CMEs) sweep aside cosmic rays when they pass by Earth. During Solar Maximum, CMEs are abundant and cosmic rays are held at bay. Now, however, the solar cycle is swinging toward Solar Minimum, allowing cosmic rays to return. Another reason could be the weakening of Earth's magnetic field, which helps protect us from deep-space radiation.
| | The official U.S. government space weather bureau |
| | The first place to look for information about sundogs, pillars, rainbows and related phenomena. |
| | Researchers call it a "Hubble for the sun." SDO is the most advanced solar observatory ever. |
| | 3D views of the sun from NASA's Solar and Terrestrial Relations Observatory |
| | Realtime and archival images of the Sun from SOHO. |
| | from the NOAA Space Environment Center |
| | fun to read, but should be taken with a grain of salt! Forecasts looking ahead more than a few days are often wrong. |
| | from the NOAA Space Environment Center |
| | the underlying science of space weather |
 | To find reviews of new online casino sites in the UK try The Casino DB where there are hundreds of online casino reviews complete with bonuses and ratings. Get a bonus when playing at a new casino in the UK. The Genie got you covered! Looking for a new online casino? Try Casimpo the new site dedicated to making online casino simple and easy for all. |
| | These links help Spaceweather.com stay online. Thank you to our supporters! |
| | | | | | |


