 | | |  Solar wind Solar wind
speed: 357.5 km/sec
density: 4.3 protons/cm3
explanation | more data
Updated: Today at 2345 UT X-ray Solar Flares
6-hr max: A8 1749 UT Nov18
24-hr: B1 1303 UT Nov18
explanation | more data
Updated: Today at: 2300 UT  Daily Sun: 18 Nov 19 Daily Sun: 18 Nov 19 The sun is blank--no sunspots. Credit: SDO/HMI The sun is blank--no sunspots. Credit: SDO/HMI
 Sunspot number: 0
What is the sunspot number?
Updated 18 Nov 2019
Spotless Days
Current Stretch: 5 days
2019 total: 241 days (75%)
2018 total: 221 days (61%)
2017 total: 104 days (28%)
2016 total: 32 days (9%)
2015 total: 0 days (0%)
2014 total: 1 day (<1%)
2013 total: 0 days (0%)
2012 total: 0 days (0%)
2011 total: 2 days (<1%)
2010 total: 51 days (14%)
2009 total: 260 days (71%)
2008 total: 268 days (73%)
2007 total: 152 days (42%)
2006 total: 70 days (19%)
Updated 18 Nov 2019
Thermosphere Climate Index
today: 3.69x10¹⁰ W Cold
Max: 49.4x10¹⁰ W Hot (10/1957)
Min: 2.05x10¹⁰ W Cold (02/2009)
explanation | more data: gfx, txt
Updated 18 Nov 2019 The Radio Sun
10.7 cm flux: 70 sfu
explanation | more data
Updated 18 Nov 2019 Cosmic Rays Solar minimum is underway. The sun's magnetic field is weak, allowing extra cosmic rays into the solar system. Neutron counts from the University of Oulu's Sodankyla Geophysical Observatory show that cosmic rays reaching Earth in 2019 are near a Space Age peak.
Oulu Neutron Counts
Percentages of the Space Age average:
today: +9.5% High
7-day change: +0.4%
Max: +11.7% Very High (12/2009)
Min: -32.1% Very Low (06/1991)
explanation | more data
Updated 18 Nov 2019 @ 1800 UT 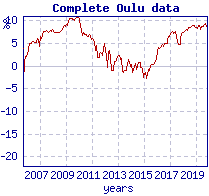
Since 2015, Earth to Sky cosmic ray balloons launched weekly from California have also detected significant increases in atmospheric radiation. Dose rates reported below are in the stratosphere at approx. 100,000 ft.
California Cosmic Ray Balloons
Monitoring started in March 2015
now: 4.46 uGy/hr High
change since 2015: +18%
Max: 4.79 uGy/hr High (10/2019)
Min: 3.80 uGy/hr Low (05/2015)
explanation | more data
Updated 16 Nov 2019 Current Auroral Oval: Switch to: Europe, USA, New Zealand, Antarctica Credit: NOAA/Ovation Planetary K-index
Now: Kp= 1 quiet
24-hr max: Kp= 1 quiet
explanation | more data
Interplanetary Mag. Field
Btotal: 3.9 nT
Bz: -0.2 nT south
more data: ACE, DSCOVR
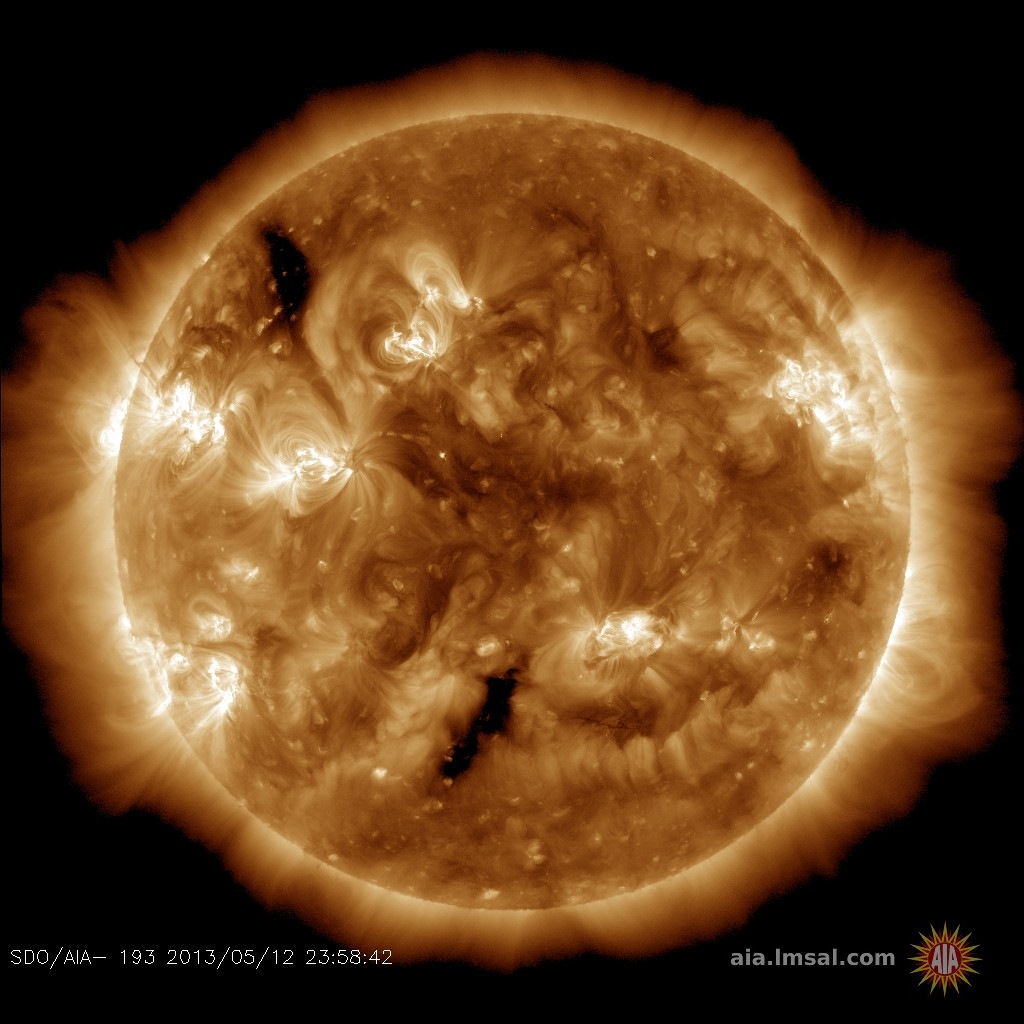
Updated: Today at 2346 UT Coronal Holes: 18 Nov 19 
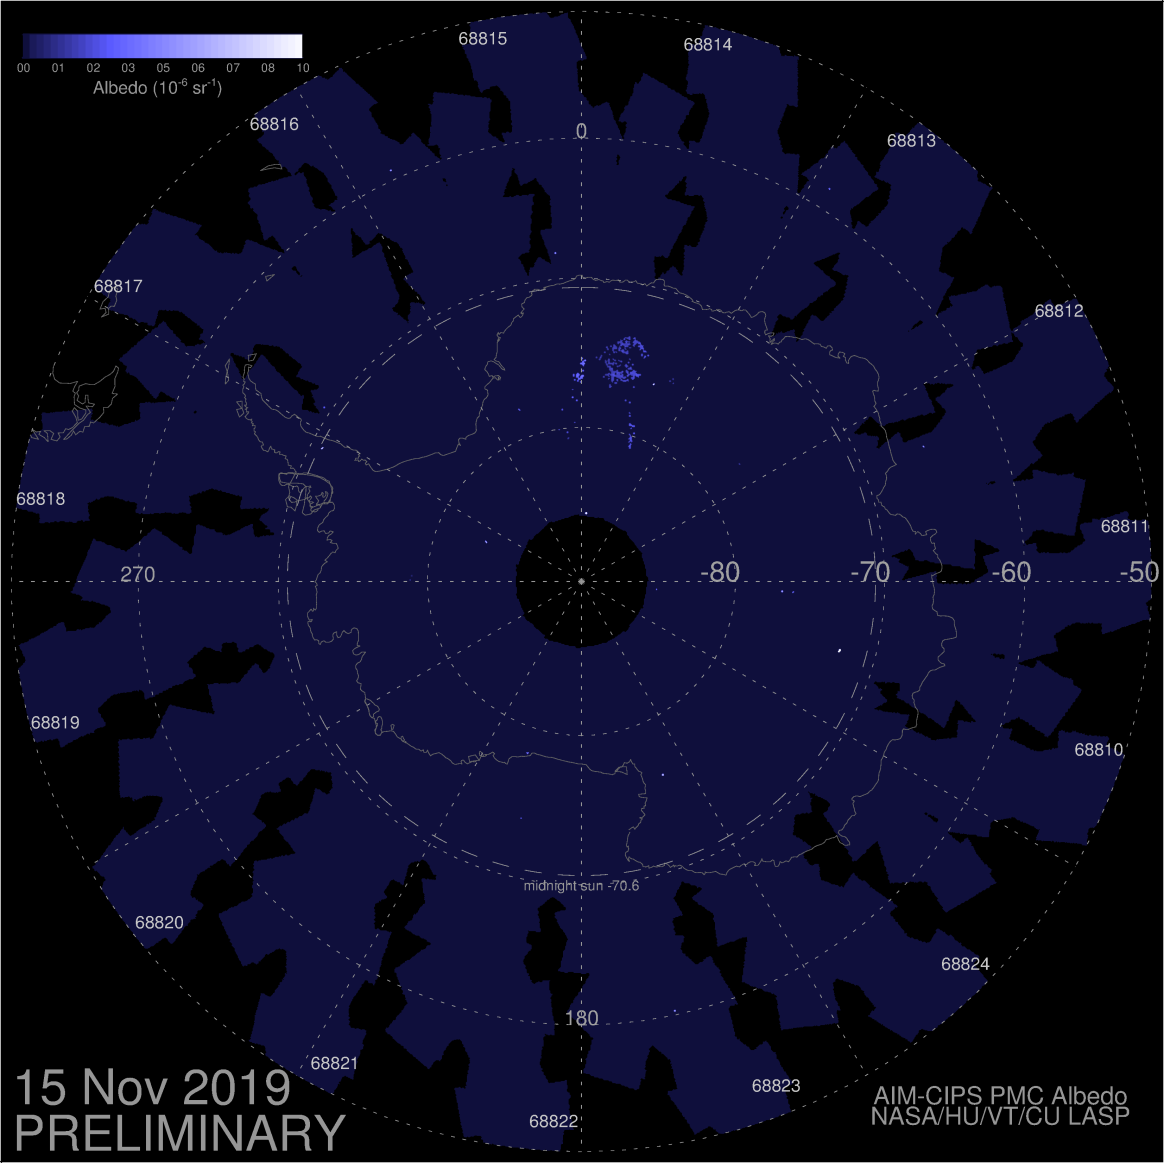
Solar wind flowing from the indicated coronal hole will reach Earth on Nov. 20-21. Credit: SDO/AIA Noctilucent Clouds The southern hemisphere season for noctilucent clouds began on Nov. 15th--the earliest start in recorded history. Check here for daily images from NASA's AIM spacecraft. Switch view: Europe, USA, Asia, Polar Updated at: 11-17-2019 17:55:03 UT SPACE WEATHER
NOAA Forecasts | | Updated at: 2019 Nov 18 2200 UTC FLARE | 0-24 hr | 24-48 hr | CLASS M | 01 % | 01 % | CLASS X | 01 % | 01 % | Geomagnetic Storms:
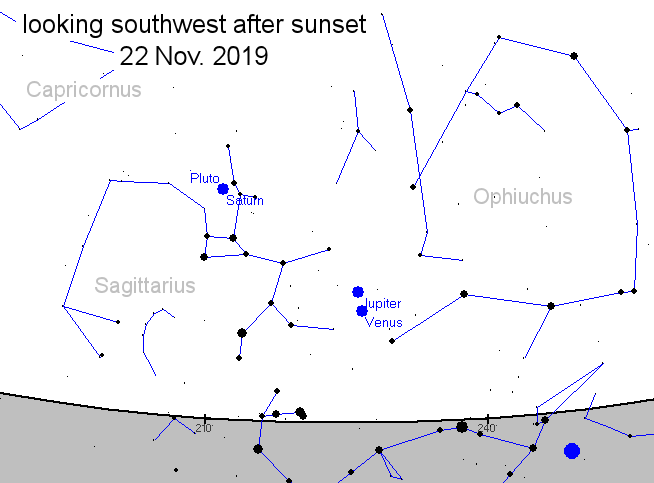
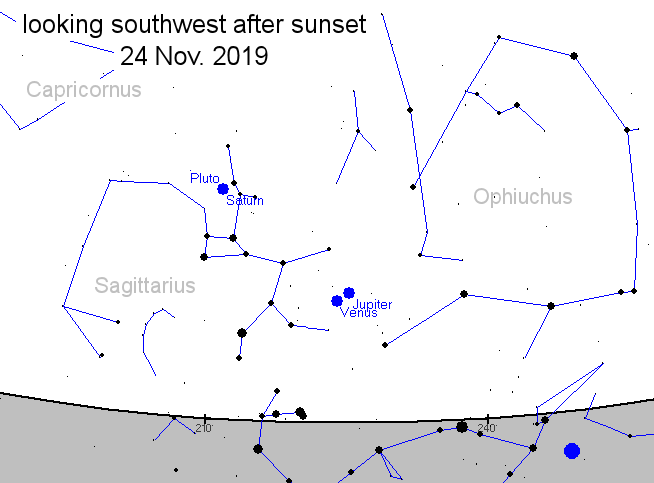
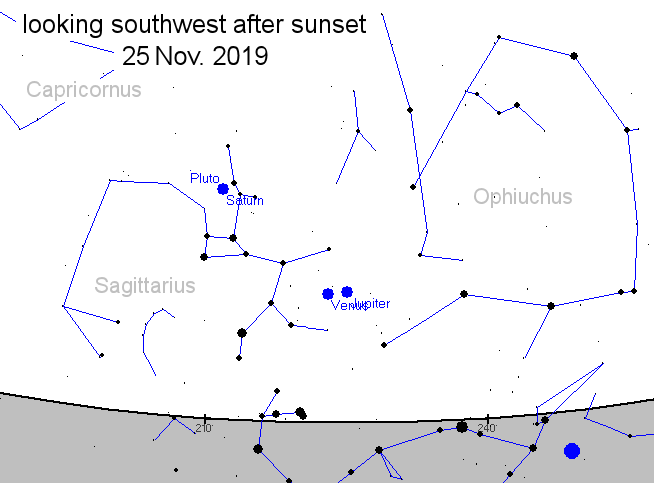
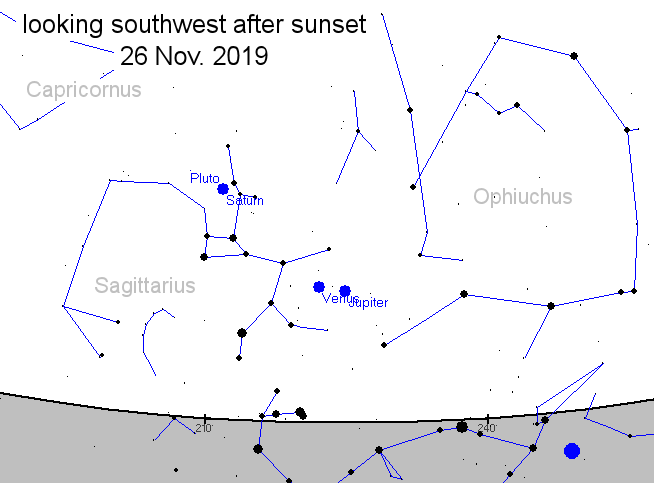
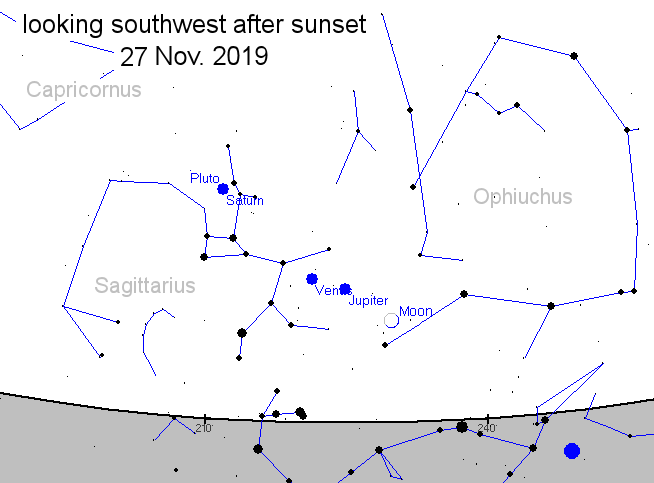
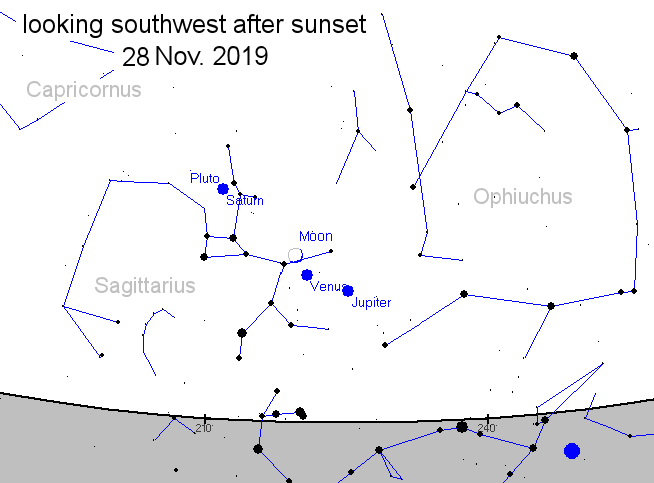
Probabilities for significant disturbances in Earth's magnetic field are given for three activity levels: active, minor storm, severe storm Updated at: 2019 Nov 18 2200 UTC Mid-latitudes | 0-24 hr | 24-48 hr | ACTIVE | 15 % | 35 % | MINOR | 05 % | 20 % | SEVERE | 01 % | 05 % | High latitudes | 0-24 hr | 24-48 hr | ACTIVE | 15 % | 10 % | MINOR | 25 % | 25 % | SEVERE | 25 % | 50 % | | | |  | | | | | | | | | | | Solar minimum is here - but even now strangely beautiful auroras are dancing around the poles. Deep inside the Arctic Circle, the expert guides of Aurora Holidays in Utsjoki, Finland, can help you chase them. Book now! | | | COMING SOON--A SUNSET CONJUNCTION: Planets are gathering in the sunset sky. During the third week of November, Venus and Jupiter will converge for a beautiful conjunction above the southwestern horizon--only 1.4 degrees apart on Nov. 24th. Then, a whisper-thin crescent Moon will join them, forming a celestial triangle on Nov. 27th and 28th. Don't miss it! Sky maps: Nov. 21, 22, 23, 24, 25, 26, 27, 28. NOCTILUCENT CLOUDS ARE FORMING OVER ANTARCTICA: The southern season for noctilucent clouds (NLCs) is underway, according to new observations from NASA's AIM spacecraft. "On Nov. 15th, AIM detected a small cloud over eastern Antarctica," reports Cora Randall of the University of Colorado's Laboratory for Atmospheric and Space Physics. "This is the earliest we have seen NLCs appear since the AIM mission began in 2007." Note the electric-blue puff over Dronning Maud Land in this image taken by AIM's CIPS instrument: 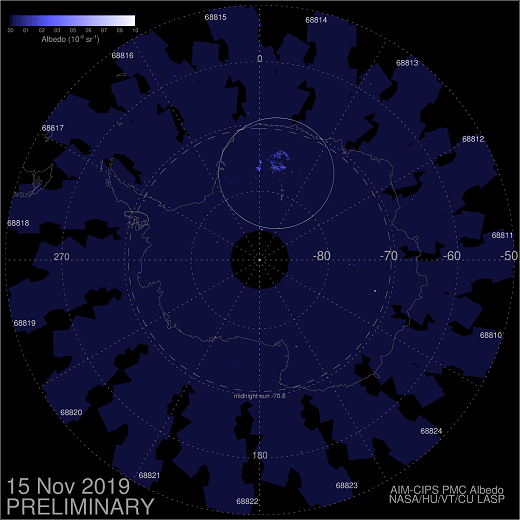
NLCs are Earth's highest clouds. They form around the poles when summertime water vapor billows up into the high atmosphere, crystallizing around specks of meteor smoke at the edge of space. Antarctic NLCs typically appear in mid- to -late November. This year's early apparition on Nov. 15th breaks the earlier mark of Nov. 17th set in 2013 and 2016. If history is any guide, that little puff of blue is about to expand dramatically. Previous data from AIM spacecraft show that noctilucent clouds are like a great "geophysical light bulb." They turn on in late spring (in this case, austral spring) and reach almost full intensity over a period of no more than 5 to 10 days. A week from now, the entire South Pole could be ringed by electric blue clouds. Stay tuned! Realtime NLC Photo Gallery
Free: Spaceweather.com Newsletter THE MAGNETIC AFTERGLOW OF A SOLAR WIND STREAM: This weekend, Arctic skies turned green as a minor stream of solar wind buffeted Earth's magnetic field. Chris Hodgson photographed the geomagnetic glow on Nov. 17th from Abisko, Sweden: 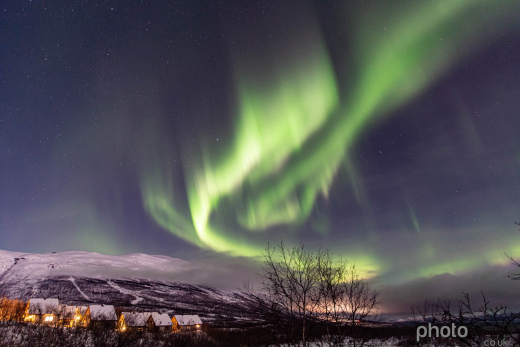
"The tail end of the solar wind stream kicked off a huge display over Abisko," says Hodgson, who is a tour guide for Lights over Lapland. "Our guests got a great show." How did a minor stream produce such bright auroras? Solar wind speeds never rose above 450 km/s. The answer may be found in this chart recording from a magnetometer in Britain: 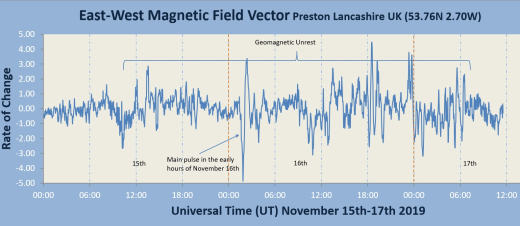
"The wiggles on the chart caused by the passing solar wind stream are plain to see," says Stuart Green of Preston UK, who operates a research-grade magnetic observatory in his back garden. "They show how the geomagnetic field was disturbed--literally shaking back and forth--during the solar wind event."
Although the solar wind stream was not very speedy, it was clearly effective in rattling Earth's magnetic field. And that's why the auroras were so good. Imagine a tree in autumn buffeted by wind, its leaves fluttering to the ground. Likewise, charged particles in Earth's magnetosphere were shaken loose by the action of the wind (in this case, solar wind). They rained down upon the upper atmosphere, causing polar skies to glow. Realtime Aurora Photo Gallery
Free: Spaceweather.com Newsletter ANNIE JUMP CANNON IN THE STRATOSPHERE: Pioneering astronomer Annie Jump Cannon invented the modern system of stellar classification. To honor her, the US Mint has created a $1 American Innovation coin featuring Cannon's silhouette and a spray of stars. On Nov. 11th, the students of Earth to Sky Calculus flew some to the stratosphere, 111,221 feet above the Sierra Nevada mountains of central California:
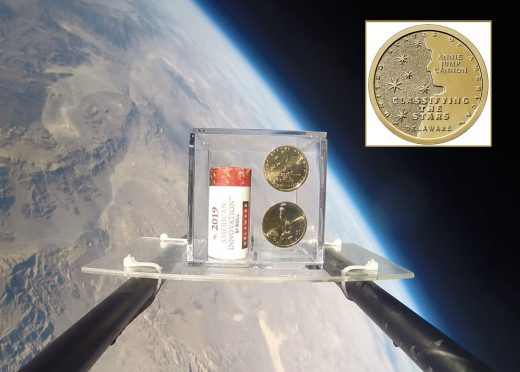
You can have a roll of 25 for $149.95. The students are selling the coins to support their cosmic ray ballooning program. Each roll contains 25 one dollar coins with uncirculated finishes. Cannon is shown on one side and the Statue of Liberty on the other. Individual coins make great Christmas stocking stuffers for young scientists--or give the whole roll as a special gift. Your order comes with a greeting card showing the coins in flight. Far Out Gifts: Earth to Sky Store
All sales support hands-on STEM education
Realtime Spaceweather Photo Gallery
Free: Spaceweather.com Newsletter
Every night, a network of NASA all-sky cameras scans the skies above the United States for meteoritic fireballs. Automated software maintained by NASA's Meteoroid Environment Office calculates their orbits, velocity, penetration depth in Earth's atmosphere and many other characteristics. Daily results are presented here on Spaceweather.com. On Nov. 18, 2019, the network reported 26 fireballs.
(12 sporadics, 11 Leonids, 3 northern Taurids)  In this diagram of the inner solar system, all of the fireball orbits intersect at a single point--Earth. The orbits are color-coded by velocity, from slow (red) to fast (blue). [Larger image] [movies] Potentially Hazardous Asteroids ( PHAs) are space rocks larger than approximately 100m that can come closer to Earth than 0.05 AU. None of the known PHAs is on a collision course with our planet, although astronomers are finding new ones all the time. On November 18, 2019 there were 2018 potentially hazardous asteroids.
 | Recent & Upcoming Earth-asteroid encounters: | Asteroid | Date(UT) | Miss Distance | Velocity (km/s) | Diameter (m) | | 2019 UH1 | 2019-Nov-13 | 9.5 LD | 9.1 | 52 | | 2019 UN12 | 2019-Nov-13 | 3.8 LD | 28.8 | 146 | | 2019 VX | 2019-Nov-13 | 4.1 LD | 10.8 | 31 | | 2019 VU5 | 2019-Nov-14 | 3.5 LD | 22.6 | 45 | | 2019 UE8 | 2019-Nov-15 | 7.7 LD | 6.6 | 26 | | 2019 WD | 2019-Nov-15 | 2.5 LD | 8.6 | 20 | | 2019 VL5 | 2019-Nov-15 | 9.3 LD | 8.4 | 25 | | 2019 WC | 2019-Nov-17 | 9.2 LD | 7.6 | 19 | | 2019 UR2 | 2019-Nov-18 | 18 LD | 13.4 | 132 | | 2019 UK6 | 2019-Nov-20 | 15.4 LD | 7.8 | 64 | | 2019 WF | 2019-Nov-20 | 1.6 LD | 11.6 | 15 | | 2019 WE | 2019-Nov-20 | 3.3 LD | 8.5 | 16 | | 481394 | 2019-Nov-21 | 11.3 LD | 7.9 | 372 | | 2019 VK | 2019-Nov-21 | 5.8 LD | 7.6 | 43 | | 2008 EA9 | 2019-Nov-23 | 10.5 LD | 2.2 | 10 | | 2019 VF1 | 2019-Nov-25 | 13.3 LD | 17.2 | 89 | | 2017 AP4 | 2019-Dec-03 | 8.5 LD | 7.5 | 15 | | 2018 XW2 | 2019-Dec-07 | 17.4 LD | 13 | 28 | | 2019 VH5 | 2019-Dec-08 | 18.1 LD | 9.8 | 70 | | 216258 | 2019-Dec-20 | 15.3 LD | 11.8 | 324 | | 2013 XY20 | 2019-Dec-21 | 18.4 LD | 1.9 | 28 | | 2017 XQ60 | 2019-Dec-22 | 11 LD | 15.6 | 47 | | 310442 | 2019-Dec-26 | 19 LD | 12.3 | 372 | | 2019 AE3 | 2020-Jan-02 | 4.9 LD | 8.2 | 13 | | 2019 UO | 2020-Jan-10 | 11.8 LD | 9.4 | 377 | | 2011 EP51 | 2020-Jan-15 | 19.6 LD | 7.1 | 32 | | 2017 RZ15 | 2020-Jan-15 | 12.1 LD | 7.4 | 14 | Notes: LD means "Lunar Distance." 1 LD = 384,401 km, the distance between Earth and the Moon. 1 LD also equals 0.00256 AU. MAG is the visual magnitude of the asteroid on the date of closest approach. | | Cosmic Rays in the Atmosphere | SOMETHING NEW! We have developed a new predictive model of aviation radiation. It's called E-RAD--short for Empirical RADiation model. We are constantly flying radiation sensors onboard airplanes over the US and and around the world, so far collecting more than 22,000 gps-tagged radiation measurements. Using this unique dataset, we can predict the dosage on any flight over the USA with an error no worse than 15%. E-RAD lets us do something new: Every day we monitor approximately 1400 flights criss-crossing the 10 busiest routes in the continental USA. Typically, this includes more than 80,000 passengers per day. E-RAD calculates the radiation exposure for every single flight. The Hot Flights Table is a daily summary of these calculations. It shows the 5 charter flights with the highest dose rates; the 5 commercial flights with the highest dose rates; 5 commercial flights with near-average dose rates; and the 5 commercial flights with the lowest dose rates. Passengers typically experience dose rates that are 20 to 70 times higher than natural radiation at sea level. To measure radiation on airplanes, we use the same sensors we fly to the stratosphere onboard Earth to Sky Calculus cosmic ray balloons: neutron bubble chambers and X-ray/gamma-ray Geiger tubes sensitive to energies between 10 keV and 20 MeV. These energies span the range of medical X-ray machines and airport security scanners. Column definitions: (1) The flight number; (2) The maximum dose rate during the flight, expressed in units of natural radiation at sea level; (3) The maximum altitude of the plane in feet above sea level; (4) Departure city; (5) Arrival city; (6) Duration of the flight. SPACE WEATHER BALLOON DATA: Approximately once a week, Spaceweather.com and the students of Earth to Sky Calculus fly space weather balloons to the stratosphere over California. These balloons are equipped with radiation sensors that detect cosmic rays, a surprisingly "down to Earth" form of space weather. Cosmic rays can seed clouds, trigger lightning, and penetrate commercial airplanes. Furthermore, there are studies ( #1, #2, #3, #4) linking cosmic rays with cardiac arrhythmias and sudden cardiac death in the general population. Our latest measurements show that cosmic rays are intensifying, with an increase of more than 18% since 2015: 
The data points in the graph above correspond to the peak of the Reneger-Pfotzer maximum, which lies about 67,000 feet above central California. When cosmic rays crash into Earth's atmosphere, they produce a spray of secondary particles that is most intense at the entrance to the stratosphere. Physicists Eric Reneger and Georg Pfotzer discovered the maximum using balloons in the 1930s and it is what we are measuring today. En route to the stratosphere, our sensors also pass through aviation altitudes: 
In this plot, dose rates are expessed as multiples of sea level. For instance, we see that boarding a plane that flies at 25,000 feet exposes passengers to dose rates ~10x higher than sea level. At 40,000 feet, the multiplier is closer to 50x. The radiation sensors onboard our helium balloons detect X-rays and gamma-rays in the energy range 10 keV to 20 MeV. These energies span the range of medical X-ray machines and airport security scanners. Why are cosmic rays intensifying? The main reason is the sun. Solar storm clouds such as coronal mass ejections (CMEs) sweep aside cosmic rays when they pass by Earth. During Solar Maximum, CMEs are abundant and cosmic rays are held at bay. Now, however, the solar cycle is swinging toward Solar Minimum, allowing cosmic rays to return. Another reason could be the weakening of Earth's magnetic field, which helps protect us from deep-space radiation. | | The official U.S. government space weather bureau | | | The first place to look for information about sundogs, pillars, rainbows and related phenomena. | | | Researchers call it a "Hubble for the sun." SDO is the most advanced solar observatory ever. | | | 3D views of the sun from NASA's Solar and Terrestrial Relations Observatory | | | Realtime and archival images of the Sun from SOHO. | | | from the NOAA Space Environment Center | | | fun to read, but should be taken with a grain of salt! Forecasts looking ahead more than a few days are often wrong. | | | from the NOAA Space Environment Center | | | the underlying science of space weather |  | To find reviews of new online casino sites in the UK try The Casino DB where there are hundreds of online casino reviews complete with bonuses and ratings. Get a bonus when playing at a new casino in the UK. The Genie got you covered! Looking for a new online casino? Try Casimpo the new site dedicated to making online casino simple and easy for all. | | | These links help Spaceweather.com stay online. Thank you to our supporters! | | | | | | | | |  | | |  | ©2019 Spaceweather.com. All rights reserved. This site is penned daily by Dr. Tony Phillips. | |


