Marianne’s Arctic tours: Operating in small groups of 7 to 14 persons--all needs supplied for safety, comfort and pleasure. Night & day photography or non-photographic landscape - wildlife tours. Click for details! | | |
SUBSIDING GEOMAGNETIC STORM: The first geomagnetic storm of 2020 (category G1) took forecasters by surprise this morning when a CME impact sparked bright auroras over Canada and some northern-tier US states. After 6 hours of G1-class storming, Earth's magnetic field is quieting now, lowering the odds of more auroras tonight. Aurora alerts: SMS Text.
"Northern lights danced across the entire northwestern Montana sky early this morning," reports Philip Granrud. "I photographed them with a wide angle lens on top of my car several miles outside of Kalispell."
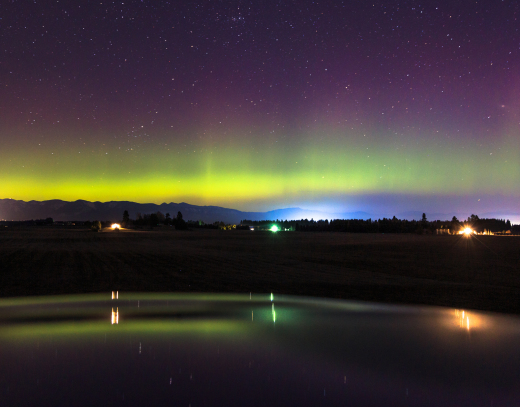
"It was such a nice break from everything that's been going on in the world lately," he says.
This is the first geomagnetic storm of 2020. In fact, the last time storm levels reached G1 on NOAA Storm Scales was more than a year ago: March 16-17, 2019.
The cause of the storm appears to be a faint slow-moving CME (coronal mass ejection) that left the sun on April 15th, shown here in an animation from the Solar and Heliospheric Observatory (SOHO):
This CME was not squarely Earth-directed, and forecasters did not think it was likely to hit our planet. Nevertheless, it apparently did. Solar wind data suggest that the CME sideswiped Earth with a snowplow-like buildup of plasma shortly after 0130 UT on April 20th.
Did you miss the storm? Subscribers to our Space Weather Alert Service received real-time text messages alerting them to this event. Pro Plan subscribers were forewarned when cracks began to appear in Earth's magnetic field immediately following the CME impact. Basic Plan subscribers received text messages as soon as the G1-storm erupted. Sign up now and never miss another geomagnetic storm.
Realtime Aurora Photo Gallery
Free: Spaceweather.com Newsletter
A BLACK PEARL IN THE STRATOSPHERE: It came from Tahiti--and now it's been to the edge of space. On Feb. 27, 2020, this genuine Black Tahitian South Sea Cultured Pearl flew to the stratosphere onboard an Earth to Sky Calculus cosmic ray balloon, soaring more than 100,000 feet above the Sierra Nevada mountains of central California:
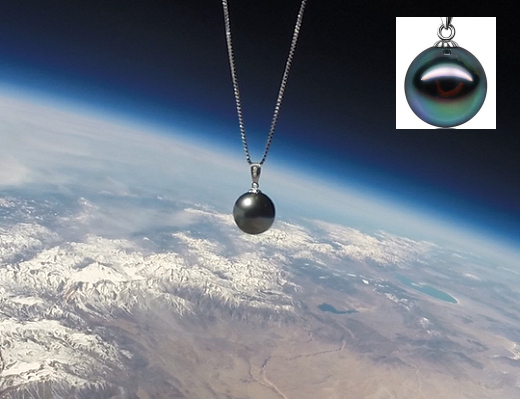
You can have it for $229.95. The students are selling these exotic space pearls to fund their cosmic ray monitoring program. Measuring 10 mm in diameter, the pearl has an 18K white gold clasp and is suspended from a matching 925 Sterling Silver chain. Each pearl comes with a greeting card showing the pendant in flight and telling the story of its journey to the edge of space.
Far Out Gifts: Earth to Sky Store
All sales support hands-on STEM education
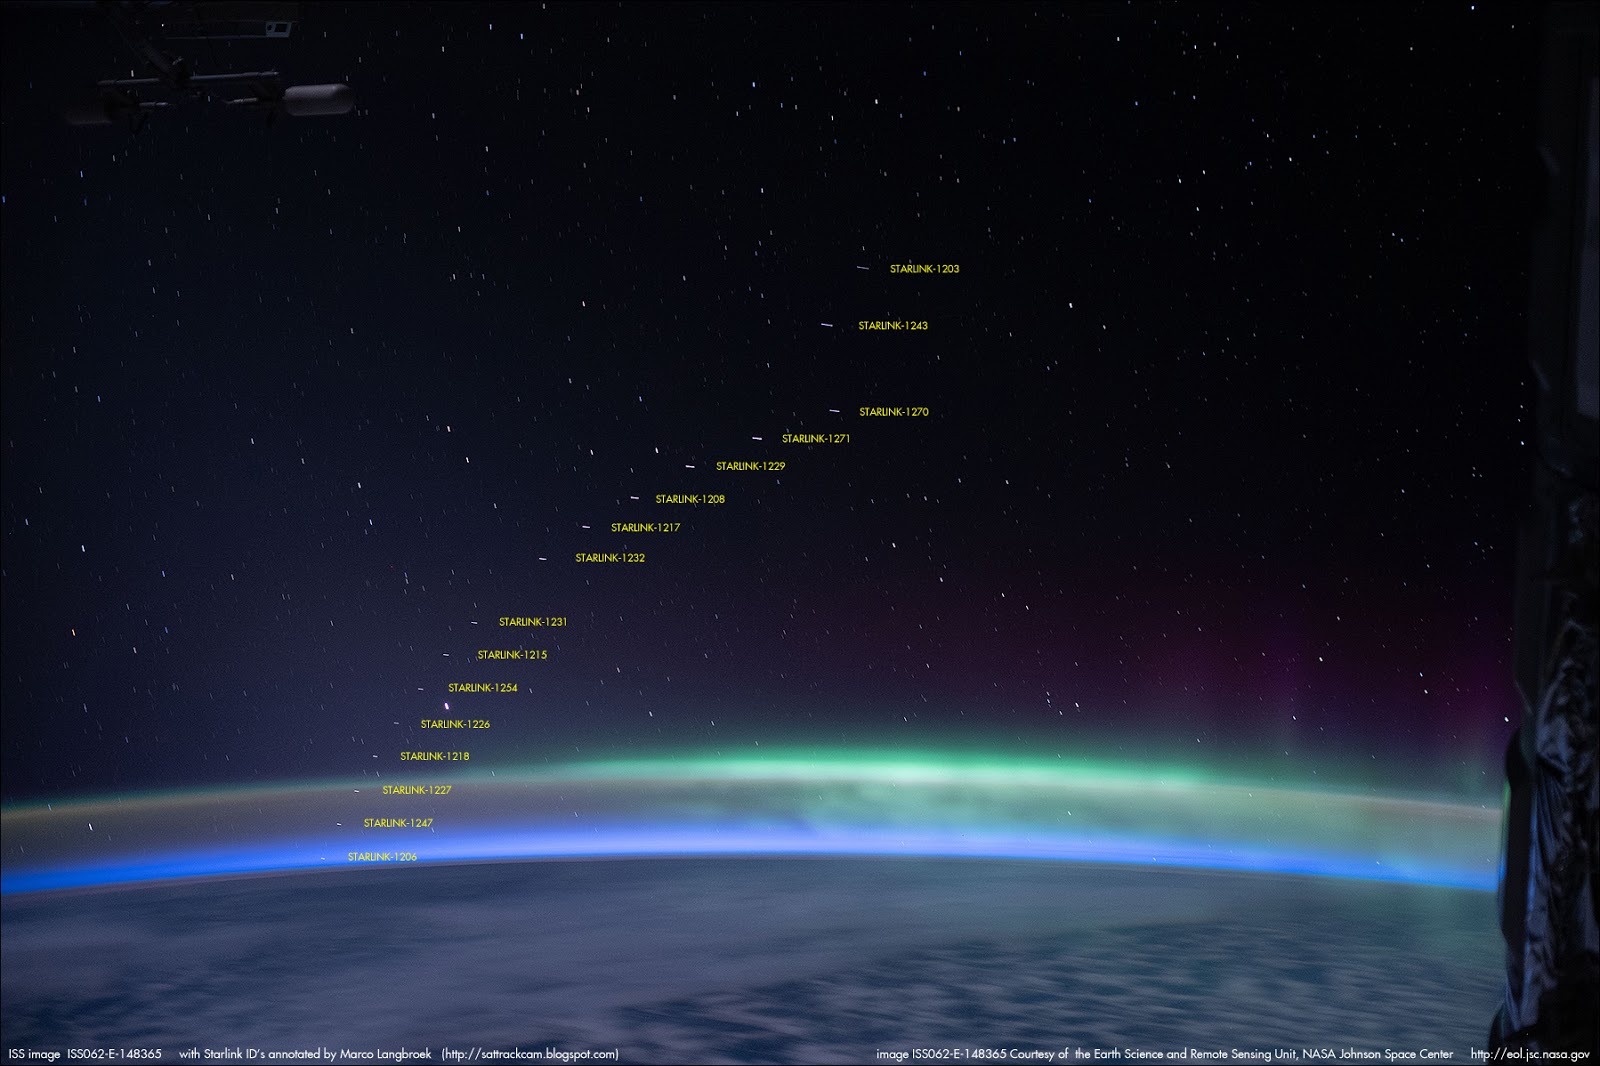
STARLINK SATELLITES PHOTOGRAPHED FROM THE ISS: For the first time, SpaceX's controversial Starlink satellites have been photographed by astronauts onboard the International Space Station. Here they are, photobombing a display of aurora australis on April 13, 2020:
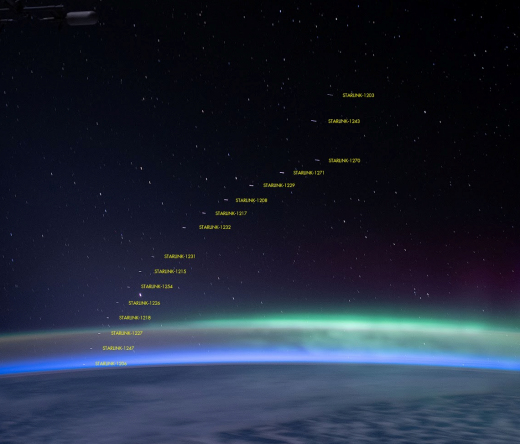
The ISS was flying over the southern Indian Ocean when the sighting occurred with cameras pointing generally south toward Antarctica. At the time, a minor stream of solar wind was buffeting Earth's magnetic field, sparking auroras over the frozen continent. The Starlink train stretches all the way from the twilight-blue horizon to the starry sky high above the aurora layer.
Dutch satellite expert Marco Langbroek identified the Starlink satellites and labeled the original NASA image. "These are all objects from the 17 February 2020 launch--- a.k.a. 'Starlink 4,'" Langbroek wrote in his blog.
Starlink is a new venture by SpaceX, which aims to surround Earth with satellites and beam affordable internet to remote locations all over the world. It is controversial because of its potential effect on the night sky. Just after launch, Starlink satellites easily can be seen with the unaided eye, swarming across stars and planets familiar to backyard astronomers. Scott Tucker of Tucson, Arizona, was photographing Venus on the evening of April 17th when this happened:
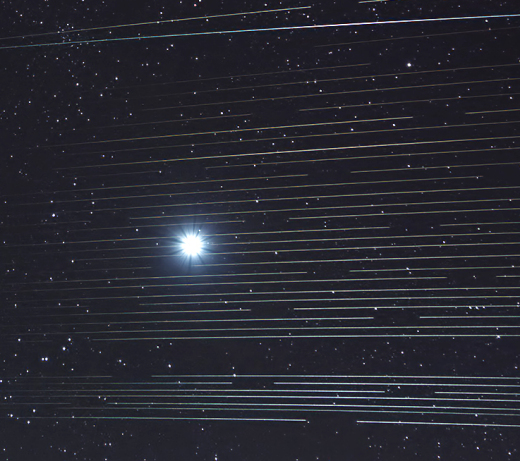
"I watched 41 Starlink satellites from the most recent launch pass by Venus during late twilight," says Tucker. "One of them even flared like an Iridium satellite! It got to magnitude -2 for a few seconds."
Newly-launched Starlink satellites eventually dim as they approach operational orbits 550 km above Earth--but even then they can interfere with research astronomy. Big telescopes have no trouble detecting Starlink satellites no matter how high they go. The fact that SpaceX plans to launch at least 12,000 of them has prompted the International Astronomical Union to sound the alarm.
So far, there are 360 Starlinks into Earth orbit, a tiny fraction of the ultimate total, yet still a large number. Accidental sightings have become so common that we now have an entire photo gallery of Starlink sightings. Browse the collection and see what you think.
Realtime Starlink Photo Gallery
Free: Spaceweather.com Newsletter
Realtime Space Weather Photo Gallery
Free: Spaceweather.com Newsletter
Every night, a network of
NASA all-sky cameras scans the skies above the United States for meteoritic fireballs. Automated software maintained by NASA's Meteoroid Environment Office calculates their orbits, velocity, penetration depth in Earth's atmosphere and many other characteristics. Daily results are presented here on Spaceweather.com.
On Apr. 19, 2020, the network reported 4 fireballs.
(4 sporadics)
In this diagram of the inner solar system, all of the fireball orbits intersect at a single point--Earth. The orbits are color-coded by velocity, from slow (red) to fast (blue). [Larger image] [movies]
Potentially Hazardous Asteroids (
PHAs) are space rocks larger than approximately 100m that can come closer to Earth than 0.05 AU. None of the known PHAs is on a collision course with our planet, although astronomers are finding
new ones all the time.
On April 20, 2020 there were 2018 potentially hazardous asteroids.
 |
Recent & Upcoming Earth-asteroid encounters: | Asteroid | Date(UT) | Miss Distance | Velocity (km/s) | Diameter (m) |
| 2020 FX3 | 2020-Apr-15 | 14.1 LD | 10.3 | 54 |
| 2020 HP1 | 2020-Apr-15 | 1.3 LD | 4.2 | 7 |
| 2020 FZ6 | 2020-Apr-15 | 20 LD | 21.7 | 189 |
| 2020 HO | 2020-Apr-15 | 0.8 LD | 20.1 | 6 |
| 2020 GH2 | 2020-Apr-15 | 0.9 LD | 8.7 | 17 |
| 2020 GN2 | 2020-Apr-16 | 3.2 LD | 10 | 27 |
| 2020 HW | 2020-Apr-16 | 12.6 LD | 13.9 | 21 |
| 2020 GJ2 | 2020-Apr-17 | 11.5 LD | 8 | 41 |
| 2020 GD3 | 2020-Apr-17 | 15.1 LD | 5.4 | 13 |
| 2020 GR2 | 2020-Apr-17 | 12.5 LD | 4.3 | 18 |
| 2020 HM | 2020-Apr-17 | 11.4 LD | 16.1 | 51 |
| 2020 GT2 | 2020-Apr-18 | 5.7 LD | 13 | 33 |
| 2020 HB1 | 2020-Apr-18 | 7.7 LD | 7.5 | 14 |
| 2020 HF | 2020-Apr-18 | 2.3 LD | 7.9 | 33 |
| 2020 GZ2 | 2020-Apr-19 | 2.1 LD | 9.5 | 9 |
| 2020 HA | 2020-Apr-19 | 10 LD | 12 | 25 |
| 2020 FV6 | 2020-Apr-19 | 10.8 LD | 19.8 | 90 |
| 2020 HV | 2020-Apr-19 | 1.1 LD | 7.2 | 6 |
| 2020 GA3 | 2020-Apr-20 | 8.1 LD | 17.4 | 35 |
| 2020 HB | 2020-Apr-21 | 5.8 LD | 13.5 | 33 |
| 2020 HO1 | 2020-Apr-21 | 10.1 LD | 6.1 | 15 |
| 2020 GB3 | 2020-Apr-22 | 13.3 LD | 5.4 | 18 |
| 2019 HS2 | 2020-Apr-26 | 13.6 LD | 12.6 | 17 |
| 2019 GF1 | 2020-Apr-27 | 18.7 LD | 3.2 | 12 |
| 2020 FM6 | 2020-Apr-27 | 14.3 LD | 16.9 | 151 |
| 2020 HS1 | 2020-Apr-27 | 18 LD | 2 | 30 |
| 2020 HT1 | 2020-Apr-28 | 11.1 LD | 9.7 | 26 |
| 2020 HP | 2020-Apr-28 | 14.1 LD | 10.4 | 55 |
| 52768 | 2020-Apr-29 | 16.4 LD | 8.7 | 2457 |
| 2020 GY2 | 2020-Apr-30 | 17.1 LD | 16.2 | 64 |
| 2020 DM4 | 2020-May-01 | 18.4 LD | 6.4 | 159 |
| 2020 HL1 | 2020-May-03 | 12.6 LD | 11.9 | 31 |
| 2020 GE3 | 2020-May-04 | 19 LD | 5.2 | 21 |
| 2020 HL | 2020-May-05 | 16.6 LD | 9 | 36 |
| 438908 | 2020-May-07 | 8.9 LD | 12.8 | 282 |
| 2016 HP6 | 2020-May-07 | 4.3 LD | 5.7 | 31 |
| 388945 | 2020-May-10 | 7.3 LD | 8.8 | 295 |
| 2000 KA | 2020-May-12 | 8.9 LD | 13.5 | 162 |
| 478784 | 2020-May-15 | 8.5 LD | 3.6 | 28 |
| 136795 | 2020-May-21 | 16.1 LD | 11.7 | 892 |
| 163348 | 2020-Jun-06 | 13.3 LD | 11.1 | 339 |
| 2013 XA22 | 2020-Jun-09 | 10.6 LD | 6.5 | 98 |
| 2017 MF7 | 2020-Jun-14 | 3.7 LD | 10.9 | 23 |
Notes: LD means "Lunar Distance." 1 LD = 384,401 km, the distance between Earth and the Moon. 1 LD also equals 0.00256 AU. MAG is the visual magnitude of the asteroid on the date of closest approach. | | Cosmic Rays in the Atmosphere |
SOMETHING NEW! We have developed a new predictive model of aviation radiation. It's called E-RAD--short for Empirical RADiation model. We are constantly flying radiation sensors onboard airplanes over the US and and around the world, so far collecting more than 22,000 gps-tagged radiation measurements. Using this unique dataset, we can predict the dosage on any flight over the USA with an error no worse than 15%.
E-RAD lets us do something new: Every day we monitor approximately 1400 flights criss-crossing the 10 busiest routes in the continental USA. Typically, this includes more than 80,000 passengers per day. E-RAD calculates the radiation exposure for every single flight.
The Hot Flights Table is a daily summary of these calculations. It shows the 5 charter flights with the highest dose rates; the 5 commercial flights with the highest dose rates; 5 commercial flights with near-average dose rates; and the 5 commercial flights with the lowest dose rates. Passengers typically experience dose rates that are 20 to 70 times higher than natural radiation at sea level.
To measure radiation on airplanes, we use the same sensors we fly to the stratosphere onboard Earth to Sky Calculus cosmic ray balloons: neutron bubble chambers and X-ray/gamma-ray Geiger tubes sensitive to energies between 10 keV and 20 MeV. These energies span the range of medical X-ray machines and airport security scanners.
Column definitions: (1) The flight number; (2) The maximum dose rate during the flight, expressed in units of natural radiation at sea level; (3) The maximum altitude of the plane in feet above sea level; (4) Departure city; (5) Arrival city; (6) Duration of the flight.
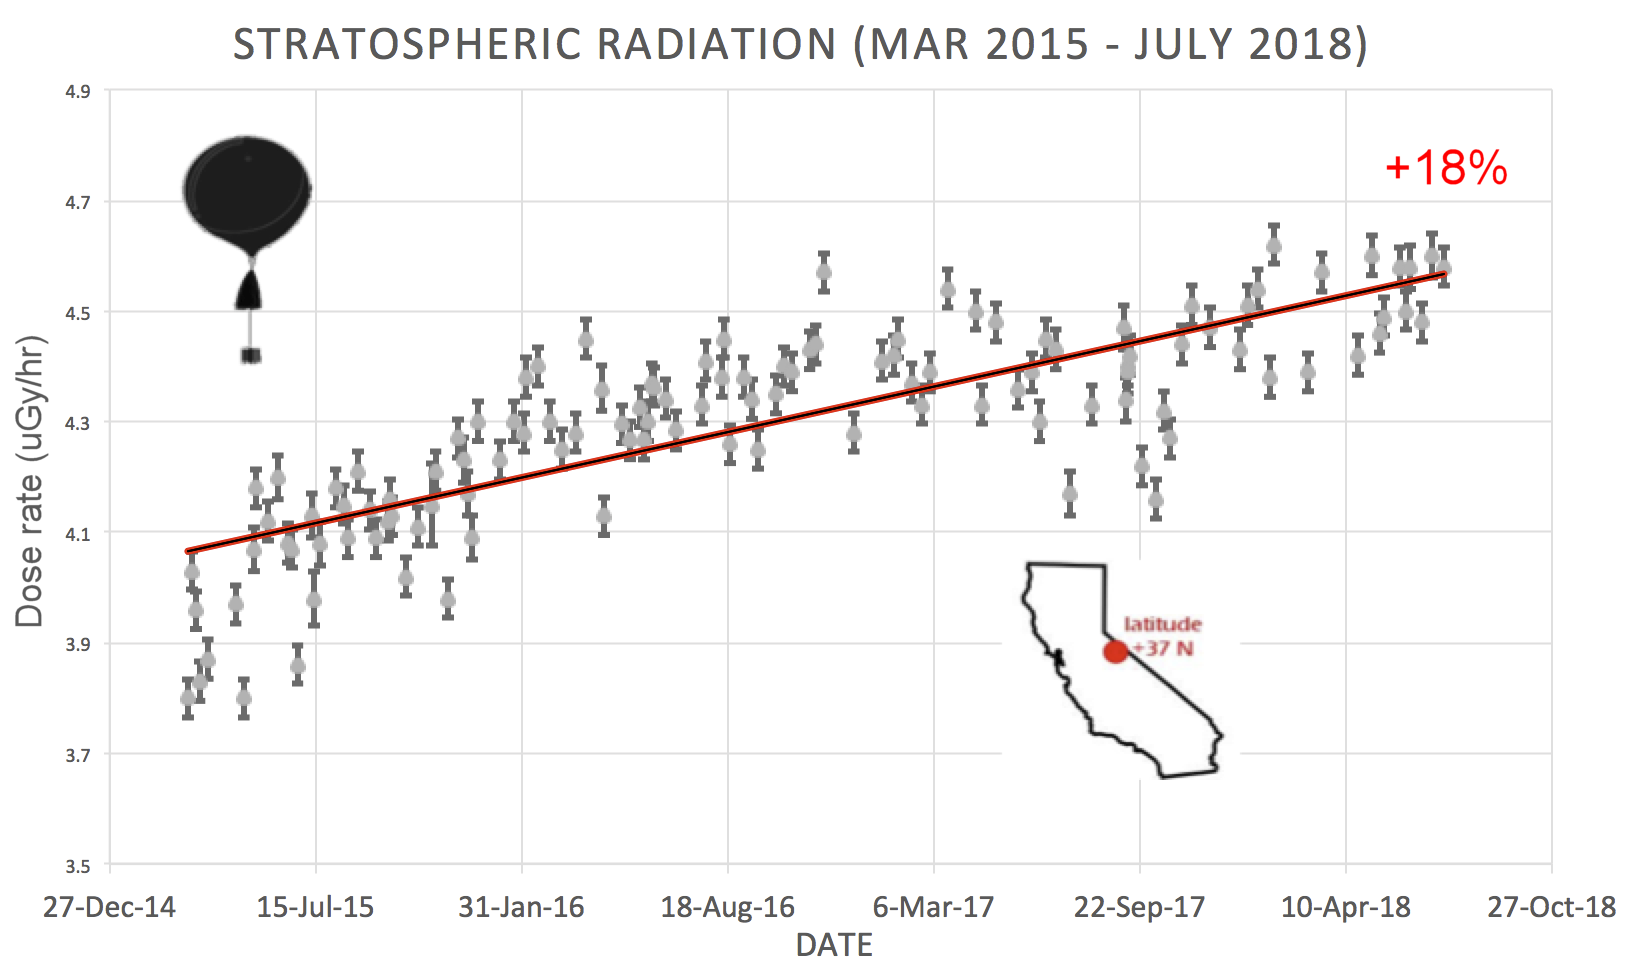
SPACE WEATHER BALLOON DATA: Approximately once a week, Spaceweather.com and the students of Earth to Sky Calculus fly space weather balloons to the stratosphere over California. These balloons are equipped with radiation sensors that detect cosmic rays, a surprisingly "down to Earth" form of space weather. Cosmic rays can seed clouds, trigger lightning, and penetrate commercial airplanes. Furthermore, there are studies ( #1, #2, #3, #4) linking cosmic rays with cardiac arrhythmias and sudden cardiac death in the general population. Our latest measurements show that cosmic rays are intensifying, with an increase of more than 18% since 2015:

The data points in the graph above correspond to the peak of the Regener-Pfotzer maximum, which lies about 67,000 feet above central California. When cosmic rays crash into Earth's atmosphere, they produce a spray of secondary particles that is most intense at the entrance to the stratosphere. Physicists Eric Reneger and Georg Pfotzer discovered the maximum using balloons in the 1930s and it is what we are measuring today.
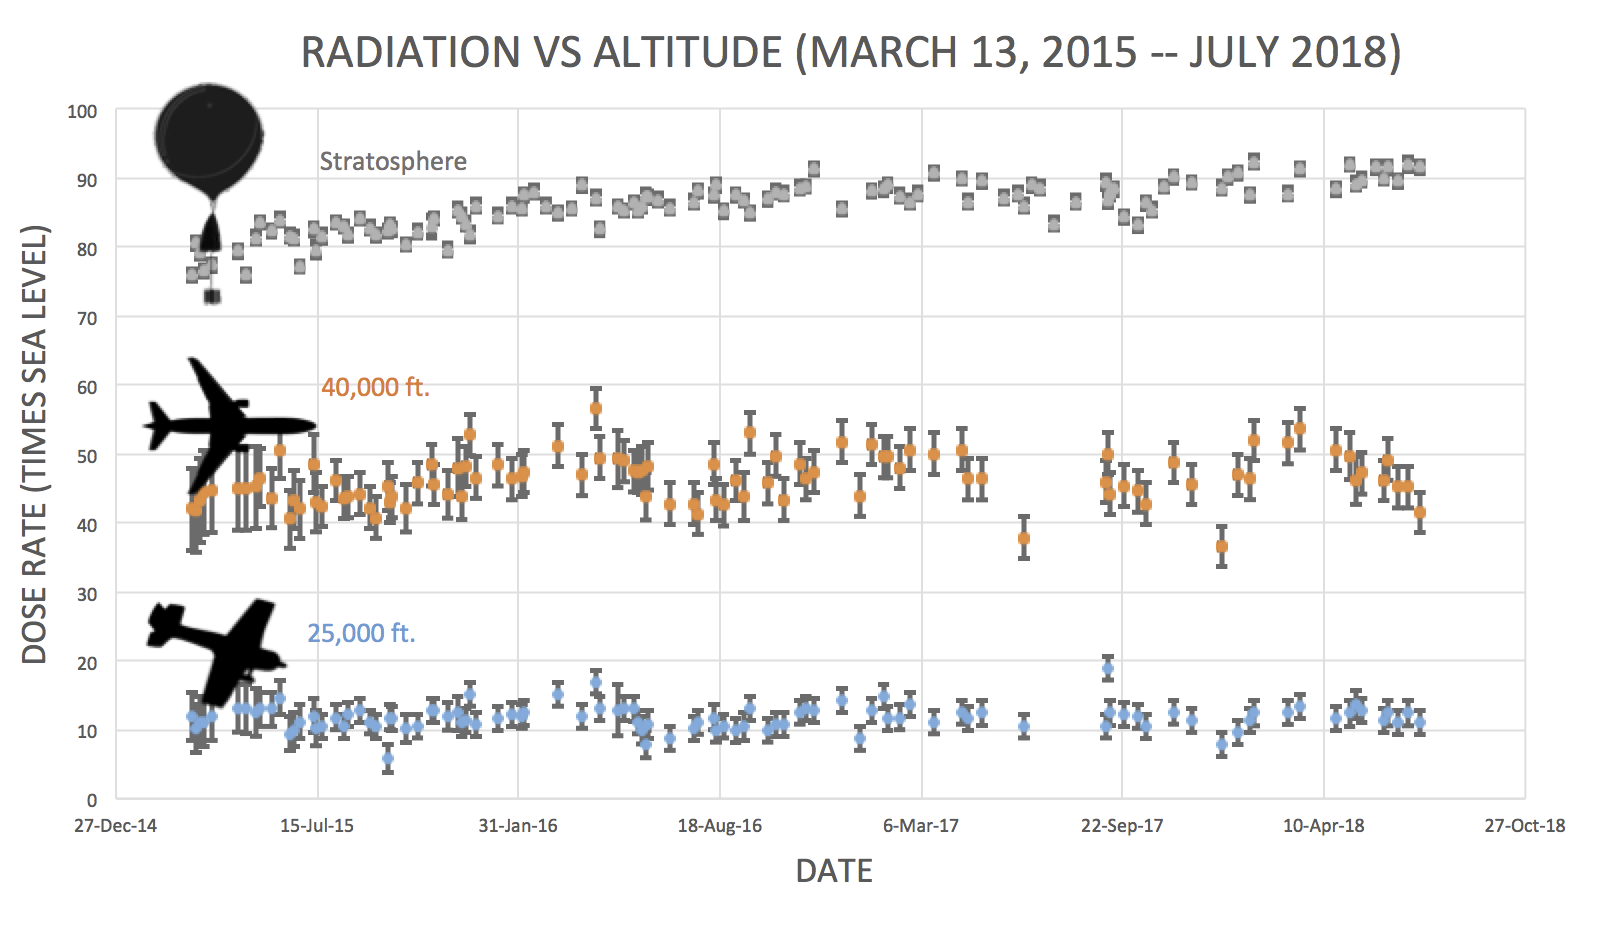
En route to the stratosphere, our sensors also pass through aviation altitudes:

In this plot, dose rates are expessed as multiples of sea level. For instance, we see that boarding a plane that flies at 25,000 feet exposes passengers to dose rates ~10x higher than sea level. At 40,000 feet, the multiplier is closer to 50x.
The radiation sensors onboard our helium balloons detect X-rays and gamma-rays in the energy range 10 keV to 20 MeV. These energies span the range of medical X-ray machines and airport security scanners.
Why are cosmic rays intensifying? The main reason is the sun. Solar storm clouds such as coronal mass ejections (CMEs) sweep aside cosmic rays when they pass by Earth. During Solar Maximum, CMEs are abundant and cosmic rays are held at bay. Now, however, the solar cycle is swinging toward Solar Minimum, allowing cosmic rays to return. Another reason could be the weakening of Earth's magnetic field, which helps protect us from deep-space radiation.
| | The official U.S. government space weather bureau |
| | The first place to look for information about sundogs, pillars, rainbows and related phenomena. |
| | Researchers call it a "Hubble for the sun." SDO is the most advanced solar observatory ever. |
| | 3D views of the sun from NASA's Solar and Terrestrial Relations Observatory |
| | Realtime and archival images of the Sun from SOHO. |
| | from the NOAA Space Environment Center |
| | fun to read, but should be taken with a grain of salt! Forecasts looking ahead more than a few days are often wrong. |
| | from the NOAA Space Environment Center |
| | the underlying science of space weather |
 | To find reviews of new online casino sites in the UK try The Casino DB where there are hundreds of online casino reviews complete with bonuses and ratings. Get a bonus when playing at a new casino in the UK. The Genie got you covered! Looking for a new online casino? Try Casimpo the new site dedicated to making online casino simple and easy for all. |
| | These links help Spaceweather.com stay online. Thank you to our supporters! |
| | | | | | |


