Never miss another geomagnetic storm. Sign up for Space Weather Alerts and you'll receive a text message when auroras appear in your area. Aurora tour guides and professional astronomers use this service. Now you can, too! | | |
LARGE SOLAR PROMINENCE: Around the world, amateur astronomers are monitoring a large flame-like prominence jutting from the sun's southeastern limb. It's more than 100,000 km tall. If you have a safe solar telescope, take a look. Images: #1, #2, #3. Update: This prominence has just erupted!
THE SOLAR MINIMUM SUPERSTORM OF 1903: Don’t let Solar Minimum fool you. The sun can throw a major tantrum even during the quiet phase of the 11-year solar cycle. That’s the conclusion of a new study just published in the Astrophysical Journal Letters.
"In late October 1903, one of the strongest solar storms in modern history hit Earth," say the lead authors of the study, Hisashi Hayakawa (Osaka University, Japan) and Paulo Ribeiro (Coimbra University, Portugal). "The timing of the storm interestingly parallels where we are now–near Solar Minimum just after a weak solar cycle."
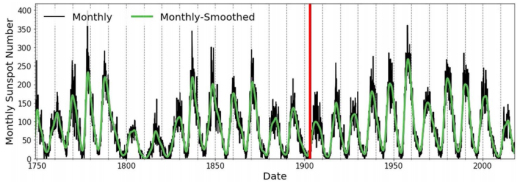
Above: The red line marks the 1903 solar superstorm in a plot of the 11-year solar cycle. [ref]
The 1903 event wasn't always recognized as a great storm. Hayakawa and colleagues took an interest in it because of what happened when the storm hit. In magnetic observatories around the world, pens scrabbling across paper chart recorders literally flew offscale, overwhelmed by the disturbance. That's the kind of thing superstorms do.
So, the researchers scoured historical records for clues, and they found four magnetic observatories in Portugal, India, Mexico and China where the readings were whole. Using those data they calculated the size of the storm.
"It was big," says Hayakawa. "The 1903 storm ranks 6th in the list of known geomagnetic storms since 1850, just below the extreme storm of March 1989, which blacked out the province of Quebec."
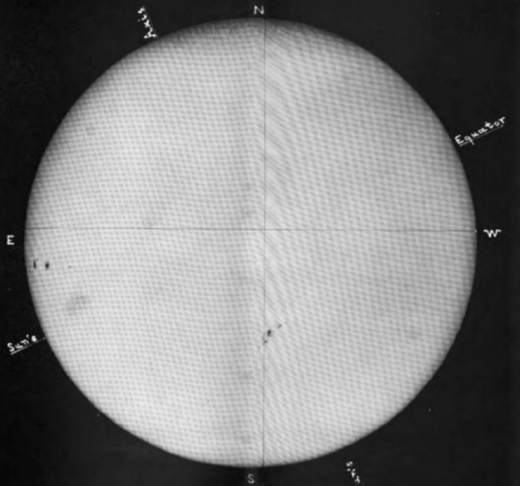
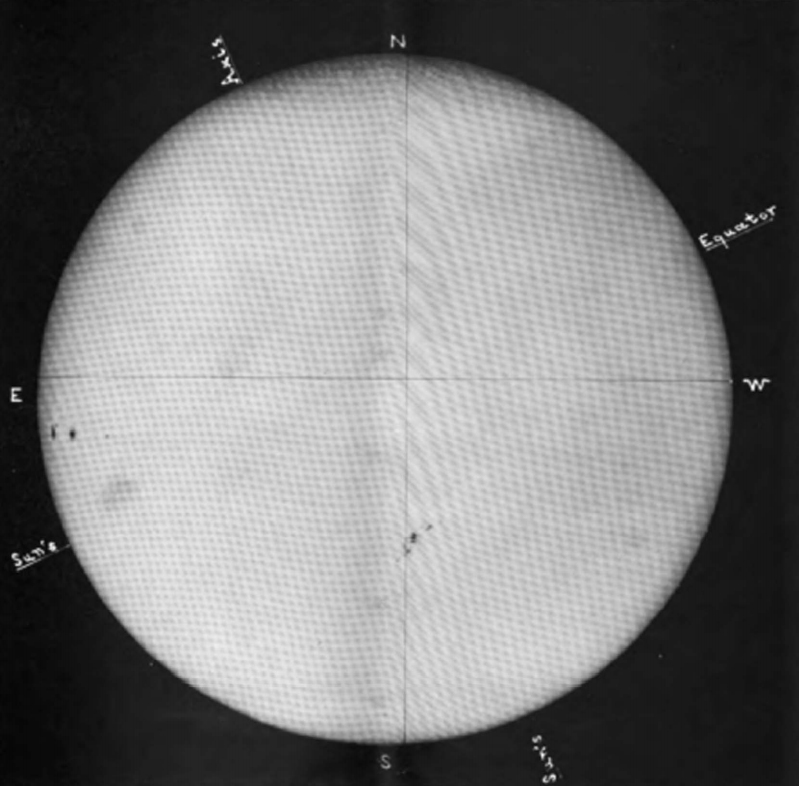
Above: A photo of the sun on Oct. 31, 1903, from the Royal Observatory in Greenwich. [ref]
In their paper, Hayakawa et al detail what happened. During the last week of October 1903, a moderately large new-cycle sunspot appeared. It was directly facing Earth on Oct. 30th when it unleashed a solar flare. The flare cannot be ranked using modern scales, because there were no Earth-orbiting satellites to measure its X-ray intensity. However, it must have been very strong; minutes after the explosion, Earth’s magnetic field lurched (a "magnetic crochet") as radiation from the crackling sunspot caused strong electrical currents to flow in our planet’s upper atmosphere.
The real action began 27 hours later when the CME (coronal mass ejection) arrived. A massive plasma cloud slammed into Earth’s magnetic field, and pens flying off chart papers were the least of the effects. Surging ground currents disrupted communications around the world. In Chicago, voltages in telephone lines spiked to 675 volts–"enough to kill a man," according to headlines in the Chicago Sunday Tribune. Telegraph operators in London found they could not send clear messages to Latin America, France, Italy, Spain, Portugal, and Algeria.
Meanwhile, auroras spread across both hemispheres. Southern Lights were seen directly overhead in New South Wales, Australia, while Northern Lights descended past Colorado in the United States. "Shafts of cold gorgeous light [rose] almost to the zenith and gave the impression that a frightful conflagration was raging somewhere to the north of the city [of Leadville]," eyewitnesses reported in Colorado’s Herald Democrat newspaper.
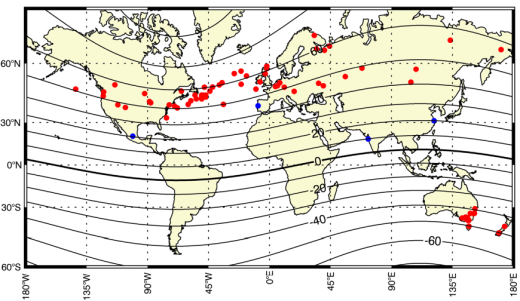
Above: Red dots mark aurora sightings during the Oct-Nov 1903 superstorm. [ref]
How big was it? Space weather researchers rank storms using"Dst" (disturbance storm time index), a measure of geomagnetic activity that can be estimated from old magnetogram chart recordings. For the 1903 storm. Hayakawa and colleagues found Dst = -531 nT. For comparison, the Carrington Event of 1859 and the Great Railroad Storm of May 1921 are both in the ballpark of Dst = -900 nT. Arguably, this puts 1903 within spitting distance of the greatest storms in recorded history.
1903 isn’t the only time strong storms have interrupted Solar Minimum. "Similar storms (but less extreme) occurred around Solar Minimum in Feb 1986 (Garcia and Dryer, 1987; Dst=-307 nT) and Sept. 1998 (Daglis et al., 2007; Dst ~-200 nT)," notes Hayakawa.
As 2020 unfolds, the sun is experiencing, and perhaps just beginning to emerge from, a century-class Solar Minimum. Also, a new-cycle sunspot (AR2767) is facing Earth. Sound familiar?
A sharable version of this story may be found here.
Realtime Space Weather Photo Gallery
Free: Spaceweather.com Newsletter
DON'T FORGET COMET NEOWISE: Comet NEOWISE (C/2020 F3) has faded from naked-eye visibility. "But it's still an amazing target for photographers with telescopes," says Chris Schur of Payson, Arizona, who took this picture through a 10-inch telescope on July 28th:
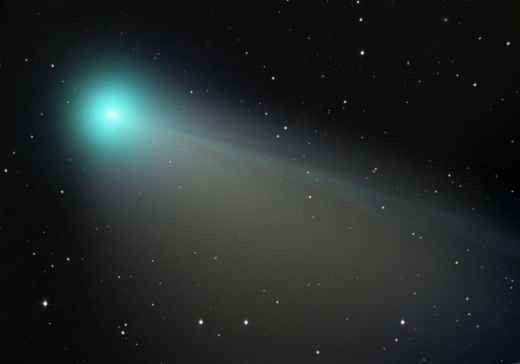
"It is simply brilliant in the eyepiece," says Schur. "There is still amazing detail to be seen, and images reveal a stunning gas tail as a blue ribbon sheathed by a yellow fan of cometary golden dust."
Convinced? Dust off your optics and point them here.
Realtime Comet NEOWISE Photo Gallery
Free: Spaceweather.com Newsletter
A STORM TROOPER IN THE STRATOSPHERE: It's the ultimate gift for a Star Wars fan--a Storm Trooper bobblehead from the edge of space. On July 23rd, this minion of the Emperor hitched a ride to the stratosphere onboard an Earth to Sky Calculus cosmic ray balloon. Here he is floating 117,454 feet above the Sierra Nevada mountains of California:
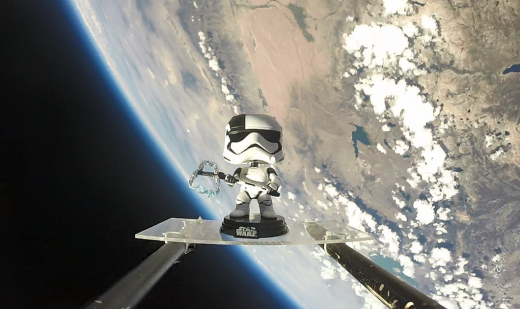
You can have him for $109.95. The students of Earth to Sky are selling Storm Troopers to support their cosmic ray ballooning program. Each bobblehead comes with a card showing it floating through the stratosphere, and telling the story of its journey to the edge of space and back again.
Far Out Gifts: Earth to Sky Store
All sales support hands-on STEM education
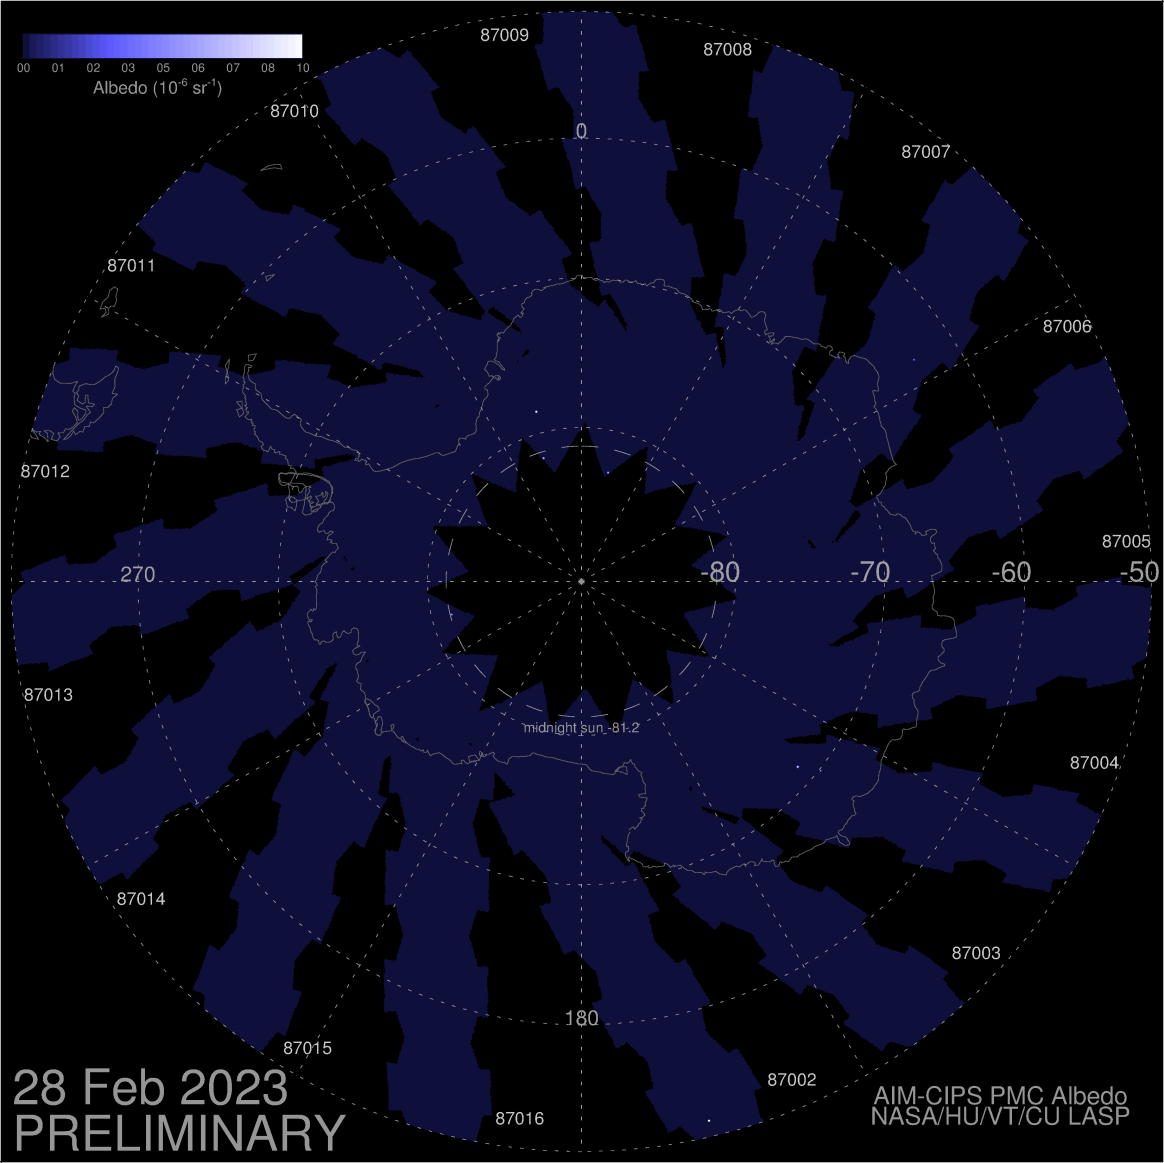
Realtime Noctilucent Cloud Photo Gallery
Free: Spaceweather.com Newsletter
Every night, a network of
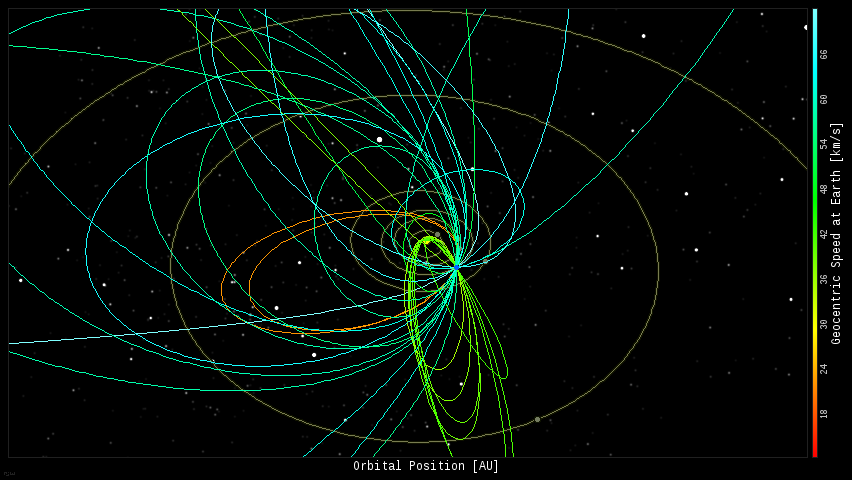
NASA all-sky cameras scans the skies above the United States for meteoritic fireballs. Automated software maintained by NASA's Meteoroid Environment Office calculates their orbits, velocity, penetration depth in Earth's atmosphere and many other characteristics. Daily results are presented here on Spaceweather.com.
On July 31, 2020, the network reported 35 fireballs.
(19 sporadics, 7 Perseids, 6 Southern Delta Aquariids, 2 alpha Capricornids, 1 Northern Delta Aquariid)
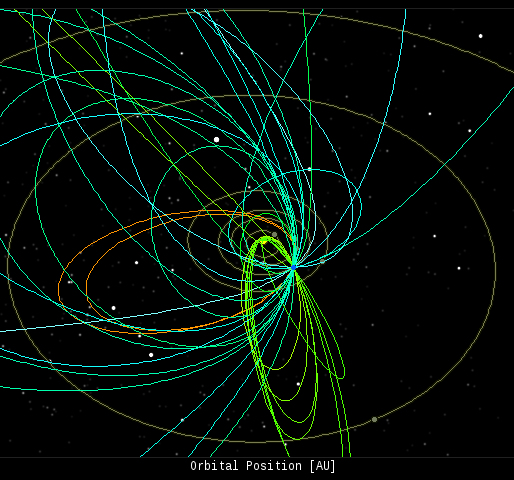
In this diagram of the inner solar system, all of the fireball orbits intersect at a single point--Earth. The orbits are color-coded by velocity, from slow (red) to fast (blue). [Larger image] [movies]
Potentially Hazardous Asteroids (
PHAs) are space rocks larger than approximately 100m that can come closer to Earth than 0.05 AU. None of the known PHAs is on a collision course with our planet, although astronomers are finding
new ones all the time.
On July 31, 2020 there were 2037 potentially hazardous asteroids.
 |
Recent & Upcoming Earth-asteroid encounters: | Asteroid | Date(UT) | Miss Distance | Velocity (km/s) | Diameter (m) |
| 2020 OY5 | 2020-Jul-26 | 9.1 LD | 18.8 | 69 |
| 2020 OA5 | 2020-Jul-27 | 16.8 LD | 10.2 | 15 |
| 2020 OO1 | 2020-Jul-27 | 1.7 LD | 7.3 | 18 |
| 2020 NZ | 2020-Jul-28 | 8.2 LD | 7.8 | 31 |
| 2020 OE2 | 2020-Jul-28 | 4.5 LD | 2.9 | 14 |
| 2020 OY4 | 2020-Jul-28 | 0.1 LD | 12.4 | 3 |
| 2020 OR4 | 2020-Jul-28 | 1.2 LD | 22.9 | 27 |
| 2020 OU5 | 2020-Jul-29 | 9.3 LD | 11.2 | 38 |
| 2020 MX3 | 2020-Jul-29 | 9.4 LD | 8.5 | 62 |
| 2020 OM4 | 2020-Jul-30 | 8 LD | 15.3 | 73 |
| 2018 PY7 | 2020-Jul-31 | 8.9 LD | 9.5 | 16 |
| 2007 RF1 | 2020-Jul-31 | 10.7 LD | 5 | 21 |
| 2020 OC1 | 2020-Jul-31 | 9.6 LD | 4 | 19 |
| 2020 OT4 | 2020-Jul-31 | 12 LD | 4.3 | 18 |
| 2020 OX5 | 2020-Jul-31 | 6.8 LD | 9.2 | 14 |
| 2020 OO2 | 2020-Aug-01 | 14.9 LD | 7.8 | 29 |
| 2018 BD | 2020-Aug-03 | 7.6 LD | 9.4 | 3 |
| 2020 OA6 | 2020-Aug-04 | 6.4 LD | 10.4 | 21 |
| 2020 OG3 | 2020-Aug-04 | 7.1 LD | 6 | 16 |
| 2009 PQ1 | 2020-Aug-05 | 10.8 LD | 13.5 | 112 |
| 2020 OL4 | 2020-Aug-08 | 9.5 LD | 10.8 | 37 |
| 2020 FA1 | 2020-Aug-23 | 18.4 LD | 1.9 | 20 |
| 2016 AH164 | 2020-Aug-26 | 15.7 LD | 5.6 | 4 |
| 2011 ES4 | 2020-Sep-01 | 0.3 LD | 8.2 | 30 |
| 465824 | 2020-Sep-06 | 19.4 LD | 14 | 162 |
| 2012 RM15 | 2020-Sep-12 | 14.9 LD | 9.8 | 45 |
| 2017 US | 2020-Sep-13 | 17.3 LD | 5.9 | 21 |
| 2014 QJ33 | 2020-Sep-18 | 11.5 LD | 8.3 | 65 |
| 2017 SL16 | 2020-Sep-20 | 8.9 LD | 6.4 | 25 |
Notes: LD means "Lunar Distance." 1 LD = 384,401 km, the distance between Earth and the Moon. 1 LD also equals 0.00256 AU. MAG is the visual magnitude of the asteroid on the date of closest approach. | | Cosmic Rays in the Atmosphere |
SOMETHING NEW! We have developed a new predictive model of aviation radiation. It's called E-RAD--short for Empirical RADiation model. We are constantly flying radiation sensors onboard airplanes over the US and and around the world, so far collecting more than 22,000 gps-tagged radiation measurements. Using this unique dataset, we can predict the dosage on any flight over the USA with an error no worse than 15%.
E-RAD lets us do something new: Every day we monitor approximately 1400 flights criss-crossing the 10 busiest routes in the continental USA. Typically, this includes more than 80,000 passengers per day. E-RAD calculates the radiation exposure for every single flight.
The Hot Flights Table is a daily summary of these calculations. It shows the 5 charter flights with the highest dose rates; the 5 commercial flights with the highest dose rates; 5 commercial flights with near-average dose rates; and the 5 commercial flights with the lowest dose rates. Passengers typically experience dose rates that are 20 to 70 times higher than natural radiation at sea level.
To measure radiation on airplanes, we use the same sensors we fly to the stratosphere onboard Earth to Sky Calculus cosmic ray balloons: neutron bubble chambers and X-ray/gamma-ray Geiger tubes sensitive to energies between 10 keV and 20 MeV. These energies span the range of medical X-ray machines and airport security scanners.
Column definitions: (1) The flight number; (2) The maximum dose rate during the flight, expressed in units of natural radiation at sea level; (3) The maximum altitude of the plane in feet above sea level; (4) Departure city; (5) Arrival city; (6) Duration of the flight.
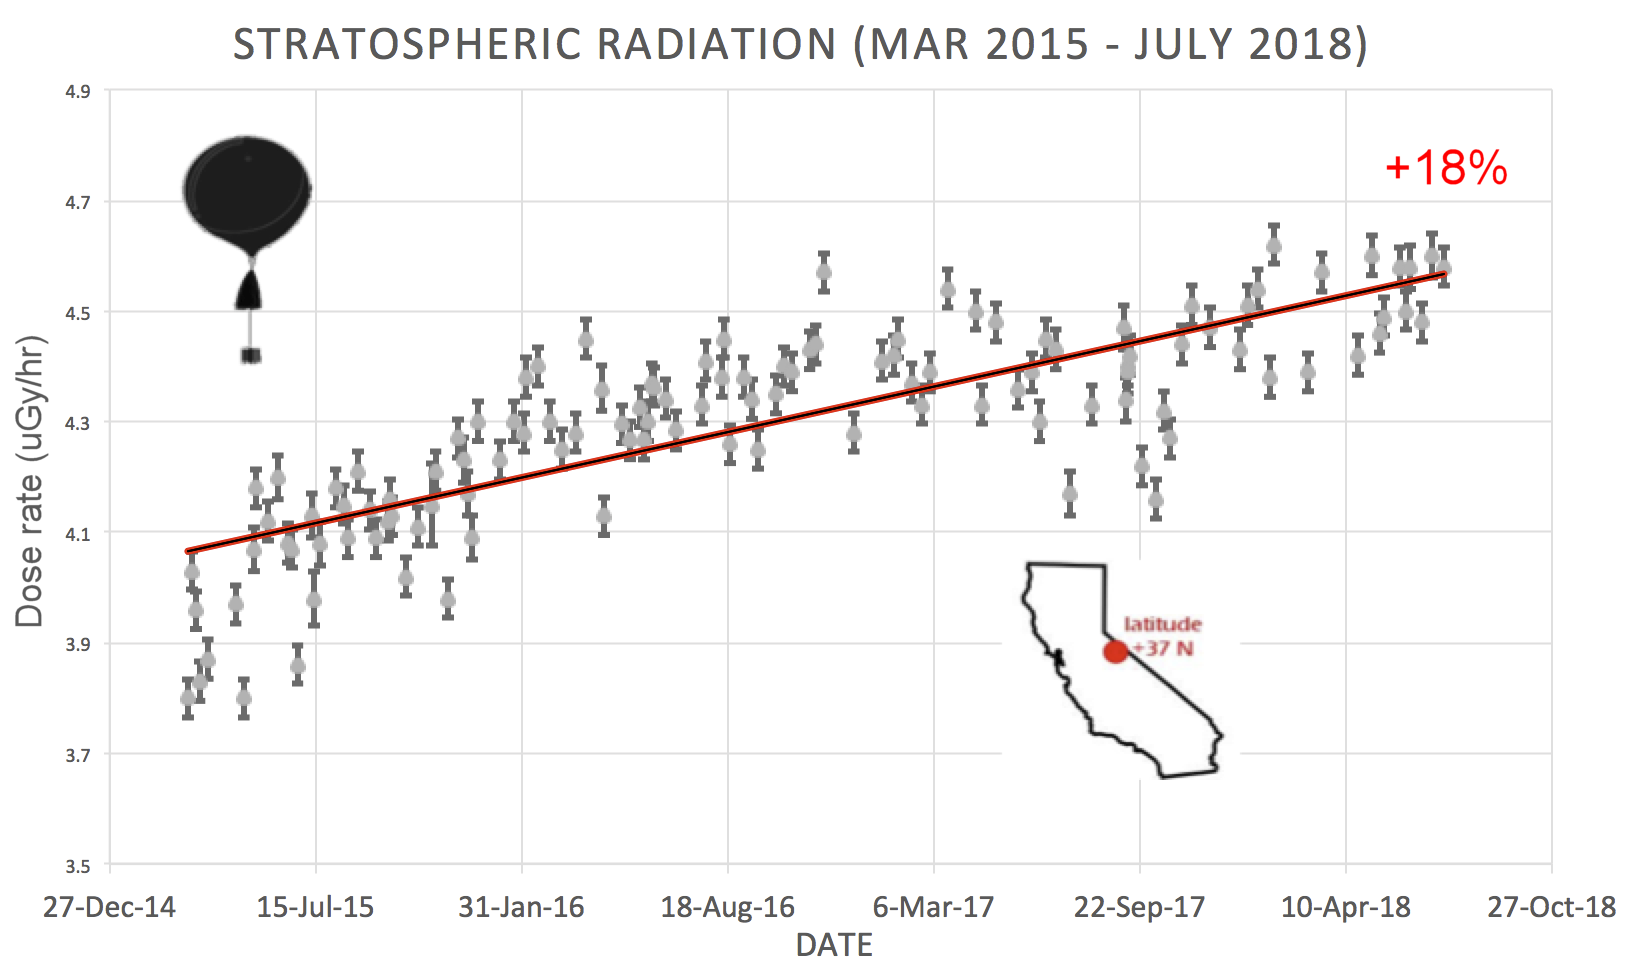
SPACE WEATHER BALLOON DATA: Approximately once a week, Spaceweather.com and the students of Earth to Sky Calculus fly space weather balloons to the stratosphere over California. These balloons are equipped with radiation sensors that detect cosmic rays, a surprisingly "down to Earth" form of space weather. Cosmic rays can seed clouds, trigger lightning, and penetrate commercial airplanes. Furthermore, there are studies ( #1, #2, #3, #4) linking cosmic rays with cardiac arrhythmias and sudden cardiac death in the general population. Our latest measurements show that cosmic rays are intensifying, with an increase of more than 18% since 2015:

The data points in the graph above correspond to the peak of the Regener-Pfotzer maximum, which lies about 67,000 feet above central California. When cosmic rays crash into Earth's atmosphere, they produce a spray of secondary particles that is most intense at the entrance to the stratosphere. Physicists Eric Reneger and Georg Pfotzer discovered the maximum using balloons in the 1930s and it is what we are measuring today.
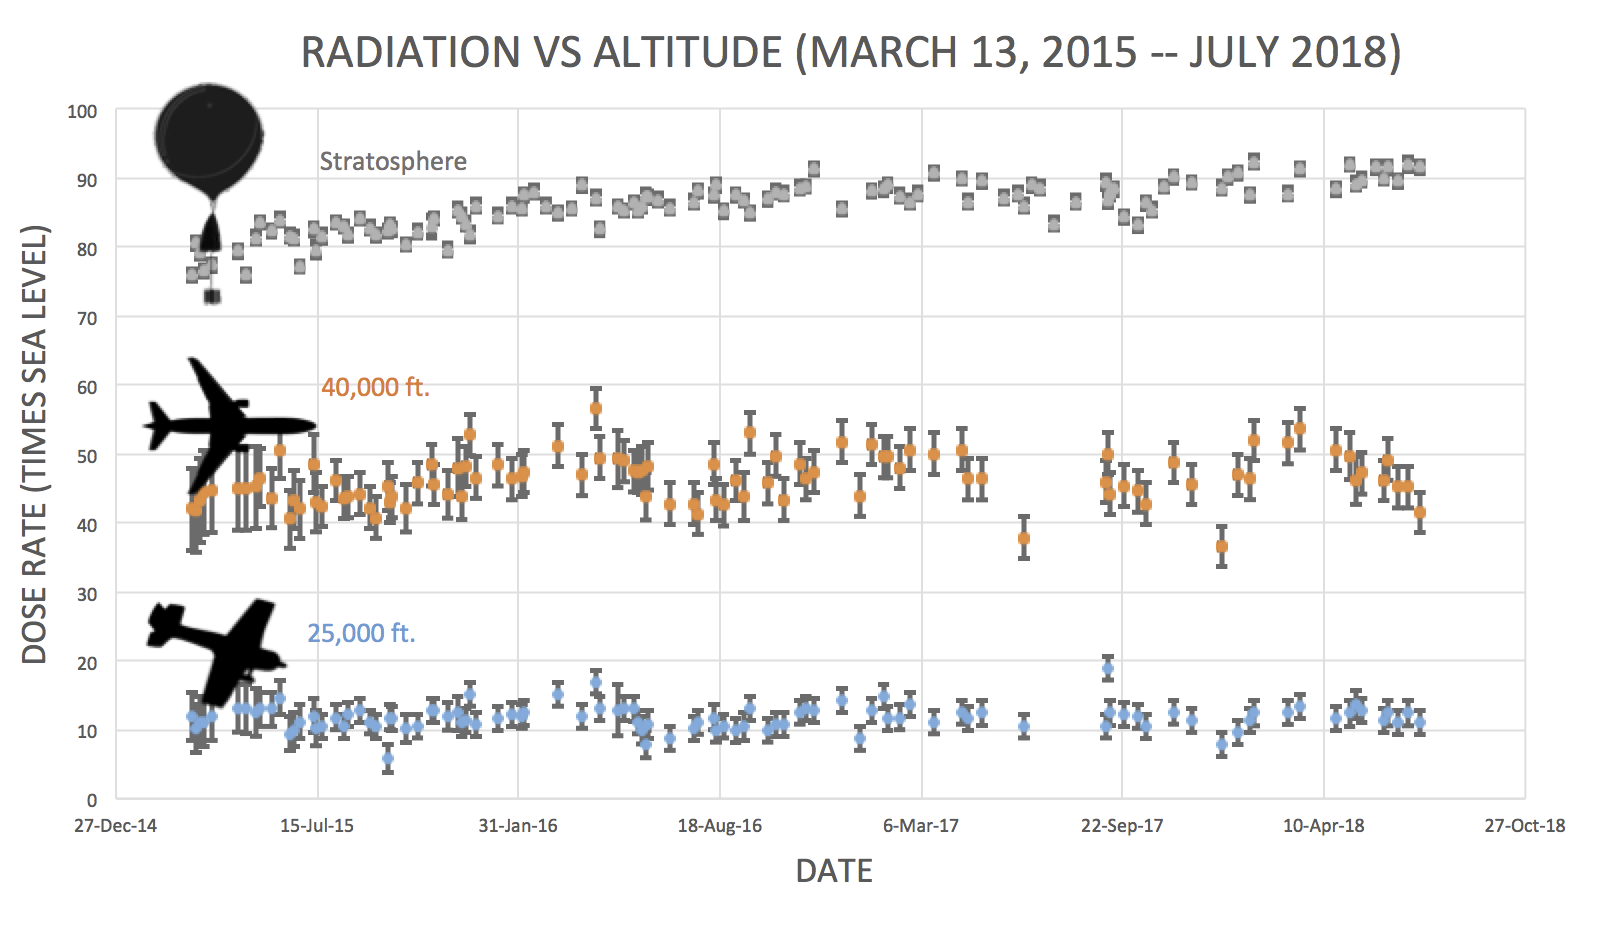
En route to the stratosphere, our sensors also pass through aviation altitudes:

In this plot, dose rates are expessed as multiples of sea level. For instance, we see that boarding a plane that flies at 25,000 feet exposes passengers to dose rates ~10x higher than sea level. At 40,000 feet, the multiplier is closer to 50x.
The radiation sensors onboard our helium balloons detect X-rays and gamma-rays in the energy range 10 keV to 20 MeV. These energies span the range of medical X-ray machines and airport security scanners.
Why are cosmic rays intensifying? The main reason is the sun. Solar storm clouds such as coronal mass ejections (CMEs) sweep aside cosmic rays when they pass by Earth. During Solar Maximum, CMEs are abundant and cosmic rays are held at bay. Now, however, the solar cycle is swinging toward Solar Minimum, allowing cosmic rays to return. Another reason could be the weakening of Earth's magnetic field, which helps protect us from deep-space radiation.
| | The official U.S. government space weather bureau |
| | The first place to look for information about sundogs, pillars, rainbows and related phenomena. |
| | Researchers call it a "Hubble for the sun." SDO is the most advanced solar observatory ever. |
| | 3D views of the sun from NASA's Solar and Terrestrial Relations Observatory |
| | Realtime and archival images of the Sun from SOHO. |
| | from the NOAA Space Environment Center |
| | fun to read, but should be taken with a grain of salt! Forecasts looking ahead more than a few days are often wrong. |
| | from the NOAA Space Environment Center |
| | the underlying science of space weather |
 | To find reviews of new online casino sites in the UK try The Casino DB where there are hundreds of online casino reviews complete with bonuses and ratings. Get a bonus when playing at a new casino in the UK. The Genie got you covered! Looking for a new online casino? Try Casimpo the new site dedicated to making online casino simple, or check out the new Avenger Slots Casino and Slot Strike Casino Sites with over 500 online slots and casino games. . |
| | These links help Spaceweather.com stay online. Thank you to our supporters! |
| | | | | | |


