Never miss another geomagnetic storm. Sign up for Space Weather Alerts and you'll receive a text message when auroras appear in your area. Aurora tour guides and professional astronomers use this service. Now you can, too! | | |
CME MISSES EARTH: There's still no sign of a CME expected to hit Earth yesterday, Aug. 20th. It probably missed. The CME did hit NASA's STEREO-A spacecraft. The geometry of the STEREO-A impact suggests that the storm cloud sailed wide of our planet. Maybe next time! Aurora alerts: SMS Text
APPROACHING MARS: By the time you finish reading this sentence, you'll be 40 km closer to Mars.
Earth and Mars are converging for a close encounter this Fall, one of the best since 2003, and their separation is rapidly shrinking--negative 8 km/s as of Aug. 21st. You are literally approaching the Red Planet. Just this week the brightness of Mars surpassed that of Sirius, the brightest star in the sky. Suddenly, Mars is almost bright enough to see in daylight and an easy target for backyard telescopes.
"Here is one hour of Mars rotating," says amateur astronomer Maximilian Teodorescu of Magurele, Romania, who animated a sequence of photos taken Aug 18th using his 14-inch Newtonian:
"Lots of features are visible," he says. "Note how the southern polar ice cap has contracted and broken--a result of it being late springtime on that side of Mars."
The best is yet to come. By the night of closest approach on Oct. 6th (0.4149 AU), Mars will more than double in brightness again, outshining everything in the night sky except Venus and the Moon. Throughout this apparition, the south pole will remain tilted toward Earth, giving observers a good view of the breakup of the ice cap as Martian spring turns into summer.
Can't wait? Right now, a good time to look is just before daybreak when Mars is high in the southern sky. Keep watching as twilight creeps up the sky. The planet's burnt orange hue looks beautiful when surrounded by the day's first hint of morning blue: sky map.
Congratulations, you're now almost 500 km closer to the planet Mars.
Realtime Mars Photo Gallery
Free: Spaceweather.com Newsletter
COSMIC RAY DATA--DELIVERED BY MULE: For the past 6 years, Spaceweather.com and the students of Earth to Sky Calculus have been launching balloons to the stratosphere, monitoring cosmic rays. Almost every data point we collect has a story behind it. This one involves a mule.

Above: The view from the landing site of our July 23, 2020, cosmic ray balloon.
On July 23rd, we launched a balloon as usual. It carried 4 cosmic ray sensors, GPS trackers, a flight computer, and a dozen pepper seeds (a student astrobiology project). The payload flew 35.8 km high--one of our highest flights ever. After the balloon popped, the adventure began. The payload hurtled downward briefly faster than 500 mph. The parachute opened, arresting its fall, and proceeded to guide the payload ... WAY OFF COURSE. The payload was supposed to land in the Buttermilks, a popular climbing area near Bishop, California, where we could easily retrieve it. Instead it touched down almost 40 miles away in the remote Sierra Nevada mountains.
As we began to make our plans to hike in and get it--a 2 day, 60 mile expedition-- something strange happened. The payload started moving again. Little did we know at the time, it was on the back of a mule.
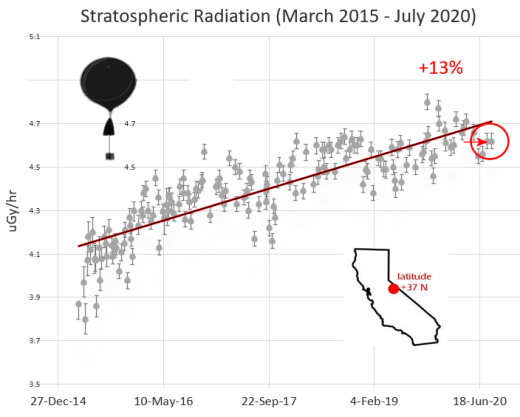
Above: The red circled data point was delivered by Mule Train
About 15 minutes after the payload came to rest in the Sierra backcountry, it was discovered by Will Ellis, a packer from Sierra Pack Station leading a train of mules along the John Muir trail. "It was only two feet from the trail," he says. "What are the odds?"
Will strapped the payload to the back of his lead mule, and proceeded to carry it almost 50 miles from the landing site to Red's Meadow, just outside Mammoth Lakes, California. From there, Will phoned Earth to Sky and returned the payload to some grateful young scientists.
Thank you Will Ellis and the Sierra Pack Station for helping us with our research!
MR. SPOCK IN THE STRATOSPHERE (COLLECTOR'S ITEM): If you would like to support the Earth to Sky Calculus cosmic ray ballooning program, there's a logical way to do it. Purchase Mr. Spock. Here is the green-blooded science officer floating 32.2 km (112,200 ft) above Death Valley National Park in central California:
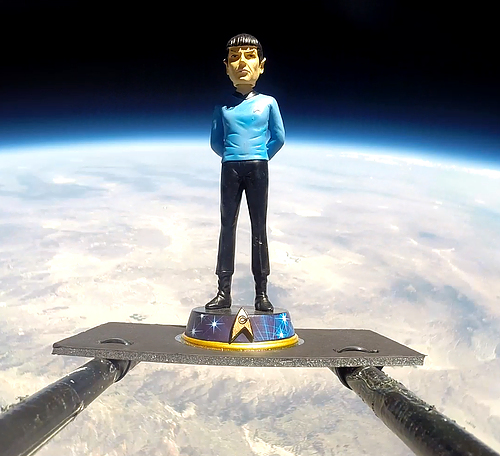
You can have him for $170.10. The price is the serial number of the Enterprise, NCC1701, divided by 10--a bargain on any planet! The students are selling Spock to buy more helium. He comes with a greeting card showing the high-quality resin bobblehead in flight and telling the story of his journey to the stratosphere and back again.
Far Out Gifts: Earth to Sky Store
All sales support hands-on STEM education
Realtime Aurora Photo Gallery
Free: Spaceweather.com Newsletter
Realtime Space Weather Photo Gallery
Free: Spaceweather.com Newsletter
Every night, a network of
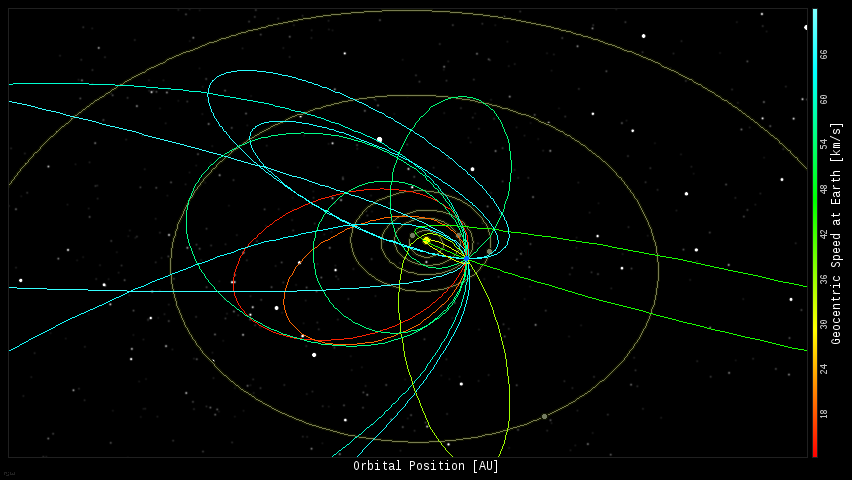
NASA all-sky cameras scans the skies above the United States for meteoritic fireballs. Automated software maintained by NASA's Meteoroid Environment Office calculates their orbits, velocity, penetration depth in Earth's atmosphere and many other characteristics. Daily results are presented here on Spaceweather.com.
On August 21, 2020, the network reported 47 fireballs.
(45 sporadics, 1 Northern iota Aquariid, 1 Southern Delta Aquariid)
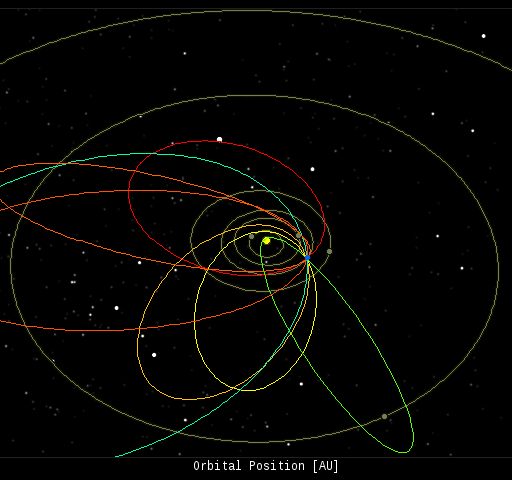
In this diagram of the inner solar system, all of the fireball orbits intersect at a single point--Earth. The orbits are color-coded by velocity, from slow (red) to fast (blue). [Larger image] [movies]
Potentially Hazardous Asteroids (
PHAs) are space rocks larger than approximately 100m that can come closer to Earth than 0.05 AU. None of the known PHAs is on a collision course with our planet, although astronomers are finding
new ones all the time.
On August 21, 2020 there were 2037 potentially hazardous asteroids.
 |
Recent & Upcoming Earth-asteroid encounters: | Asteroid | Date(UT) | Miss Distance | Velocity (km/s) | Diameter (m) |
| 2020 QG | 2020-Aug-16 | 0 LD | 12.3 | 4 |
| 2020 PJ2 | 2020-Aug-16 | 5.1 LD | 10 | 15 |
| 2020 QF1 | 2020-Aug-16 | 1.5 LD | 13.3 | 7 |
| 2020 QV3 | 2020-Aug-17 | 16.3 LD | 16.1 | 37 |
| 2020 QF2 | 2020-Aug-18 | 0.5 LD | 10.8 | 9 |
| 2020 PU1 | 2020-Aug-18 | 6.2 LD | 8.3 | 18 |
| 2020 QW | 2020-Aug-18 | 4.6 LD | 10.3 | 31 |
| 2020 QE1 | 2020-Aug-18 | 16.9 LD | 6.4 | 17 |
| 2020 QY | 2020-Aug-18 | 3.3 LD | 16.1 | 33 |
| 2020 QC | 2020-Aug-18 | 2 LD | 18.8 | 11 |
| 2020 PS | 2020-Aug-19 | 6.2 LD | 8.8 | 46 |
| 2020 QO1 | 2020-Aug-20 | 3.7 LD | 26.5 | 13 |
| 2020 PY2 | 2020-Aug-20 | 0.9 LD | 16.8 | 16 |
| 2020 QY2 | 2020-Aug-20 | 0.2 LD | 18.9 | 2 |
| 2020 PQ2 | 2020-Aug-21 | 4.6 LD | 19.7 | 50 |
| 2020 QP | 2020-Aug-21 | 16.1 LD | 24.7 | 56 |
| 2020 QF | 2020-Aug-23 | 9 LD | 6.9 | 13 |
| 2020 FA1 | 2020-Aug-23 | 18.4 LD | 1.9 | 20 |
| 2020 QD1 | 2020-Aug-23 | 10.1 LD | 13.5 | 16 |
| 2020 PP3 | 2020-Aug-24 | 16.2 LD | 9.5 | 37 |
| 2020 PJ6 | 2020-Aug-24 | 13.9 LD | 3.3 | 28 |
| 2020 QE2 | 2020-Aug-25 | 20 LD | 12.6 | 35 |
| 2020 QP1 | 2020-Aug-25 | 19.7 LD | 8.8 | 21 |
| 2016 AH164 | 2020-Aug-26 | 15.7 LD | 5.6 | 4 |
| 2020 PF3 | 2020-Aug-26 | 6.4 LD | 9.6 | 28 |
| 2020 QQ2 | 2020-Aug-27 | 8.6 LD | 6.2 | 16 |
| 2011 ES4 | 2020-Sep-01 | 0.3 LD | 8.2 | 30 |
| 2020 PG6 | 2020-Sep-02 | 5.9 LD | 6.6 | 14 |
| 465824 | 2020-Sep-06 | 19.4 LD | 14 | 162 |
| 2020 PT4 | 2020-Sep-08 | 4.9 LD | 12.6 | 39 |
| 2012 RM15 | 2020-Sep-12 | 14.9 LD | 9.8 | 45 |
| 2017 US | 2020-Sep-13 | 17.3 LD | 5.9 | 21 |
| 2020 QL2 | 2020-Sep-14 | 18 LD | 10.6 | 77 |
| 2014 QJ33 | 2020-Sep-18 | 11.5 LD | 8.3 | 65 |
| 2017 SL16 | 2020-Sep-20 | 8.9 LD | 6.4 | 25 |
| 2001 GP2 | 2020-Oct-01 | 6.1 LD | 2.2 | 15 |
| 2010 UC | 2020-Oct-04 | 14.6 LD | 3.2 | 12 |
| 2019 SB6 | 2020-Oct-07 | 11.9 LD | 7.6 | 16 |
| 2018 GD2 | 2020-Oct-13 | 16.4 LD | 6.7 | 5 |
Notes: LD means "Lunar Distance." 1 LD = 384,401 km, the distance between Earth and the Moon. 1 LD also equals 0.00256 AU. MAG is the visual magnitude of the asteroid on the date of closest approach. | | Cosmic Rays in the Atmosphere |
SOMETHING NEW! We have developed a new predictive model of aviation radiation. It's called E-RAD--short for Empirical RADiation model. We are constantly flying radiation sensors onboard airplanes over the US and and around the world, so far collecting more than 22,000 gps-tagged radiation measurements. Using this unique dataset, we can predict the dosage on any flight over the USA with an error no worse than 15%.
E-RAD lets us do something new: Every day we monitor approximately 1400 flights criss-crossing the 10 busiest routes in the continental USA. Typically, this includes more than 80,000 passengers per day. E-RAD calculates the radiation exposure for every single flight.
The Hot Flights Table is a daily summary of these calculations. It shows the 5 charter flights with the highest dose rates; the 5 commercial flights with the highest dose rates; 5 commercial flights with near-average dose rates; and the 5 commercial flights with the lowest dose rates. Passengers typically experience dose rates that are 20 to 70 times higher than natural radiation at sea level.
To measure radiation on airplanes, we use the same sensors we fly to the stratosphere onboard Earth to Sky Calculus cosmic ray balloons: neutron bubble chambers and X-ray/gamma-ray Geiger tubes sensitive to energies between 10 keV and 20 MeV. These energies span the range of medical X-ray machines and airport security scanners.
Column definitions: (1) The flight number; (2) The maximum dose rate during the flight, expressed in units of natural radiation at sea level; (3) The maximum altitude of the plane in feet above sea level; (4) Departure city; (5) Arrival city; (6) Duration of the flight.
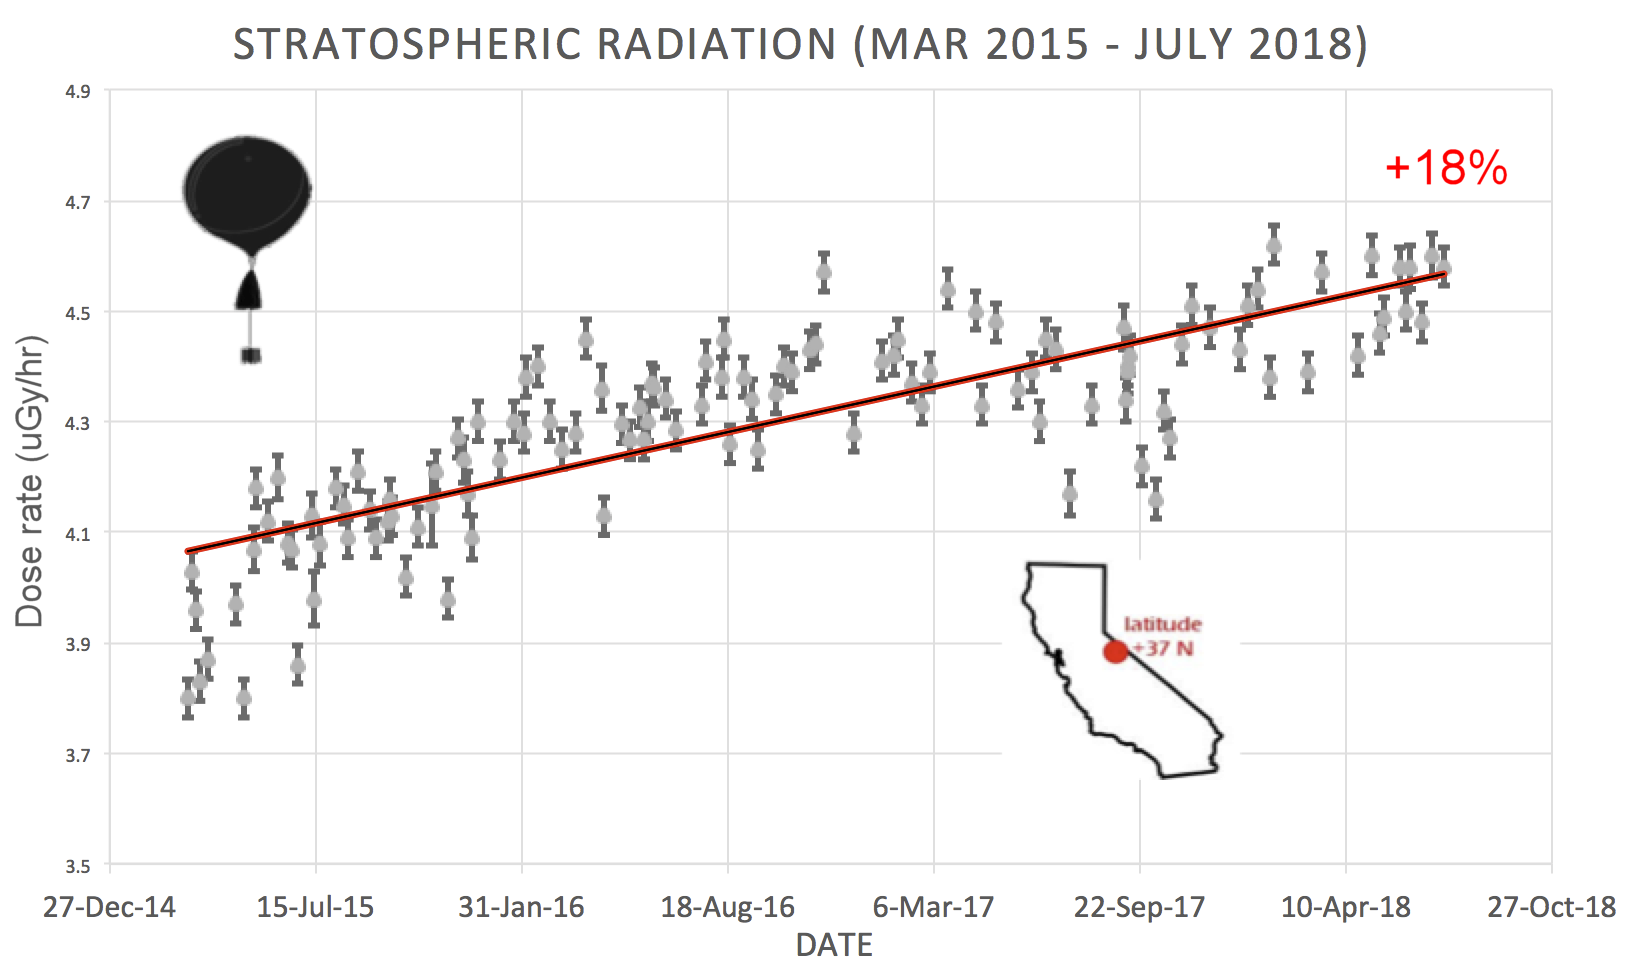
SPACE WEATHER BALLOON DATA: Approximately once a week, Spaceweather.com and the students of Earth to Sky Calculus fly space weather balloons to the stratosphere over California. These balloons are equipped with radiation sensors that detect cosmic rays, a surprisingly "down to Earth" form of space weather. Cosmic rays can seed clouds, trigger lightning, and penetrate commercial airplanes. Furthermore, there are studies ( #1, #2, #3, #4) linking cosmic rays with cardiac arrhythmias and sudden cardiac death in the general population. Our latest measurements show that cosmic rays are intensifying, with an increase of more than 18% since 2015:

The data points in the graph above correspond to the peak of the Regener-Pfotzer maximum, which lies about 67,000 feet above central California. When cosmic rays crash into Earth's atmosphere, they produce a spray of secondary particles that is most intense at the entrance to the stratosphere. Physicists Eric Reneger and Georg Pfotzer discovered the maximum using balloons in the 1930s and it is what we are measuring today.
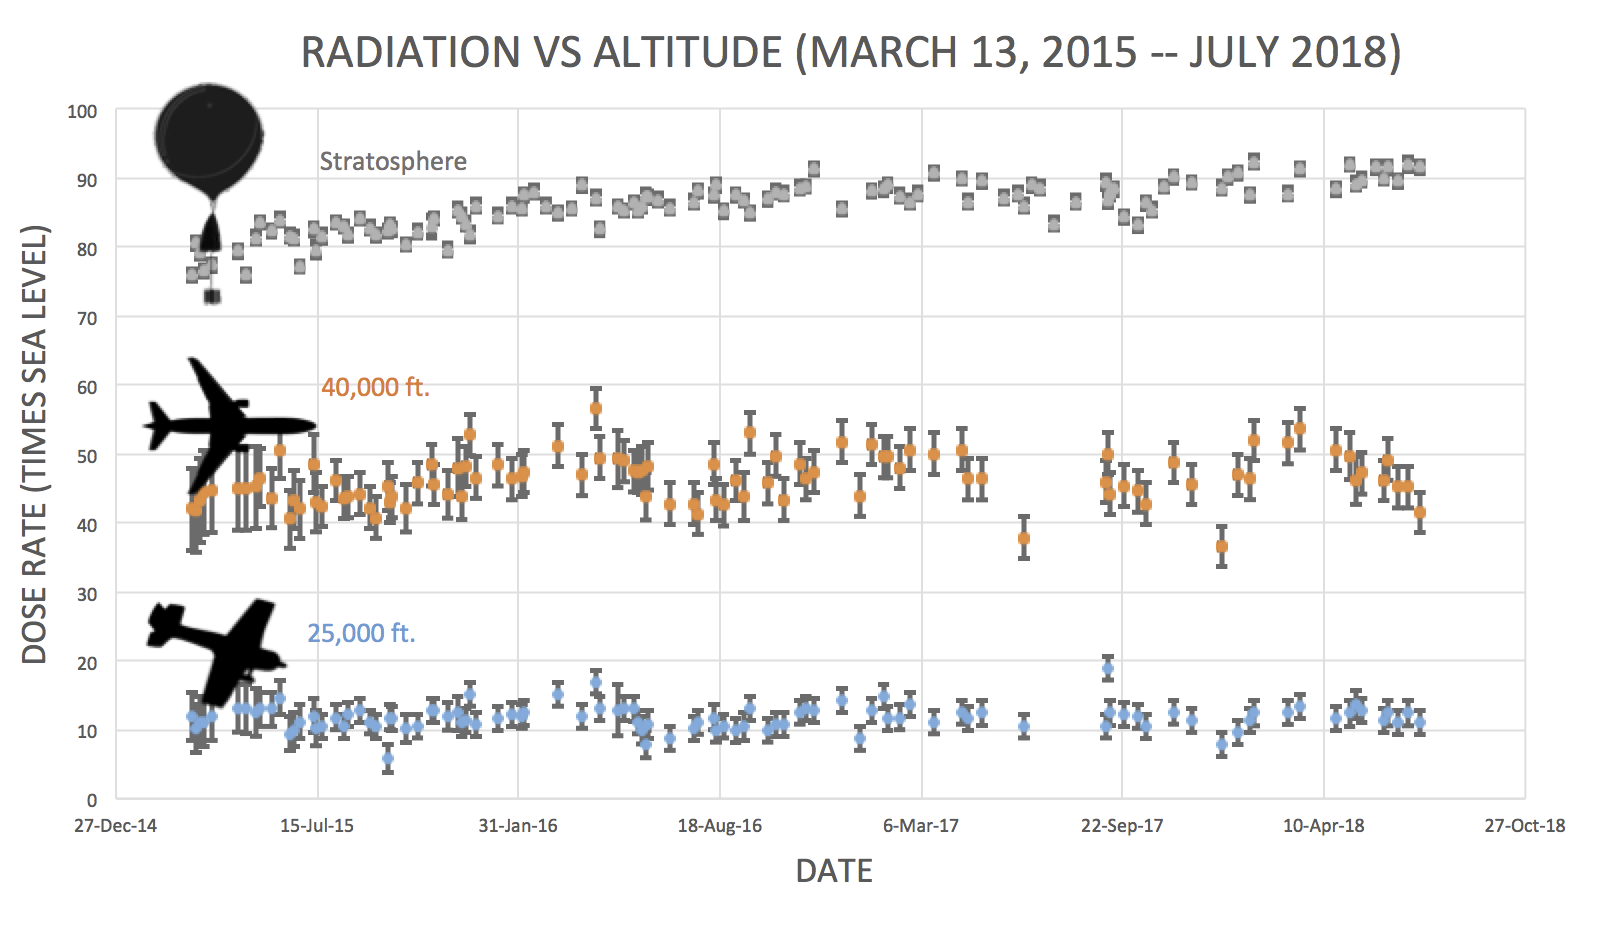
En route to the stratosphere, our sensors also pass through aviation altitudes:

In this plot, dose rates are expessed as multiples of sea level. For instance, we see that boarding a plane that flies at 25,000 feet exposes passengers to dose rates ~10x higher than sea level. At 40,000 feet, the multiplier is closer to 50x.
The radiation sensors onboard our helium balloons detect X-rays and gamma-rays in the energy range 10 keV to 20 MeV. These energies span the range of medical X-ray machines and airport security scanners.
Why are cosmic rays intensifying? The main reason is the sun. Solar storm clouds such as coronal mass ejections (CMEs) sweep aside cosmic rays when they pass by Earth. During Solar Maximum, CMEs are abundant and cosmic rays are held at bay. Now, however, the solar cycle is swinging toward Solar Minimum, allowing cosmic rays to return. Another reason could be the weakening of Earth's magnetic field, which helps protect us from deep-space radiation.
| | The official U.S. government space weather bureau |
| | The first place to look for information about sundogs, pillars, rainbows and related phenomena. |
| | Researchers call it a "Hubble for the sun." SDO is the most advanced solar observatory ever. |
| | 3D views of the sun from NASA's Solar and Terrestrial Relations Observatory |
| | Realtime and archival images of the Sun from SOHO. |
| | from the NOAA Space Environment Center |
| | fun to read, but should be taken with a grain of salt! Forecasts looking ahead more than a few days are often wrong. |
| | from the NOAA Space Environment Center |
| | the underlying science of space weather |
 | To find reviews of new online casino sites in the UK try The Casino DB where there are hundreds of online casino reviews complete with bonuses and ratings. Get a bonus when playing at a new casino in the UK. The Genie got you covered! Looking for a new online casino? Try Casimpo the new site dedicated to making online casino simple, or check out the new Avenger Slots Casino and Slot Strike Casino Sites with over 500 online slots and casino games. . |
| | These links help Spaceweather.com stay online. Thank you to our supporters! |
| | | | | | |


